HESSD
7, 7059–7078, 2010Regional flow duration curves for
ungauged sites in Sicily
F. Viola et al.
Title Page
Abstract Introduction
Conclusions References
Tables Figures
◭ ◮
◭ ◮
Back Close
Full Screen / Esc
Printer-friendly Version
Interactive Discussion
Discussion
P
a
per
|
Dis
cussion
P
a
per
|
Discussion
P
a
per
|
Discussio
n
P
a
per
|
Hydrol. Earth Syst. Sci. Discuss., 7, 7059–7078, 2010 www.hydrol-earth-syst-sci-discuss.net/7/7059/2010/ doi:10.5194/hessd-7-7059-2010
© Author(s) 2010. CC Attribution 3.0 License.
Hydrology and Earth System Sciences Discussions
This discussion paper is/has been under review for the journal Hydrology and Earth System Sciences (HESS). Please refer to the corresponding final paper in HESS if available.
Regional flow duration curves for
ungauged sites in Sicily
F. Viola, L. V. Noto, M. Cannarozzo, and G. La Loggia
Dipartimento d’Ingegneria Idraulica ed Applicazioni Ambientali, Universit `a degli Studi di Palermo, Palermo, Italia
Received: 5 August 2010 – Accepted: 14 August 2010 – Published: 20 September 2010
Correspondence to: F. Viola ([email protected])
Published by Copernicus Publications on behalf of the European Geosciences Union.
HESSD
7, 7059–7078, 2010Regional flow duration curves for
ungauged sites in Sicily
F. Viola et al.
Title Page
Abstract Introduction
Conclusions References
Tables Figures
◭ ◮
◭ ◮
Back Close
Full Screen / Esc
Printer-friendly Version
Interactive Discussion
Discussion
P
a
per
|
Dis
cussion
P
a
per
|
Discussion
P
a
per
|
Discussio
n
P
a
per
|
Abstract
Flow duration curves are simple and powerful tools to deal with many hydrological and environmental problems related to water quality assessment, water-use assessment and water allocation. Unfortunately the scarcity of streamflow data enables the use of these instruments only for gauged basins. A regional model is developed here for
5
estimating flow duration curves at ungauged basins in Sicily, Italy. Due to the com-plex ephemeral behaviour of the examined region, this study distinguishes dry periods, when flows are zero, from wet periods using a three parameters power law to describe the frequency distribution of flows. A large dataset of streamflows has been analysed and the parameters of flow duration curves have been derived for about fifty basins.
10
Regional regression equations have been developed to derive flow duration curves starting from morphological basin characteristics.
1 Introduction
One of the most commonly used tools in hydrology is the flow duration curve (FDC), which provides a graphical representation of the frequency distribution of the complete
15
flow regime of a catchment. Using the FDC, it is possible to estimate the percent-age of time that a specified flow is equaled to or exceeded. This type of information is commonly used for resource assessments including hydropower design schemes, water supply, planning and design of irrigation systems and water quality assessment with applications to stream-pollution and the evaluation of river habitats. Vogel and
20
Fennessey (1995) presented a comprehensive review of FDC applications in water resources planning and management.
There are two interpretations of FDC: the traditional is reported in literature as period-of-record FDC, while the second, introduced by Vogel and Fennessey (1994), refers to annual interpretation of FDC (AFDC). In the first approach (Smakhtin, 2001), FDC
con-25
HESSD
7, 7059–7078, 2010Regional flow duration curves for
ungauged sites in Sicily
F. Viola et al.
Title Page
Abstract Introduction
Conclusions References
Tables Figures
◭ ◮
◭ ◮
Back Close
Full Screen / Esc
Printer-friendly Version
Interactive Discussion
Discussion
P
a
per
|
Dis
cussion
P
a
per
|
Discussion
P
a
per
|
Discussio
n
P
a
per
|
over the whole available period of records. The second approach considers FDC’s for individual years, using only the hydrometric information collected in a calendar or wa-ter year. Vogel and Fennessey (1994) illustrated how to derive for gauged river basins (a) the median AFDC, which represents the distribution of streamflows in a median hy-pothetical year and is not affected by the observation of abnormally wet or dry periods
5
during the period of record, (b) the confidence intervals around the median FDC, sum-marizing the observed inter-annual variability of streamflows, (c) the AFDC associated with a given recurrence interval.
A FDC can be easily derived from gauged river flow data at a daily or monthly time scale. The data are ranked in descending order and each ordered value is associated
10
with an exceedance probability, for example, through a plotting position formula. The lack of streamgauges and the limited amount of streamflow observations characterises several geographical areas around the world and, from this point of view, Sicily is not an exception. This condition led to the formulation and proposal of numerous procedures for regionalizing FDC, whose aim is the estimation of FDC at ungauged river basins
15
or the enhancement of empirical FDC derived for streamgauges where only a limited amount of hydrometric information is available. A rough classification of the available regionalization procedures distinguishes two approaches: statistical and parametric. The first procedure considers FDC as the complement of the cumulative frequency distribution of streamflows, while the second one does not make any connection
be-20
tween FDC and the probability theory (Castellarin et al., 2004).
The statistical procedures use stochastic models to represent FDC. In this case a suitable probability distribution is chosen as the parent distribution for a particular region and the distribution parameters are estimated on a local basis for the gauged river basins located in the study region using the streamflow observations. Ganora
25
et al. (2009) observed that theoretically FDC could not be interpreted as a probability curve since discharge is correlated between successive time intervals and discharge characteristics are dependent on the season. However, the FDC is often interpreted as probability distribution and the most used distribution is the log-normal, which has been
HESSD
7, 7059–7078, 2010Regional flow duration curves for
ungauged sites in Sicily
F. Viola et al.
Title Page
Abstract Introduction
Conclusions References
Tables Figures
◭ ◮
◭ ◮
Back Close
Full Screen / Esc
Printer-friendly Version
Interactive Discussion
Discussion
P
a
per
|
Dis
cussion
P
a
per
|
Discussion
P
a
per
|
Discussio
n
P
a
per
|
proposed by Beard (1943) and successfully used by several authors (Fennessey and Vogel, 1990). Other authors used different distributions as the beta (Iacobellis, 2008) or the kappa (Castellarin et al., 2007). The use of complex distributions with more than two parameters is often justified by the greater flexibility that they offer in the represen-tation of the runoff frequency regime. Castellarin et al. (2007) for example observed
5
that in the L moment ratios diagram the sample L-skewness and L-kurtosis for the empirical series of dimensionless daily streamflows are evenly scattered over a finite portion of the diagram. This condition cannot be adequately interpreted by a single two or three parameter distribution while it is manageable with the four parameter kappa distribution.
10
After the distribution choice, regional regression models are then identified for predicting the distribution parameters at ungauged basins on the basis of geo-morphological and climatic characteristics of the basins.
In the parametric approach, the representation of the FDC is achieved by analytical relationships. The parameters of the relationships for ungauged river basins can then
15
be estimated through regional models, in the same way as the parameters of the parent distribution, for the statistical approaches are linked to morpho-climatic data.
There are numerous examples in the literature of regional models for estimating the FDC from relationships between these measures and physical characteristics of a catchment. Often these studies regard large catchments with perennial flows, as
20
Canada (Leboutillier and Waylen, 1993), India (Singh et al., 2001), Italy (Castellarin et al., 2004, 2007; Franchini and Suppo, 1996; Iacobellis, 2008; Ganora et al., 2009), Greece (Niadas, 2005), Taiwan (Yu et al., 2002), Philippines (Quimpo et al., 1983), South Africa (Smakhtin et al., 1997) and United States (Fennessey and Vogel, 1990). It is important to point out that analysis of FDC for small catchments with ephemeral
25
HESSD
7, 7059–7078, 2010Regional flow duration curves for
ungauged sites in Sicily
F. Viola et al.
Title Page
Abstract Introduction
Conclusions References
Tables Figures
◭ ◮
◭ ◮
Back Close
Full Screen / Esc
Printer-friendly Version
Interactive Discussion
Discussion
P
a
per
|
Dis
cussion
P
a
per
|
Discussion
P
a
per
|
Discussio
n
P
a
per
|
This paper describes a regional model to derive a period of record FDC’s in Sicily where catchments are relatively small and often characterised by ephemeral flows. The model has been developed using a data set of gauged flow records for 53 catch-ments, most of which contain significant periods of zero flow values. The model com-bines a simple model for predicting the percentage of time the river is wet (or dry) with
5
a model for predicting a FDC for the non-zero period using the parametric approach. FDC’s are described using a three parameters power law which has been fitted on all the available time series. The model parameters then relates to morphological basin characteristics, developing three sets of regional regression equations for the three homogeneous sub-areas individuated over the whole study region.
10
2 Study area and dataset
This study has been carried out for the catchments of the largest island in the Mediter-ranean Sea: Sicily which extends over an area of 25 700 km2. The mean annual rainfall over the island is about 715 mm (period 1921–2004); precipitations are concentrated in the winter period while the July–August months are usually rainless.
15
Daily flows have been provided for the study by OA-ARRA (Osservatorio delle Acque
– Agenzia Regionale per i Rifiuti e le Acque). The working period of most gauging sites
starts in the middle 1950s since only few stations give runoffdata previous to this year. This fact suggested the opportunity to limit the analysis to the 43-yr period ranging from 1955 to 1997. Only unregulated basins with at least ten years of data have been
20
examined, reducing the number of stations used in this study to 53. The mean daily flows of the dataset vary from 0.04 to 7.6 m3/s; the maximum record length is 43 yr (Oreto at Parco) while the mean sample size is about 20 yr.
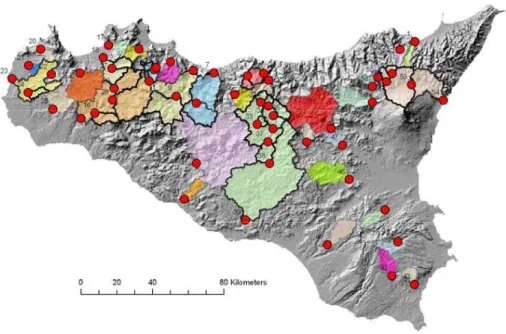
Catchment areas of these sites (Fig. 1) range from 10 km2 (Eleuterio at Lupo) to 1782 km2 (Imera Meridionale at Drasi). The average annual precipitation varies
be-25
tween 450 mm in the south-west up to more than 1100 mm reached in the north-east of the island and the catchments have a mean elevation varying from 113 m up to
HESSD
7, 7059–7078, 2010Regional flow duration curves for
ungauged sites in Sicily
F. Viola et al.
Title Page
Abstract Introduction
Conclusions References
Tables Figures
◭ ◮
◭ ◮
Back Close
Full Screen / Esc
Printer-friendly Version
Interactive Discussion
Discussion
P
a
per
|
Dis
cussion
P
a
per
|
Discussion
P
a
per
|
Discussio
n
P
a
per
|
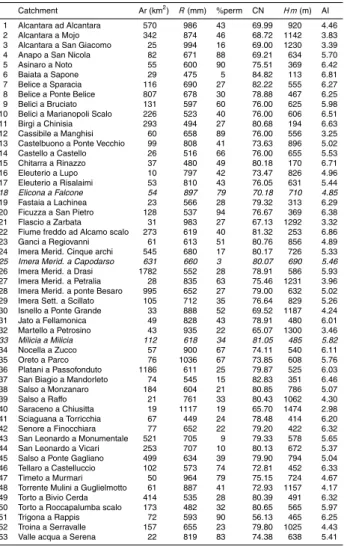
1474 m a.s.l. Geological information are summarized by the percentage of permeable area provided by the OA-ARRA: the basins ensemble comprises almost all the possi-ble conditions, from 3% to 94%. Curve Number values (SCS, 1972), describing land cover and hydrologic soil properties, vary from 56 to 84.
The most of the catchment characteristics used in this study comes directly from
5
a GIS based tool called SIRI (Sistema Informativo Regionale Idrologico – Hydrological Regional Information System) (Noto et al., 2001; Noto and La Loggia, 2009) or is easily derivable within it; among these characteristics, the following ones have been computed: the basin area (Ar, km2), the mean areal annual precipitation (R, mm), the average basin elevation (Hm, m), the mean areal value of Curve Number (CN, –),
10
the percentage of permeable area (%perm, –). Following Thornthwaite (1948) also the Aridity Index (AI) has been calculated. Table 1 shows relevant morpho-climatic catchment characteristics used in this study.
3 Methodology
Considering that several Sicilian catchments are ephemeral, the proposed model has
15
to distinguish between wet periods, in which flows are different from zero, and dry periods, when flow is absent. For each gauged catchment used in the study, the rel-ative duration of wet periods,Dw, can be identified and easily calculated starting from streamflow data.
Once Dw has been obtained it is possible to focus the attention on the non-zero
20
streamflow historical series. The observed positive streamflows are ranked to produce a set of ordered streamflowsQobs,i,i=1,2,...,N, whereN is the sample length. Each ordered observationQobs,i, has been then plotted against its relative duration obtaining the empirical FDC for wet periods:
D(Qobs,i)=1− i
N+1 (1)
HESSD
7, 7059–7078, 2010Regional flow duration curves for
ungauged sites in Sicily
F. Viola et al.
Title Page
Abstract Introduction
Conclusions References
Tables Figures
◭ ◮
◭ ◮
Back Close
Full Screen / Esc
Printer-friendly Version
Interactive Discussion
Discussion
P
a
per
|
Dis
cussion
P
a
per
|
Discussion
P
a
per
|
Discussio
n
P
a
per
|
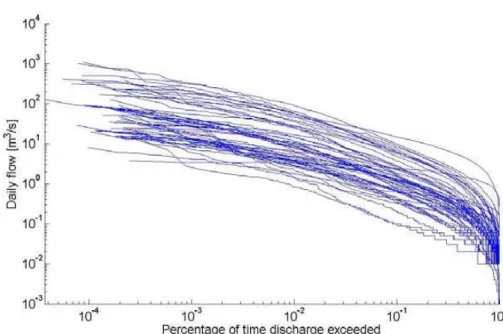
The empirical FDC derived from the non-zero flow data (EFDCnz) for the study catch-ments in Sicily are presented in Fig. 2, plotted on log-axes. One can observe that FDCnz’s are step functions for very small non-zero flows as a consequence of typical
rounding errors for low flows.
The EFDCnz’s plotted on lognormal probability paper are not approximated through
5
a straight line, pointing out that the lognormal distribution does not represent a suitable parent distribution for daily streamflow in the Sicilian catchments contrary to most of previous studies cited in the introduction. Several other distributions have been tested but none of those was satisfactory and, for this reason, the stochastic approach has been discarded in favour of the parametric approach.
10
In order to represent FDCnz’s during wet periods, a two parameters power relation-ship has been chosen as follows:
Q(D∗
)=a
1−D∗ D∗
b
(2)
where D∗ is the relative duration during wet periods. The parameters a and b can be estimated using the least square errors method in the range of relative duration
15
between 0.05 and 1.
The proposed FDC can be viewed as an integration of information coming from the dry and wet periods. The first are characterised by zero flow with relative duration (1−Dw), while the streamflows during the wet periods, which lastDw, are fully described by Eq. (2). Trying to merge these periods, FDC can be rewritten over the whole range
20
of durations using this simple relation:
Q(D)=
aDw
D −1
b
0≤D≤Dw
0 Dw< D≤1
(3)
where D is the relative duration during the whole year and a and b are the same parameters of Eq. (2). The above equation rescales the FDCnz on the interval
[0.05:Dw], which is the wet period, and givesQ=0 in dry periods.
25
HESSD
7, 7059–7078, 2010Regional flow duration curves for
ungauged sites in Sicily
F. Viola et al.
Title Page
Abstract Introduction
Conclusions References
Tables Figures
◭ ◮
◭ ◮
Back Close
Full Screen / Esc
Printer-friendly Version
Interactive Discussion
Discussion
P
a
per
|
Dis
cussion
P
a
per
|
Discussion
P
a
per
|
Discussio
n
P
a
per
|
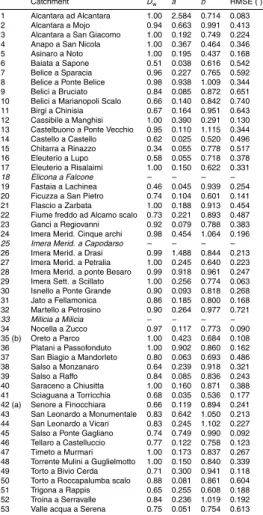
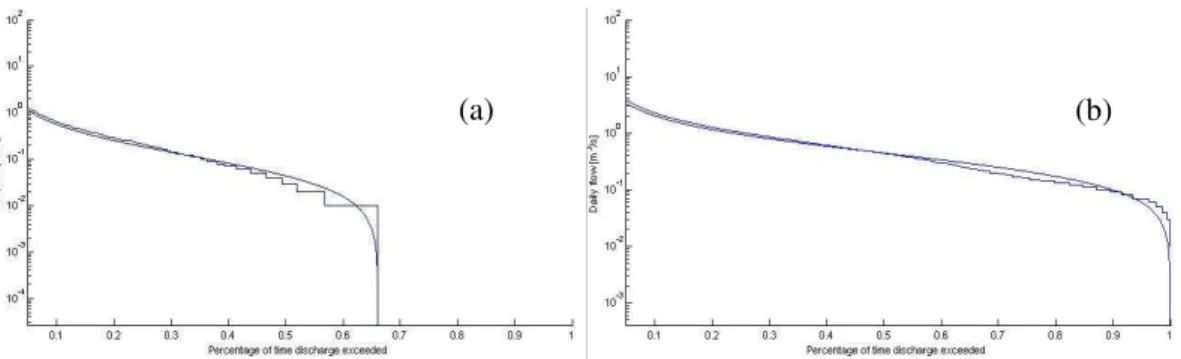
The three model parameters (Dw,aandb) have been estimated on 50 basins while
the remaining three basins have been hidden for validation purposes. From Eq. (3) it is clear that the model is able to deal both with ephemeral or perennial flows. Here two FDCs, one ephemeral and one perennial, computed using the proposed procedure are presented to describe the model potentialities. The results shown in Fig. 3 point
5
out the different hydrological regime between “Senore at Finocchiara” basin (a), with ephemeral flows, and the “Oreto at Parco” basin (b), which instead has continuous flows. The same figure shows a good fit between empirical and estimated FDC’s in both ephemeral and perennial conditions for the range of durations 0.05:1, with some critical divergences for extreme flows. It is worth to point out that in this study almost the
10
whole range of duration is studied and represented while previous works considered only restricted ranges of durations. For example, Fennessey and Vogel (1990) used the range 0.50:0.99 or Castellarin et al. (2004) similarly analysed the range 0.30:0.99. As a performance index, the root mean square error (RMSE) has been evaluated and normalized by the mean daily flow. This performance index, equal to 0.24 for
15
case (a) and equal to 0.15 for case (b) is listed in Table 2 together with the model parameters calculated for the 50 considered basins. This index is largely influenced by the hydrological behaviour of the catchments, in fact it goes up to 0.7 for small catchments (less than 200 km2) while it decreases to 0.2 for large basins.
4 The regional model
20
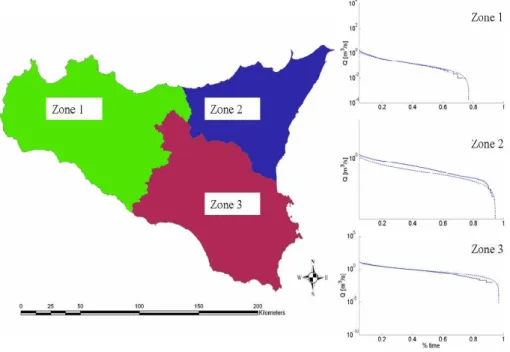
Regressive methods have been used to link the three model parameters (Dw,aandb)
to some catchment characteristics such as climatic indexes, geolithologic and geope-dologic parameters, land coverage and geomorphic parameters. This analysis has been performed dividing the island into three sub-zones, as summarized in Fig. 4, us-ing the homogeneous regions suggested by Cannarozzo et al. (1995). Most of the
25
HESSD
7, 7059–7078, 2010Regional flow duration curves for
ungauged sites in Sicily
F. Viola et al.
Title Page
Abstract Introduction
Conclusions References
Tables Figures
◭ ◮
◭ ◮
Back Close
Full Screen / Esc
Printer-friendly Version
Interactive Discussion
Discussion
P
a
per
|
Dis
cussion
P
a
per
|
Discussion
P
a
per
|
Discussio
n
P
a
per
|
average area of the basins in this area is 200 km2, ranging from 10 up to 1186 km2. The sub-Zone 2 has the lower number of stations, but it is also the smallest sub-area. The mean annual rainfall is around 900 mm, higher than the regional value and the basins inside this zone are characterised by relatively small size and steep slopes, es-pecially in the north-east part. The sub-Zone 3 is located in the south-east part of the
5
island and contains 15 stations. The average annual rainfall equals to 620 mm, is lower than the regional value and the average size of the considered basins is about 300 km2. The homogeneity of this region has been tested in terms of annual flow (Cannarozzo et al., 2009) using the homogeneity test of Hosking and Wallis (1997).
The regressive method used in this study has the following structure:
10
[Dw,a,b]=k0+ Npar
X
i=1
kiCi (4)
where Ci are the catchment characteristics or their logarithmic transformations and parametersk0andki are determined through a multiple regression.
Stepwise regression (Hocking, 1976) has been used to select the optimal set of vari-ables reflecting the geomorphological and climatic effects. This method adds additional
15
independent variables one by one, in successive steps, each raising the dimensions of the analysis by one. The most promising independent variable, i.e. the one that pro-vides the greatest reduction in the unexplained variation in the dependent variable (Dw, aorb), is selected at every stage. Then there is a re-examination of all the variables included in the previous steps. A variable that becomes superfluous because of its
20
relationship with other variables in the model is then excluded. It has been decided not to use variables explaining less than 5% of the variance. The use of stepwise regres-sive analysis has led to the determination of three equations for each sub-zone which relate model parameters to the above mentioned catchment characteristics. In order to give a unique formulation for all the considered sub-zones, the following equation
25
HESSD
7, 7059–7078, 2010Regional flow duration curves for
ungauged sites in Sicily
F. Viola et al.
Title Page
Abstract Introduction
Conclusions References
Tables Figures
◭ ◮
◭ ◮
Back Close
Full Screen / Esc
Printer-friendly Version
Interactive Discussion
Discussion
P
a
per
|
Dis
cussion
P
a
per
|
Discussion
P
a
per
|
Discussio
n
P
a
per
|
types have been chosen:
Dw=j0+j1ln(Ar)+j2ln(R) (5a)
a=m0+m1(Ar)+m2ln(R)+m3ln(CN) (5b)
b=n0+n1(%perm)+n2ln(Ar)+n3ln(R)+n4ln(CN) (5c)
The regional parameters for the three considered sub-zones are reported in Table 3.
5
The relative duration of wet periods has been related to the catchment area and to the mean annual rainfall. This relation is consistent with the technical experience which suggests that small basins in arid zones have a more ephemeral behaviour than large catchments in humid contexts. A similar kind of relation was also found by Croker et al. (2003) who related the probability of dry periods in Portugal to the mean annual
10
rainfall. The relative duration of wet periods is estimated satisfactorily in the three sub zones; the best result is obtained in the sub-Zone 2 (R2=0.82, RMSE=0.04) while the lower performance is in the sub-Zone 3 (R2=0.50, RMSE=0.114).
The parametera has been linked to the basin area, to the mean annual rainfall and to the mean areal value of Curve Number. This parameter is crucial in determining
15
the scale of the process which in turn is driven by the basin morphology and by cli-mate. In this sense the chosen relation is convincing from a physical point of view. In fact, the more large, humid and impermeable the basins are the higher goes the FDC. Also Fennessey and Vogel (1990) related the scale parameter, which in that case was the µ parameter of a log-normal distribution, to the basin area obtaining an
20
excellent coefficient of determination (0.99). Smakhtin et al. (1997) used as a FDC scale parameter the mean daily discharge relating to the last catchment area and to the mean annual precipitation. Croker et al. (2003) linked the scale parameter of their model for ephemeral catchments to the mean annual rainfall and to the soil character-istics, explaining about the 63% variance of the flow equaled or exceeded for 80% of
25
HESSD
7, 7059–7078, 2010Regional flow duration curves for
ungauged sites in Sicily
F. Viola et al.
Title Page
Abstract Introduction
Conclusions References
Tables Figures
◭ ◮
◭ ◮
Back Close
Full Screen / Esc
Printer-friendly Version
Interactive Discussion
Discussion
P
a
per
|
Dis
cussion
P
a
per
|
Discussion
P
a
per
|
Discussio
n
P
a
per
|
the basin elevation. The parametera of the model here proposed is really well esti-mated in all the three sub-zones with a maximum ofR2=0.95 and RMSE=0.09 in the sub-Zone 3.
Finally, the parameter b, which determines the shape of FDC’s, has been related to the catchment area, to the mean annual rainfall, to the percentage of permeable
5
area and to the mean areal value of Curve Number. Fennessey and Vogel (1990) individuated a simple relation between the shape parameter of their FDC, which was theσ parameter of a log-normal distribution, and the average basin elevation with an R2=0.72. Also the formulation here proposed contains implicitly a link between b and the average basin elevation because there is a strong correlation between this
10
parameter and the annual rainfall (R2=0.60). Castellarin et al. (2004) related the σ parameter of a log-normal distribution to the permeable portion of the basin area, to the average basin elevation and to the mean annual net precipitation with a Nash and Sutcliffe index (Nash, 1970) of 0.52. The parameter b of the model proposed here is reproduced in an acceptable way, with the exception of the sub-Zone 1 (R2=0.42,
15
RMSE=0.107).
The regional model has been positively validated using one basin for each sub-zone hidden in the original dataset. The comparison between empirical and estimated FDC’s obtained using the regional model are shown in Fig. 4. Notwithstanding there is a slight overestimation of the wet period duration (about 5%), the fitting is quite good
20
for all the considered cases. The adimensionalized RMSE is equal to 0.24, 0.32, 0.28, respectively for the sub-Zones 1, 2, 3.
5 Conclusions
This paper presents a regional model for estimating flow duration curves in Sicily. The model has three parameters: one for individuating the relative duration of wet periods
25
with non-zero flows and two for describing the relative duration of non-zero flows in wet periods. These parameters have been calculated for 53 Sicilian catchments. The analysed basins present different flow behaviours (perennial or ephemeral) and cover
HESSD
7, 7059–7078, 2010Regional flow duration curves for
ungauged sites in Sicily
F. Viola et al.
Title Page
Abstract Introduction
Conclusions References
Tables Figures
◭ ◮
◭ ◮
Back Close
Full Screen / Esc
Printer-friendly Version
Interactive Discussion
Discussion
P
a
per
|
Dis
cussion
P
a
per
|
Discussion
P
a
per
|
Discussio
n
P
a
per
|
a large range of morpho-climatic characteristics. The parametric model here proposed is able to satisfactorily reproduce the empirical FDC’s, with some exceptions for high streamflows, usually not considered in this kind of study.
The model parameters have been linked to peculiar catchment characteristics as the area, the mean annual rainfall and the mean areal value of Curve Number. This
5
study considers three sub-zones in the island and, for each zone calculates the model parameters using a unique formulation.
The model has been validated on one basin for each sub-zone, hidden in calibration, obtaining satisfactory results in terms of FDC fitting. The simplicity of the model struc-ture and the link with simple morpho-climatic characteristics, also available on a GIS
10
based tool called SIRI, makes the proposed model a valuable “first approximation” tool for water resources assessment in ungauged basins in Sicily.
References
Beard, L. R.: Statistical analysis in hydrology, Trans., ASCE, 108, 1110–1160, 1943.
Cannarozzo, M., D’Asaro, F., and Ferro, V.: Regional rainfall and flood frequency-analysis for
15
Sicily using the 2-component extreme-value distribution, Hydrolog. Sci. J., 40, 19–42, 1995. Cannarozzo, M., Noto, L. V., Viola, F., and La Loggia, G.: Annual runoff regional frequency
analysis in Sicily, Phys. Chem. Earth, 34, 679–687, 2009.
Castellarin, A., Galeati, G., Brandimarte, L., Montanari, A., and Brath, A.: Regional flow-duration curves: reliability for ungauged basins, Adv. Water Resour., 27, 953–965, 2004.
20
Castellarin, A., Camorani, G., and Brath, A.: Predicting annual and long-term flow-duration curves in ungauged basins, Adv. Water Resour., 30, 937–953, 2007.
Croker, K. M., Young, A. R., Zaidman, M. D., and Rees, H. G.: Flow duration curve estimation in ephemeral catchments in Portugal, Hydrolog. Sci. J., 48, 427–439, 2003.
Fennessey, N. and Vogel, R. M.: Regional flow-duration curves for ungauged sites in
Mas-25
sachusetts, J. Water Res. Pl.-ASCE, 116, 530–549, 1990.
Franchini, M. and Suppo, M.: Regional analysis of flow duration curves for a limestone region, Water Resour. Manag., 10, 199–218, 1996.
nonpara-HESSD
7, 7059–7078, 2010Regional flow duration curves for
ungauged sites in Sicily
F. Viola et al.
Title Page
Abstract Introduction
Conclusions References
Tables Figures
◭ ◮
◭ ◮
Back Close
Full Screen / Esc
Printer-friendly Version
Interactive Discussion
Discussion
P
a
per
|
Dis
cussion
P
a
per
|
Discussion
P
a
per
|
Discussio
n
P
a
per
|
metric flow duration curves in ungauged basins, Water Resour. Res., 45, W10418, doi:10.1029/2008WR007472, 2009.
Hocking, R. R.: The Analysis and selection of variables in linear regression, Biometrics, 32, 1–49, 1976.
Hosking, J. and Wallis, J.: Regional Frequency Analysis: An Approach Based on L-Moments,
5
Cambridge University Press, New York, 1997.
Iacobellis, V.: Probabilistic model for the estimation of T year flow duration curves, Water Re-sour. Res., 44, W02413, doi:10.1029/2006WR005400, 2008.
Leboutillier, D. W. and Waylen, P. R.: Regional variations in flow-duration curves for rivers in British-Columbia, Canada, Phys. Geogr., 14, 359–378, 1993.
10
Nash, J. E. and Sutcliffe, J. V.: River flow forecasting through conceptual models, 1. A discus-sion of principles, J. Hydrol., 10, 282–290, 1970.
Niadas, I. A.: Regional flow duration curve estimation in small ungauged catchments using instantaneous flow measurements and a censored data approach, J. Hydrol., 314, 48–66, 2005.
15
Noto, L., La Loggia, G., and Pirrello, M.: Un Sistema Informativo Territoriale per l’analisi del ris-chio idraulico delle infrastrutture viarie, 5a Conferenza Nazionale ASITA, Rimini, Italy, 2001, Noto, L. V. and La Loggia, G.: Use of L-moments approach for regional flood frequency analysis
in Sicily, Italy, Water Resour. Manag., 23, 2207–2229, 2009.
Quimpo, R., Alejandrino, A., and McNally, T.: Regionalised flow duration curves for Philippines,
20
J. Water Res. Pl.-ASCE, 109 (4), 320–330, 1983.
Singh, R. D., Mishra, S. K., and Chowdhary, H.: Regional flow-duration models for large number of ungauged Himalayan catchments for planning microhydro projects, J. Hydrol. Eng., 6, 310–316, 2001.
Smakhtin, V. U.: Low flow hydrology: a review, J. Hydrol., 240, 147–186, 2001.
25
Smakhtin, V. Y., Hughes, D. A., and Creuse-Naudin, E.: Regionalization of daily flow character-istics in part of the Eastern Cape, South Africa, Hydrolog. Sci. J., 42, 919–936, 1997. Vogel, R. M. and Fennessey, N. M.: Flow-duration curves. 2. New interpretation and
confidence-intervals, J. Water Res. Pl.-ASCE, 120, 485–504, 1994.
Vogel, R. M. and Fennessey, N. M.: Flow duration curves. 2. A review of applications in
water-30
resources planning, Water Resour. Bull., 31, 1029–1039, 1995.
Yu, P. S., Yang, T. C., and Wang, Y. C.: Uncertainty analysis of regional flow duration curves, J. Water Res. Pl.-ASCE, 128, 424–430, 2002.
HESSD
7, 7059–7078, 2010Regional flow duration curves for
ungauged sites in Sicily
F. Viola et al.
Title Page
Abstract Introduction
Conclusions References
Tables Figures
◭ ◮
◭ ◮
Back Close
Full Screen / Esc
Printer-friendly Version
Interactive Discussion
Discussion
P
a
per
|
Dis
cussion
P
a
per
|
Discussion
P
a
per
|
Discussio
n
P
a
per
|
Table 1.Catchments characteristics. The catchments used for the validation are marked italic.
HESSD
7, 7059–7078, 2010Regional flow duration curves for
ungauged sites in Sicily
F. Viola et al.
Title Page
Abstract Introduction
Conclusions References
Tables Figures
◭ ◮
◭ ◮
Back Close
Full Screen / Esc
Printer-friendly Version
Interactive Discussion
Discussion
P
a
per
|
Dis
cussion
P
a
per
|
Discussion
P
a
per
|
Discussio
n
P
a
per
|
Table 2. Estimated model parameters and RMSE divided by the mean daily flow. The catch-ments used for the validation are marked italic.
Catchment Dw a b RMSE ( ) 1 Alcantara ad Alcantara 1.00 2.584 0.714 0.083 2 Alcantara a Mojo 0.94 0.663 0.991 0.413 3 Alcantara a San Giacomo 1.00 0.192 0.749 0.224 4 Anapo a San Nicola 1.00 0.367 0.464 0.346 5 Asinaro a Noto 1.00 0.195 0.437 0.168 6 Baiata a Sapone 0.51 0.038 0.616 0.542 7 Belice a Sparacia 0.96 0.227 0.765 0.592 8 Belice a Ponte Belice 0.98 0.938 1.009 0.344 9 Belici a Bruciato 0.84 0.085 0.872 0.651 10 Belici a Marianopoli Scalo 0.66 0.140 0.842 0.740 11 Birgi a Chinisia 0.67 0.164 0.951 0.643 12 Cassibile a Manghisi 1.00 0.390 0.291 0.130 13 Castelbuono a Ponte Vecchio 0.95 0.110 1.115 0.344 14 Castello a Castello 0.62 0.025 0.520 0.496 15 Chitarra a Rinazzo 0.34 0.055 0.778 0.517 16 Eleuterio a Lupo 0.58 0.055 0.718 0.378 17 Eleuterio a Risalaimi 1.00 0.150 0.622 0.331
18 Elicona a Falcone – – – –
19 Fastaia a Lachinea 0.46 0.045 0.939 0.254 20 Ficuzza a San Pietro 0.74 0.104 0.601 0.141 21 Flascio a Zarbata 1.00 0.188 0.913 0.454 22 Fiume freddo ad Alcamo scalo 0.73 0.221 0.893 0.487 23 Ganci a Regiovanni 0.92 0.079 0.788 0.383 24 Imera Merid. Cinque archi 0.98 0.454 1.064 0.196
25 Imera Merid. a Capodarso – – – –
26 Imera Merid. a Drasi 0.99 1.488 0.844 0.213 27 Imera Merid. a Petralia 1.00 0.245 0.640 0.223 28 Imera Merid. a ponte Besaro 0.99 0.918 0.961 0.247 29 Imera Sett. a Scillato 1.00 0.256 0.774 0.063 30 Isnello a Ponte Grande 0.90 0.093 0.818 0.268 31 Jato a Fellamonica 0.86 0.185 0.800 0.168 32 Martello a Petrosino 0.90 0.264 0.977 0.721
33 Milicia a Milicia – – – –
34 Nocella a Zucco 0.97 0.117 0.773 0.090 35 (b) Oreto a Parco 1.00 0.423 0.684 0.108 36 Platani a Passofonduto 1.00 0.902 0.860 0.162 37 San Biagio a Mandorleto 0.80 0.063 0.693 0.486 38 Salso a Monzanaro 0.64 0.239 0.918 0.321 39 Salso a Raffo 0.84 0.085 0.836 0.243 40 Saraceno a Chiusitta 1.00 0.160 0.871 0.388 41 Sciaguana a Torricchia 0.68 0.035 0.536 0.177 42 (a) Senore a Finocchiara 0.66 0.119 0.894 0.241 43 San Leonardo a Monumentale 0.83 0.642 1.050 0.213 44 San Leonardo a Vicari 0.83 0.245 1.102 0.227 45 Salso a Ponte Gagliano 0.74 0.749 0.990 0.092 46 Tellaro a Castelluccio 0.77 0.122 0.758 0.123 47 Timeto a Murmari 1.00 0.173 0.837 0.267 48 Torrente Mulini a Guglielmotto 1.00 0.150 0.840 0.339 49 Torto a Bivio Cerda 0.71 0.300 0.941 0.118 50 Torto a Roccapalumba scalo 0.88 0.081 0.861 0.604 51 Trigona a Rappis 0.65 0.255 0.608 0.188 52 Troina a Serravalle 0.84 0.236 1.019 0.192 53 Valle acqua a Serena 0.75 0.051 0.754 0.613
HESSD
7, 7059–7078, 2010Regional flow duration curves for
ungauged sites in Sicily
F. Viola et al.
Title Page
Abstract Introduction
Conclusions References
Tables Figures
◭ ◮
◭ ◮
Back Close
Full Screen / Esc
Printer-friendly Version
Interactive Discussion
Discussion
P
a
per
|
Dis
cussion
P
a
per
|
Discussion
P
a
per
|
Discussio
n
P
a
per
|
Table 3.Regional model parameters for the three Sicilian sub-zones.
Zone 1 Zone 2 Zone 3
j0 −3.98 −2.47 −3.41
j1 0.093851 0.011598 0.04256
Dw j2 0.669824 0.49543 0.6338
R2 0.7 0.82 0.5
RMSE 0.1031 0.04 0.114
m0 −7.6678 −18.17 0.125 m1 0.000835 0.0038 0.00079
m2 0.471309 2.2047 0.3857
a
m3 1.07098 0.7207 −0.5773
R2 0.9 0.85 0.95
RMSE 0.07 0.34 0.09
n0 7.539 15.13 −0.39
n1 −0.00254 0.00136 −0.00508
n2 0.06468 −0.05059 0.053893
b n3 −0.08887 −1.11219 0.365885
n4 −1.45199 −1.5297 −0.2853
R2 0.42 0.73 0.77
HESSD
7, 7059–7078, 2010Regional flow duration curves for
ungauged sites in Sicily
F. Viola et al.
Title Page
Abstract Introduction
Conclusions References
Tables Figures
◭ ◮
◭ ◮
Back Close
Full Screen / Esc
Printer-friendly Version
Interactive Discussion
Discussion
P
a
per
|
Dis
cussion
P
a
per
|
Discussion
P
a
per
|
Discussio
n
P
a
per
|
Fig. 1.Catchments location.
HESSD
7, 7059–7078, 2010Regional flow duration curves for
ungauged sites in Sicily
F. Viola et al.
Title Page
Abstract Introduction
Conclusions References
Tables Figures
◭ ◮
◭ ◮
Back Close
Full Screen / Esc
Printer-friendly Version
Interactive Discussion
Discussion
P
a
per
|
Dis
cussion
P
a
per
|
Discussion
P
a
per
|
Discussio
n
P
a
per
|
(a) (b)
Fig. 3.Empirical (line) and estimated with Eq. (3) (dashed) flow duration curves for the “Senore a Finocchiara” basin(a)and for the “Oreto a Parco” basin(b).
HESSD
7, 7059–7078, 2010Regional flow duration curves for
ungauged sites in Sicily
F. Viola et al.
Title Page
Abstract Introduction
Conclusions References
Tables Figures
◭ ◮
◭ ◮
Back Close
Full Screen / Esc
Printer-friendly Version
Interactive Discussion
Discussion
P
a
per
|
Dis
cussion
P
a
per
|
Discussion
P
a
per
|
Discussio
n
P
a
per
|
Fig. 4. Sub-zones for parameters regionalization and FDC obtained in validation for a basin inside each zone. Zone 1: Milicia a Milicia (Dw=0.76;a=0.157;b=0.796). Zone 2: Elicona a Falcone (Dw=0.94;a=0.088;b=0.970). Zone 3: Imera a Capodarso (Dw=0.96;a=0.595;