Genome-wide association study of drought-related resistance traits in
Aegilops tauschii
Peng Qin
1,2*, Yu Lin
1,*, Yaodong Hu
3,4, Kun Liu
1, Shuangshuang Mao
1, Zhanyi Li
1, Jirui Wang
1, Yaxi Liu
1,
Yuming Wei
1and Youliang Zheng
11
Triticeae Research Institute, Sichuan Agricultural University, Wenjiang, Chengdu, China.
2
College of Agronomy and Biotechnology, Yunnan Agricultural University, Kunming, China.
3
Institute of Animal Genetics and Breeding, College of Animal Science and Technology,
Sichuan Agricultural University, Chengdu, China.
4Farm Animal Genetic Resources Exploration and Innovation Key Laboratory of Sichuan Province,
Sichuan Agricultural University, Chengdu, China.
Abstract
The D-genome progenitor of wheat (Triticum aestivum), Aegilops tauschii, possesses numerous genes for resis-tance to abiotic stresses, including drought. Therefore, information on the genetic architecture ofA. tauschii can aid the development of drought-resistant wheat varieties. Here, we evaluated 13 traits in 373A. tauschii accessions grown under normal and polyethylene glycol-simulated drought stress conditions and performed a genome-wide as-sociation study using 7,185 single nucleotide polymorphism (SNP) markers. We identified 208 and 28 SNPs associ-ated with all traits using the general linear model and mixed linear model, respectively, while both models detected 25 significant SNPs with genome-wide distribution. Public database searches revealed several candidate/flanking genes related to drought resistance that were grouped into three categories according to the type of encoded protein (enzyme, storage protein, and drought-induced protein). This study provided essential information for SNPs and genes related to drought resistance inA. tauschii and wheat, and represents a foundation for breeding drought-resistant wheat cultivars using marker-assisted selection.
Keywords:Aegilops tauschii, drought resistance, genome-wide association study, single nucleotide polymorphism, wheat.
Received: September 29, 2015; Accepted: December 15, 2015.
Introduction
The current global climate change is projected to have a significant impact on temperature and precipitation pro-files, with consequent increases in drought incidence and severity. It is known that severe drought occurs in nearly half of the world’s countries (Wilhite and Glantz, 1985). Since drought is probably the major abiotic factor limiting yields, the development of crops that are high yielding un-der environmentally stressful conditions is essential (Ergen and Budak, 2009; Fleuryet al., 2010).
Wheat (Triticum spp.) is the leading human food source, accounting for more than half of the world’s total food consumption (Ergen and Budak, 2009; Habashet al., 2009); therefore, it is a major target for the development of cultivars that are high-yielding under water-limited condi-tions. For drought-related research and the improvement of
modern crop varieties, plants exhibiting high drought resis-tance are the most suitable targets and the most promising sources of drought-related genes and gene regions. Many wild species also retain superior genetic resources that have not yet been investigated. One such species is Aegilops tauschii, the diploid D-genome progenitor of hexaploid wheat (T. aestivum).A. tauschiiis more drought resistant thanT. aestivumand wild emmer wheat (T. dicoccoides) and harbors drought-resistance traits that were lost during the breeding processes (Ashrafet al., 2009). Breeders have increasingly focused onA. tauschii, since an understanding of the genetic basis of drought resistance inA. tauschiican contribute to the development of drought-resistant wheat cultivars.
Drought resistance is a quantitative trait with a com-plex phenotype affected by plant development stages (Budak et al., 2013). Linkage analysis is the most com-monly used strategy for detecting quantitative trait loci (QTLs) in plants; however, linkage mapping using bi-parental crosses has some serious limitations. This method can only reveal information regarding two alleles at a given DOI: http://dx.doi.org/10.1590/1678-4685-GMB-2015-0232
Send correspondence to Yaxi Liu. Triticeae Research Institute, Sichuan Agricultural University, Wenjiang Chengdu 611130, China. E-mail: yaxi.liu@outlook.com; yaxi.liu@hotmail.com
*These authors contributed equally to this work.
locus, or a few loci segregating in a studied population. In addition, the genetic resolution of detected QTLs is poor (Holland, 2007; Navakodeet al., 2014). Furthermore, link-age analysis can only sample a small fraction of all possible alleles in the parental source population, while the develop-ment of mapping populations is costly and time-consuming.
Association mapping (AM), also known as linkage disequilibrium mapping, relies on existing natural popula-tions or specially designed populapopula-tions to overcome the constraints of linkage mapping (Pasamet al., 2012). This technique is a powerful tool to resolve complex trait varia-tion and identify different loci and/or novel and superior al-leles in natural populations (Zhuet al., 2008). In recent years, association studies have been extensively used to discover and validate QTLs or genes for important traits and to map candidate genes in many crop plants, including wheat. The benefit of this method over traditional bi-parental mapping approaches depends on the extent of link-age (Huanget al., 2010; Kump et al., 2011; Erenaet al., 2013). In wheat, different association panels have been used in many AM studies to identify loci controlling agro-nomic (Breseghello and Sorrells, 2006; Crossaet al., 2007; Neumann et al., 2007; Bordes et al., 2013) and quality (Ravelet al., 2009; Bordeset al., 2011) traits.
Only a few genome-wide association studies have been carried out inA. tauschiifor drought resistance traits. Here, we aimed to: 1) investigate marker-trait associations for drought resistance based on a genome-wide AM ap-proach using single nucleotide polymorphism (SNP) mark-ers in a core collection of 373 A. tauschii accessions of diverse origin; 2) identify SNPs highly associated with drought resistance traits; and 3) search for candidate genes controlling these traits. This study could provide important information for cloning genes related to drought-resistance inA. tauschii and develop resistant wheat cultivars using marker-assisted selection.
Material and Methods
Plant materials and phenotypic evaluation
The natural population used for the association analy-sis comprised of 373A. tauschiiaccessions collected by the Triticeae Research Institute of Sichuan Agricultural Uni-versity.A. tauschii plants were grown in a phytotron in Wenjiang, Sichuan Province, China, from September 2012 to March 2013 and evaluated under normal conditions (NC) and polyethylene glycol (PEG)-simulated drought-stress conditions (SC) in a completely randomized design with four replications per treatment. Hydroponic tanks were filled with standard Hoagland’s nutrient solu-tion (1 mM KH2PO4, 2 mM MgSO47H2O, 4 mM CaNO34H2O, 6 mM KNO3, 0.046 mM H3BO3, 0.76mM ZnSO4, 0.32 mM CuSO45H2O, 9.146 mM MnCl2, 0.0161 mM (NH4)6 MoO44H2O, and 100 mM NaFeEDTA;
Hoagland and Arnon, 1950) with or without PEG (19.2%) for SC and NC, respectively. Seedlings were grown at a temperature of 25/22±1 °C day/night, relative humidity of 65/85% day/night, and a 16-h photoperiod with 500 mmolm-2s-1 photon flux density at the level of plant canopy.
Uniform seedlings were transferred to the phytotron 8 d after germination and evaluated 22 d later with a WinRHizo Pro 2008a image analysis system (Régent In-struments, Quebec, Canada) for the following traits: root length (RL), root diameter (RD), the number of root tips (RT), and the number of roots with a diameter of 0.000-0.500 mm (TNOR). The plants were then separated into shoots and roots for measuring total fresh weight (TFW), root fresh weight (RFW), shoot fresh weight (SFW), and shoot height (SH). To determine total dry weight (TDW), root dry weight (RDW), and shoot dry weight (SDW), shoots and roots were stored in paper bags, heated at 105 °C for 30 min to kill the cells, and dried at 75 °C until a constant mass was obtained.
Descriptive statistics, correlation analysis, analysis of variance, principal component analysis and multiple linear stepwise regressions were conducted for all traits using IBM SPSS Statistics for Windows 20.0 (IBM Corp., Chi-cago, IL, USA). Heritability was calculated as follows (Smithet al., 1998):
H = VG / (VG + VE),
where VG and VE represent estimates of genetic and envi-ronmental variances, respectively.
In order to eliminate individual variation resulting from inherent genetic differences unrelated to drought re-sistance, the drought resistance index (DI) was used as a standardizing measure acrossA. tauschii accessions and calculated as follows (Bouslama and Schapaugh, 1950):
DI = TSC/TNC,
where TSCand TNCare the traits measured for each plant un-der SC and NC, respectively.
We also calculated the weighted comprehensive eval-uation value (D value) for each genotype as follows (Xie, 1993; Zhouet al., 2003):
[
]
D u(X ) Wj j
j 1 n
= ´
=
å
where Wjis the weighting variable calculated as:
W P
P j
j
j j a
n =
=
å
u(X ) X X
X X
j
j min
max min
=
-10K Infinium iSelect SNP array and SNP genotyping
The construction of theA. tauschii10K SNP array was described previously by Luoet al.(2014). A total of 7,185 SNP markers was mapped to anA. tauschiigenetic map and a physical map built by bacterial artificial chromo-some clones (Luoet al., 2014). SNPs were assayed accord-ing to the manufacturer’s protocol (Illumina, San Diego, CA, USA) at the Genome Center, University of California, Davis, CA, USA. Normalized Cy3 and Cy5 fluorescence for each DNA sample was graphed using Genome Studio (Illumina, San Diego, CA, USA), resulting in genotype clustering for each SNP marker. SNP genotyping was car-ried out as described previously by Wanget al.(2013).
Population structure
Population structure was estimated with a set of 7,185 SNP markers mapped to theA. tauschiigenetic map using STRUCTURE 2.3.3, which implements a model-based Bayesian cluster analysis (Pritchardet al., 2000; Wanget al., 2013). The linkage ancestry model and the allele fre-quency-correlated model were used. A total of 100 burn-in iterations followed by 100 Markov chain Monte Carlo iter-ations forK= 1 to 10 clusters were used to identify the opti-mal range ofK. Five runs were performed separately for each value ofK, and the optimalK-value was determined using the deltaKmethod (Evannoet al., 2005). UsingK= 4 (Wanget al., 2013), the population was divided into Subp1, Subp2, Subp3, Subp4, and mixed individuals.
Genome-wide association study
Marker-trait associations were calculated in Tassel 2.1 (Bradburyet al., 2007) using both the general linear model (GLM) and the mixed linear model (MLM). Both models used 6,905 SNP markers with a minor allele fre-quency threshold (> 0.05). To correct the population struc-ture, the GLM incorporated a Q-matrix and the MLM incorporatedQ- andK-matrices. The Bonferroni-corrected threshold ata= 1 (Yanget al., 2014) was used as the cutoff
value, which was 144.823´10-6with a corresponding -log p-value of 3.839. Significant markers were visualized with
a Manhattan plot drawn in R 3.03
(http://www.r-project.org/). Important p-value distribu-tions (observed vs. cumulativep-values on a -log10scale) were displayed in a quantile-quantile plot drawn in R. To find candidate genes, flanking genes, and trait-related pro-teins, we performed a Basic Local Alignment Search Tool (BLAST) search against the International Wheat Genome
Sequencing Consortium database (IWGSC;
http://www.wheatgenome.org/) using SNP sequences. The IWGSC BLAST results were used to perform a BLAST search of the National Center for Biotechnology
Informa-tion (NCBI) database (http://www.ncbi.nlm.nih.gov/) and then a direct BLASTx search of the NCBI database.
Results
Phenotypic evaluation
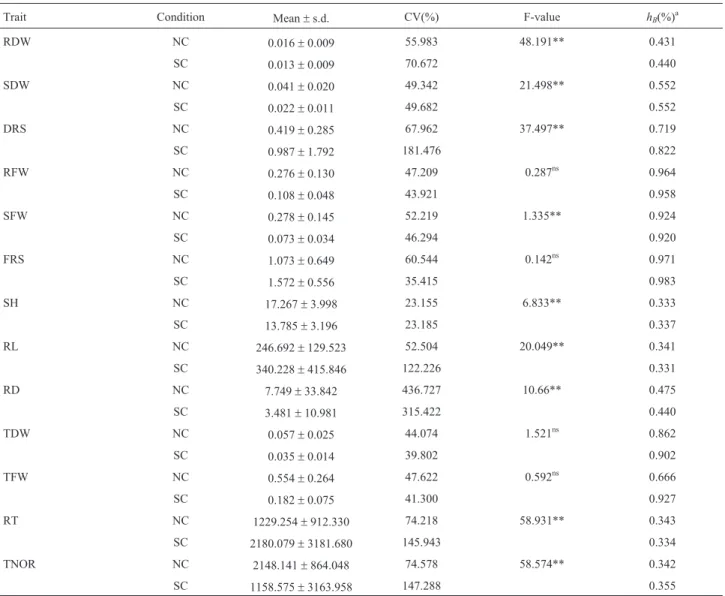
Significant phenotypic variation was observed for all traits, and the means were significantly different between NC and SC (Table 1). The mean values of the root to shoot ratio of fresh weight (FRS), the root to shoot ratio of dry weight (DRS), RT, and RL were higher under SC, whereas RFW, SFW, RDW, SDW, SH, TFW, TDW, RD, and TNOR were lower under SC compared with those under NC (Table 1). Significant differences between NC and SC were observed for all traits, except for RFW, FRS, TFW, and TDW, indicating that most of the tested traits were sig-nificantly affected by drought. Medium to high heritability estimates were obtained for most of the traits, and heri-tability was higher for five traits under NC and seven traits under SC. Heritability ranged from 0.333 to 0.971 under NC and 0.331 to 0.983 under SC (Table 1). Pearson correla-tions were calculated among all traits, and we found 56 and 50 significant correlation coefficients (P < 0.05) under NC and SC, respectively (Table S1).
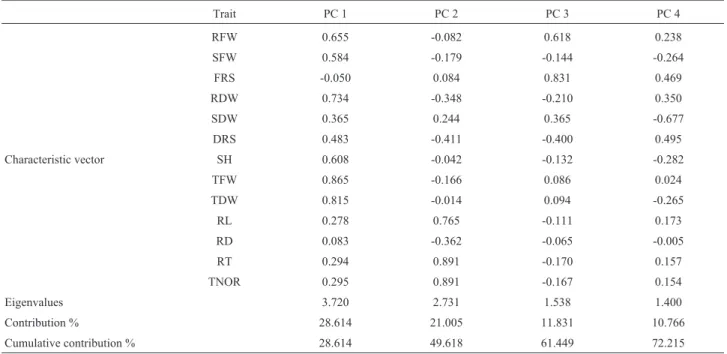
Principal component analysis (PCA) and multiple linear stepwise regressions
PCA were performed for all traits using DI (Table 2) that were highly correlated according to the Bartlett’s test of sphericity (c2
= 5056.738; P < 0.001). To establish selec-tion indices involving multiple drought-resistance traits, a series of linear regressions were performed for all traits. We built the regression to explain TDW and chose our predic-tive variables through stepwise regression (Table 3). The fi-nal stepwise model explained 93.9% and 65.3% of the phenotypic variation in TDW under NC and SC, respec-tively. The model contained nine traits for NC (RFW, RDW, FRS, DRS, TFW, RD, RL, RT, and TNOR) and seven traits for SC (RFW, RDW, FRS, DRS, TFW, RL, and TNOR).
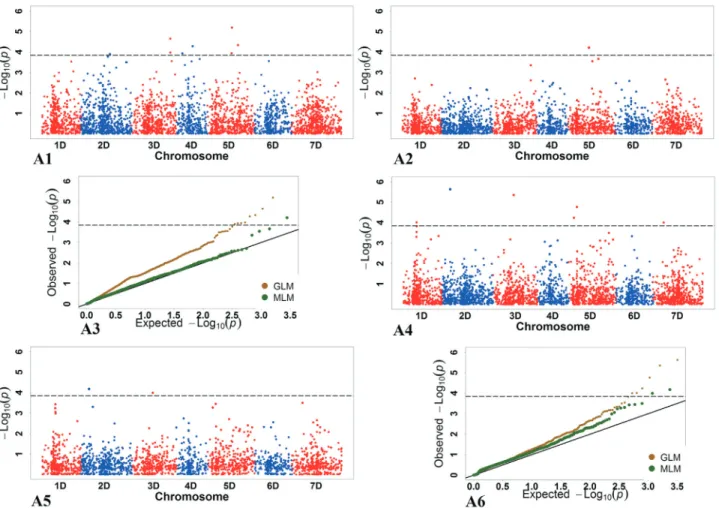
Marker-trait association analysis
The Bonferroni-corrected threshold (-logp > 3.839,
a= 1) was used as the cutoff value for identifying
marker-trait associations (Yanget al., 2014). A total of 208 and 28 SNPs were detected by the GLM and MLM, respectively, while 25 significant SNPs with genome-wide distribution (chromosomes [Chr.] 1D-7D) markers were detected by both models (Table 4; Figure S1 and Table S3).
Under NC, significant markers were detected by both the GLM and MLM for FRS, RT, SDW, SFW, TDW, TFW, and TNOR (Table 4), and by the GLM for RD, RDW, RFW, RL, and SH (partly shown in Figure 1). No significant markers were detected for FRS by any of the two models.
Under SC, significant markers were detected by both the GLM and MLM for RD, TDW, and TFW, and by the GLM for FRS, RDW, RT, SFW, and TNOR (partly shown in Figure 1). No significant markers were detected for RFW, RT, SH, and SDW by any of the two models.
Numerous SNPs were significantly associated with the DI in both the GLM and MLM, and a relatively large amount of phenotypic variation in DI was explained by the studied markers (Table 4).
We performed a BLAST search against the IWGSC using the SNP sequences, and we found that their chromo-somal locations were different from those of the best hits returned from IWGSC. For example, the SNP markers contig10767_892andcontig50332_70located on Chr. 7D and 6D, respectively, on the genetic map of Luo et al.
Table 1- Phenotypic variation in 13 traits in 373Aegilops tauschiiaccessions under the normal condition (NC) and the PEG-induced, simulated drought-stress condition (SC).
Trait Condition Mean±s.d. CV(%) F-value hB(%)a
RDW NC 0.016±0.009 55.983 48.191** 0.431
SC 0.013±0.009 70.672 0.440
SDW NC 0.041±0.020 49.342 21.498** 0.552
SC 0.022±0.011 49.682 0.552
DRS NC 0.419±0.285 67.962 37.497** 0.719
SC 0.987±1.792 181.476 0.822
RFW NC 0.276±0.130 47.209 0.287ns 0.964
SC 0.108±0.048 43.921 0.958
SFW NC 0.278±0.145 52.219 1.335** 0.924
SC 0.073±0.034 46.294 0.920
FRS NC 1.073±0.649 60.544 0.142ns 0.971
SC 1.572±0.556 35.415 0.983
SH NC 17.267±3.998 23.155 6.833** 0.333
SC 13.785±3.196 23.185 0.337
RL NC 246.692±129.523 52.504 20.049** 0.341
SC 340.228±415.846 122.226 0.331
RD NC 7.749±33.842 436.727 10.66** 0.475
SC 3.481±10.981 315.422 0.440
TDW NC 0.057±0.025 44.074 1.521ns 0.862
SC 0.035±0.014 39.802 0.902
TFW NC 0.554±0.264 47.622 0.592ns 0.666
SC 0.182±0.075 41.300 0.927
RT NC 1229.254±912.330 74.218 58.931** 0.343
SC 2180.079±3181.680 145.943 0.334 TNOR NC 2148.141±864.048 74.578 58.574** 0.342 SC 1158.575±3163.958 147.288 0.355 RFW: root fresh weight; SFW: shoot fresh weight; FRS: root to shoot ratio of fresh weight; RDW: root dry weight; SFW: shoot dry weight; FRS: root to shoot ratio of dry weight; SH: shoot height; TFW: total fresh weight; TDW: total dry weight; TRL: total root length; RD: root diameter; RT: number of root tips; TNOR: the number of root in diameter 0.000 to 0.500.
(2014) were located on Chr. 5DL and 6BL, respectively, according to the IWGSC BLAST results.
QTLs and putative candidate genes associated with significant loci
To compare the identified regions between the 373A. tauschiiaccessions, markers separated by less than 5 cM were considered to be part of the same QTL (Massmanet al., 2011). The results revealed three QTLs that were re-lated to RD-SC, RD-DI, and TFW-SC. To find candidate genes, flanking genes, and trait-related proteins, we per-formed a BLAST search of the NCBI database using the IWGSC BLAST results and then a direct BLASTX search of the NCBI database. Putative and flanking genes associ-ated with significant loci are listed in Table S3. We identi-fied several candidate genes that were associated with different traits. Examples includeRht-Athat was associated with TFW-SC, RD-SC, TNOR-NC, SDW-NC, SFW-NC, TDW-NC, and TFW-NC;Rht-Bassociated with TFW-SC; Glo-2associated with TFW-SC and TDW-NC;WM1.7 as-sociated with RD-SC and RD-DI; and Acc-2 associated with RD-SC, RD-DI, TDW-SC, TNOR-NC, and FRS-DI. We also found two candidate vernalization-requirement
genes, VRN2 andVRN-B1, suggesting that vernalization might be related to drought resistance.
We also identified a few putative candidate genes as-sociated with phenotypic traits. These genes could be rou-ghly divided into three groups: the first group included genes encoding enzymes, such as RUBISCO, CKX2.5, Acc-1andAcc-2, suggesting that many biochemical path-ways were activated under SC; the second group included genes encoding storage proteins, such asGlo-2,WM1.12, and WM1.7, which might be activated in response to drought stress; and the final group included genes encoding drought-induced proteins, such as Hotr1, Rht-A, Rht-B, VRN-B1, andVRN2, that might play a crucial role in the drought-resistance reaction ofA. tauschii.
Discussion
Importance of the wheat wild relativeA. tauschii
A. tauschiipossesses numerous traits of high agro-nomic interest, such as yield, insect resistance, disease re-sistance, and drought resistance (Cox, 1994; Ma et al., 1995; Assefa, 2000; Aghaee-Sarbarzehet al., 2002), and its genes can be incorporated into the wheat genome via inter-genic crossing (Valkounet al., 1990; Coxet al., 1992; Liet
Table 2- Principal component analysis (PCA). For trait abbreviations see Table 1.
Trait PC 1 PC 2 PC 3 PC 4
RFW 0.655 -0.082 0.618 0.238
SFW 0.584 -0.179 -0.144 -0.264
FRS -0.050 0.084 0.831 0.469
RDW 0.734 -0.348 -0.210 0.350
SDW 0.365 0.244 0.365 -0.677
DRS 0.483 -0.411 -0.400 0.495
Characteristic vector SH 0.608 -0.042 -0.132 -0.282
TFW 0.865 -0.166 0.086 0.024
TDW 0.815 -0.014 0.094 -0.265
RL 0.278 0.765 -0.111 0.173
RD 0.083 -0.362 -0.065 -0.005
RT 0.294 0.891 -0.170 0.157
TNOR 0.295 0.891 -0.167 0.154
Eigenvalues 3.720 2.731 1.538 1.400
Contribution % 28.614 21.005 11.831 10.766
Cumulative contribution % 28.614 49.618 61.449 72.215
Table 3- Multiple linear stepwise regression to explain total dry weight (TDW) from root traits built withAegilops tauschiigenotypes means. For trait ab-breviations see Table 1.
Treatment Final stepwise model R2 P value
NC TDW = 0.011 0.08RFW + 2.014RDW + 0.02FRS 0.032DRS + 0.089TFW + 0.00005817RD -0.000002274RL -0.000001614RT + 0.000008294TNOR
0.939 < 0.001
SC TDW = 0.011 - 0.033RFW + 0.92RDW - 0.001FRS - 0.003DRS - 0.105TFW + 0.000002321RL + 0.000002292TNOR
al.
403
models. For trait abbreviations see Table 1.
Trait GLM MLM No. Sharec
No.siga Average -log(P) Range -log(P) Average R2(%)b Range R2(%)b No.siga Average -log(P) Range -log(P) Average R2(%)b Range R2(%)b
NC FRS 31 4.476 3.843-5.522 4.958 4.183-6.240 1 3.970 4.732 1
RD 9 4.055 3.884-4.334 4.367 4.160-4.702
RDW 1 4.314 4.891
RFW 28 4.555 3.873-6.217 5.087 4.243-7.128
RL 16 4.734 3.866-7.607 4.912 3.896-8.144
RT 12 4.635 3.858-5.551 4.674 3.866-6.016 1 3.980 4.805
SDW 5 4.703 3.855-6.332 4.983 3.983-6.860 1 4.040 4.803 1
SFW 7 4.564 3.878-6.596 4.883 4.074-7.277 2 4.122 4.109-4.136 4.932 4.912-4.951 2
SH 1 3.932 4.410
TDW 9 4.567 3.901-6.883 4.826 4.044-7.508 1 4.217 5.033 1
TFW 21 4.763 3.875-6.930 5.116 4.062-7.653 2 3.893 3.857-3.930 4.566 4.516-4.616 2
TNOR 11 4.701 3.873-5.462 4.728 3.780-5.896 1 3.945 4.760 1
SC DRS 1 4.238 7.197
FRS 1 4.242 4.588
RD 8 5.628 3.875-7.932 6.569 4.319-9.367 6 5.793 3.844-6.505 8.140 4.995-9.211 5
RDW 6 4.184 3.959-5.076 4.404 4.129-5.395
RT 1 3.967 4.460
SFW 1 3.991 4.339
TDW 8 4.561 4.006-5.631 4.898 4.238-6.162 2 4.087 3.992-4.183 4.857 4.725-4.989 2
TFW 6 4.447 3.868-5.290 4.792 4.112-5.796 3 4.678 4.089-4.973 5.637 4.813-6.049 3
TNOR 1 4.148 4.708
DI DRS 1 4.639 5.288 1 5.286 9.930 1
FRS 7 4.264 3.868-5.330 4.965 4.370-6.229
RD 3 4.432 4.432-4.432 5.154 5.154-5.154 3 4.225 4.225-4.225 5.133 5.133-5.133 3
RL 1 4.425 4.979 1 3.848 4.513 1
RT 3 4.323 3.872-4.906 5.228 4.415-6.447 1 4.401 5.838 1
SDW 5 4.850 4.421-5.085 5.625 5.064-5.907
TDW 2 4.274 4.059-4.490 4.902 4.604-5.199
TNOR 3 4.366 3.982-4.872 5.280 4.554-6.395 1 4.396 5.818 1
Total 208 28 25
aTotal number of significantly associated SNPs detected by GLM and MLM at the threshold of -log10p= 3.839 b
R2value showing the percentage of explained phenotypic variation
c
al., 2006; Zhang and Ma, 2008). Many agronomically use-ful traits have been already incorporated into wheat (Raupp et al., 1993; Cox and Hatchett, 1994; Friebeet al., 1996). In addition, artificial hybridization between tetraploid wheat andA. tauschii has resulted in allohexaploid wheat lines, known as ‘resynthesized’ or ‘synthetic hexaploid’ wheat (SW) (Mujeeb-Kazi et al., 1996), i.e. ‘Chuanmai 42’ (CM42), which is derived from a cross betweenTriticum durumandA. tauschiiand is resistant to Chinese new stripe rust races (Liet al., 2006).
Based on the results of this study, we believe that drought resistance is anotherA. tauschiitrait that could be incorporated into the wheat breeding programs. We identi-fiedA. tauschiiaccessions with high drought resistance that could be used as germplasm resources to widen the genetic diversity of cultivated wheat and, thus, to reduce the time required to breed for drought resistance.
Loci controlling drought resistance traits
Here, we reported the outcome of a genome-wide as-sociation study for the identification of genomic regions in
A. tauschiiresponding to NC and SC. AM involved 7,185 SNP markers genotyped in a core collection of 373 A. tauschiiaccessions. Linkage mapping using different seg-regation populations tested in different environments could be also applied to detect QTLs, but there are only a few re-ports on QTL mapping related to drought-resistance traits inA. tauschii, compared with the high number of such stud-ies in wheat using linkage mapping.
Landjevaet al.(2008) detected QTLs for RL on Chr. 1A, 6D, and 7D under SC, while Zhanget al.(2013) found two QTLs for RL associated with drought resistance on Chr. 6D in two F8:9 recombinant inbred line populations (Weimai 8 x Yannong 19 and Weimai 8 x Luohan 2). In our study, we also identified a significant locus (contig03437_336) on Chr. 6D (28.073 cM) that was asso-ciated with RL-DI, and we also found two loci related to RD-SC and RD-DI on Chr. 7D. However, Liuet al.(2013) found QTLs for RL on Chr. 2D and 5D under two different water conditions. Quarrieet al.(2005) mapped QTLs for drought resistance in hexaploid wheat on Chr. 2D and 3D, and found that three yield QTL clusters were coincident
withVrn-A1on Chr. 5AL andVrn-D1on Chr. 5DL. By comparison, we identified seven significant loci on Chr. 2D and one significant locus on Chr. 2D. Furthermore, we found a candidate VRN2 at the significant loci
GCE8AKX01BMYMJ_66andGDEEGVY01D8PT5_76
lo-cated on Chr. 5D and associated with RD-SC and RD-DI. These results indicated that vernalization-required genes probably affect drought resistance in wheat. These findings further suggested the importance of exploring the relation-ship between drought resistance and vernalization-required genes.
Significant genome-wide loci were detected by both the GLM and MLM. Some traits were associated with mul-tiple chromosomes, including RD-DI associated with SNPs on Chr. 1D and 6D, TFW-NC associated with SNPs on Chr. 1D and 5D, and RD-NC associated with SNPs on Chr. 4D, 5D, and 7D. Massmanet al.(2011) stated that significant SNP markers separated by less than 5 cM could be
consid-ered as a single QTL. Accordingly,
GCE8AKX02IHJOC_389, contig37658_165, and
GA8KES402HD74L_87 (Chr. 1D) separated by less than 1 cM were considered as a single QTL related to TFW-SC.
Similarly, GCE8AKX01BMYMJ_66 and
GDEEGVY01D8PT5_76 (Chr. 5D) also separated by less than 1 cM were considered as a single QTL related to RD-DI and RD-SC (Table S3).
Until the wheat genome map is complete, loci identi-fied in this study as associated with drought resistance traits cannot be directly compared with QTLs reported by previ-ous studies in wheat. In addition, since the genome ofA. tauschiiis not equivalent to the D-genome of wheat, only approximate chromosomal locations that control drought resistance traits can be inferred. For example, contig10767_892 located on Chr. 7D in A. tauschii was found on Chr. 5DL in hexaploid wheat. Similarly, contig50332_70 located on Chr. 6D in A. tauschii was found on Chr. 6BL in wheat. One possible reason for these differences could be the translocation of chromosomal re-gions during the hexaploidization of common wheat, in whichA. tauschiiwas involved.
Analysis of putative candidate and flanking genes
Drought resistance is a complex trait resulting from the interaction of root and shoot traits. In response to drought stress, wheat has developed highly specialized morphological, physiological and biochemical mecha-nisms to increase the efficiency of nutrient and water acqui-sition from soil (Ludlow and Muchow 1990; Richardset al., 2002; Nicotra and Davidson,2010). These mechanisms are closely associated with genes controlling drought resis-tance and apparently responsive traits under drought condi-tions. Previous studies have reported many genes related to drought resistance in wheat, such asDREBthat plays a cen-tral role in plant stress response (Agarwal et al., 2006; Mizoi et al., 2012) and TaAIDFa that encodes a
C-peat/dehydration-responsive element-binding factor re-sponsive to drought (Xuet al., 2008). In addition, the si-lencing of TaBTF3 impairs resistance to drought stress, suggesting that it may be involved in abiotic stress response in higher plants (Kanget al., 2013). Jianget al.(2014) iso-lated a strongly drought-induced C3H zinc finger gene, AetTZF1, inA. tauschii. Ugaet al.(2013) characterized the DRO1gene that controls root growth angle in rice, which was the first root QTL that cloned in a crop species. Rice OsTZF1 confers increased stress resistance to drought by regulating stress-related genes (Janet al., 2013).
In this study, we identified several putative candidate genes associated with phenotypic traits related to drought resistance. These genes could be broadly divided into three groups: (1) genes related to various enzymes, suggesting that many biochemical pathways are activated under drought conditions; (2) genes related to storage proteins that may be synthesized in response to drought stress; and (3) genes related to drought-induced proteins that probably play a crucial role in drought resistance. These findings re-flected the complexity of drought-resistance mechanisms and the large number of genes involved in these mecha-nisms. Information on SNPs and genes related to drought-resistance might provide a genetic basis for gene cloning and marker-assisted selection in the wheat breeding pro-grams.
Conclusion
We performed a genome-wide association study for drought resistance traits in a population of 373A. tauschii accessions using 7,185 SNP markers and we detected 25 significant markers using GLM and MLM analysis. Fur-thermore, we identified candidate genes at significant loci and their flanking regions that might control drought resis-tance traits, including genes encoding enzymes, storage proteins, and drought-induced proteins. The results pro-vided essential information on SNPs and genes related to drought resistance in A. tauschii that could be used for breeding drought-resistant wheat cultivars.
References
Agarwal PK, Agarwal P, Reddy MK and Sopory SK (2006) Role of DREB transcription factors in abiotic and biotic stress tol-erance in plants. Plant Cell Rep 25:1263-1274.
Aghaee-Sarbarzeh M, Ferrahi M, Singh S, Singh H, Friebe B, Gill BS and Dhaliwal HS (2002) Transfer of leaf and stripe rust-resistance genes from Aegilops triuncialis and Ae. Geniculatato bread wheat. Euphytica 127:377-382.
Ashraf M, Ozturk M and Athar HR (2009) Salinity and Water Stress: Improving Crop Efficiency. Springer, Berlin, pp. 1-243.
Assefa S (2000) Resistance to wheat leaf rust inAegilops tauschii
Bordes J, Ravel C, Le Gouis J, Charmet G and Balfourier F (2011) Use of global wheat core collection for association analysis of flour and dough quality traits. J Cereal Sci 54:137-147. Bordes J, Ravel C, Jaubertie JP, Duperrier B, Gardet O, Heumez
E, Pissavy AL, Charmet G, Le Gouis J and Balfourier F (2013) Genomic regions associated with the nitrogen limita-tion response revealed in a global wheat core colleclimita-tion. Theor Appl Genet 126:805-822.
Bouslama M and Schapaugh WT (1950) Stress tolerance in soy-beans. I. Evaluation of three screening techniques for heat and drought tolerance. Crop Sci 24:933-937.
Bradbury PJ, Zhang Z, Kroon DE, Casstevens TM, Ramdoss Y and Buckler ES (2007) TASSEL: Software for association mapping of complex traits in diverse samples. Bioinfor-matics 23:2633-2635.
Breseghello F and Sorrells ME (2006) Association mapping of kernel size and milling quality in wheat (Triticum aestivum
L.) cultivars. Genetics 172:1165-1177.
Budak H, Kantar M and Yucebilgili Kurtoglu K (2013) Drought tolerance in modern and wild wheat. Sci World J 2013:548246.
Cox TS (1994) Leaf rust-resistance genes Lr41, Lr42, and Lr43 transferred fromTriticum tauschiito common wheat. Crop Sci 34:39-43.
Cox TS and Hatchett JH (1994) Hessian fly resistance gene H26 transferred fromTriticum tauschiito common wheat. Crop Sci 34:958-960.
Cox TS, Raupp WJ, Wilson DL, Gill BS, Leath S and Bockus WW (1992) Resistance to foliar diseases in a collection of
Triticum tauschiigermplasm. Plant Dis 76:1061-1064. Crossa J, Burgueno J, Dreisickacker S, Vargas M,
Herrera-Foes-sel SA, Lillemo M, Singh RP, Trethowan R, Warburton M, Franco J, et al. (2007) Association analysis of historical bread wheat germplasm using additive genetic covariance of relatives and population structure. Genetics 177:1889-1913. Erena EA, Patrick PF, Byrne SD, Marta MS and Matthew MP
(2013) Genome-wide association mapping of yield and yield components of spring wheat under contrasting moisture re-gimes. Theor Appl Genet 4:791-807.
Ergen NZ and Budak H (2009) Sequencing over 13,000 expressed sequence tags from six subtractive cDNA libraries of wild and modern wheats following slow drought stress. Plant Cell Environ 32:220-236.
Evanno G, Regnaut S and Goudet J (2005) Detecting the number of clusters of individuals using the software STRUCTURE: A simulation study. Mol Ecol 14:2611-2620.
Fleury D, Jefferies S, Kuchel H and Langridge P (2010) Genetic and genomic tools to improve drought tolerance in wheat. J Exp Bot 61:3211-3222.
Friebe B, Jiang J, Raupp WJ, McIntSCh RA and Gill BS (1996) Characterization of wheat alien translocations conferring re-sistance to diseases and pests: Current status. Euphytica 71:59-83.
Habash DZ, Kehel Z and Nachit M (2009) Genomic approaches for designing durum wheat ready for climate change with a focus on drought. J Exp Bot 60:2805-2815.
Hoagland DR and Arnon IR (1950) The water-culture method for growing plants without soils. Circ Calif Agric Exp Stn 347:4-32.
Holland JB (2007) Genetic architecture of complex traits in plants. Curr Opin Plant Biol 10:156-161.
Huang X, Wei X, Sang T, Zhao Q, Feng Q, Zhao Y, Li CY, Zhu CR, Lu TT, Zhang ZW,et al.(2010) Genome-wide associa-tion studies of 14 agronomic traits in rice landraces. Nature Genet 42:961-967.
Jan A, Maruyama K, Todaka D, Kidokoro S, Abo M, Yoshimura E, Shinozaki K, Nakashima K and Yamaguchi-Shinozaki K (2013) OsTZF1, a CCCH-tandem zinc finger protein, con-fers delayed senescence and stress tolerance in rice by regu-lating stress-related genes. Plant Physiol 161:1202-1216. Jiang AL, Xu ZS, Zhao GY, Cui XY, Chen M, Li LC and Ma YZ
(2014) Genome-Wide Analysis of the C3H Zinc Finger Transcription Factor Family and Drought Responses of Members inAegilops tauschii. Plant Mol Biol 6:1241-1256. Kang GZ, Ma HZ, Liu GQ, Han QX, Li CW and Guo TC (2013)
Silencing of TaBTF3 gene impairs tolerance to freezing and drought stresses in wheat. Mol Genet Genomics 11:591-599. Kump K, Bradbury PJ, Wisser RJ, Buckler ES, Belcher AR, Oropeza-Rosas MA, Zwonitzer JC, Kresovich S, McMullen MD, Ware D,et al.(2011) Genome-wide association study of quantitative resistance to southern leaf blight in the maize nested association mapping population. Nat Genet 43:163-168.
Landjeva S, Neumann K and Lohwasser U (2008) Molecular mapping of genomic regions associated with wheat seedling growth under osmotic stress. Biol Plant 2:259-266. Li GQ, Li ZF, Yang WY, Zhang Y, He ZH, Xu SC, Singh RP, Qu
YY and Xia XC (2006) Molecular mapping of stripe rust re-sistance gene YrCH42 in Chinese wheat cultivar Chuanmai 42 and its allelism with Yr 24 and Yr26. Theor Appl Genet 112:1434-1440.
Liu XL, Li RZ, Chang XP and Jing RL (2013) Mapping QTLs for seedling root traits in a doubled haploid wheat population under different water regimes. Euphytica 189:51-66. Ludlow MM and Muchow RC (1990) A critical evaluation of
traits for improving crop yields in water-limited environ-ments. Advan Agron 43:107-153.
Luo MC, Gu YQ, You FM, Deal KR, Ma Y, Hu Y, Huo N, Wang Y, Wang J, Chen S,et al.(2014) A 4-gigabase physical map unlocks the structure and evolution of the complex genome ofAegilops tauschii, the wheat D-genome progenitor. Proc Natl Acad Sci U S A 110:7940-7945.
Ma H, Singll RP and Muieeb-kazi A (1995) Resistance to stripe rust in Triticum turgidum, T. tauschiiand their synthetic hexaploids. Euphytica 82:117-120.
Massman J, Cooper B, Horsley R, Neate S, Dill-Macky R, Chao S, Dong Y, Schwarz P, Muehlbauer GJ and Smith KP (2011) Genome-wide association mapping of Fusarium head blight resistance in contemporary barley breeding germplasm. Mol Breeding 27:439-454.
Mizoi J, Shinozaki K and Yamaguchi-Shinozaki K (2012) Review AP2/ERF family transcription factors in plant abiotic stress responses. Biochim Biophys Acta 1819:86-96.
Mujeeb-Kazi A, Rosas V and Roldan S (1996) Conservation of the genetic variation ofTriticum tauschiiin synthetic hexa-ploid wheats and its potential utilization for wheat improve-ment. Genet Resour Crop Evol 43:129-134.
Neumann K, Kobiljski B, Dencie S, Varshney RK and Borner A (2007) Genome-wide association mapping: A case study in bread wheat (Triticum aestivumL.). Mol Breed 27:37-58. Nicotra AB and Davidson A (2010) Adaptive phenotypic and
plant water use. Funct Plant Biol 37:117-127.
Pasam RK, Sharma R, Malosetti M, van Eeuwijk FA, Haseneyer G, Kilian B and Graner A (2012) Genome-wide association studies for agronomical traits in a worldwide spring barley collection. BMC Plant Biol 12:16-37.
Pritchard JK, Stephens M and Donnelly P (2000) Inference of population structure using multilocus genotype data. Genet-ics 55:945-95.
Quarrie SA, Steed A, Calestani C, Semikhodskii A, Lebreton C, Chinoy C, Steele ND, Pljevljakusi CD, Waterman E, Weyen J,et al. (2005) A high-density genetic map of hexaploid wheat (Triticum aestivumL.) from the cross Chinese Spring x SQ1 and its use to compare QTLs for grain yield across a range of environments. Theor Appl Genet 110:865-880. Raupp WJ, Amri A, Hatchett JH, Gill BS, Wilson DL and Cox TS
(1993) Chromosomal location of Hessian fly-resistance genes H22, H23 and H24 derived fromTriticum tauschiiin the D genome of wheat. J Hered 84:142-145.
Ravel C, Martre P, Romeuf I, Dardevet M, El-Malki R, Bordes J, Duchateau N, Brunel D, Balfourier F and Charmet G (2009) Nucleotide polymorphism in the wheat transcriptional acti-vator Spa influences its pattern of expression and has pleio-tropic effects on grain protein composition, dough visco-elasticity and grain hardness. Plant Physiol 151:33-44. Richards RA, Rebetzke GJ, Condon AG and van Herwaarden AF
(2002) Breeding opportunities for increasing the efficiency of water use and crop yield in temperate cereals. Crop Sci 42:111-121.
Smith SE, Kuehl RO, Ray IM, Hui R and Soleri D (1998) Evalua-tion of simple methods for estimating broad-sense herita-bility in stands of randomly planted genotypes. Crop Sci 38:1125-1129.
Uga Y, Sugimoto K, Ogawa S, Rane J, Ishitani M, Hara N, Kitomi Y, Inukai Y, Ono K, Kanno N,et al.(2013) Control of root system architecture by DEEPER ROOTING 1 increases rice yield under drought conditions. Nat Genet 45:1097-1102. Valkoun J, Dostal J and Kucerova D (1990)Triticum x Aegilops
hybrids through embryo culture. In Wheat. Springer, Berlin, pp. 152-166
Wang JR, Luo MC, Chen ZX, You FM, Wei YM, Zheng YL and Dvorak J (2013)Aegilops tauschiisingle nucleotide poly-morphisms shed light on the origins of wheat D-genome ge-netic diversity and pinpoint the geographic origin of hexa-ploid wheat. New Phytol 198:925-937.
Wilhite DA and Glantz MH (1985) Understanding the drought phenomenon: The role of definitions. Water Int 10:111-120. Xie JJ (1993) Agricultural Science and the Method of Fuzzy
Mathematics. Huazhong University of Science Press, Wuhan, pp. 99-193.
Xu ZS, Ni ZY, Liu L, Nie LN, Li LC, Chen M and Ma YZ (2008) Characterization of the TaAIDF a gene encoding a CRT/DRE-binding factor responsive to drought, high-salt, and cold stress in wheat. Mol Genet Genomics 6:497-508. Yang N, Lu YL, Yang XH, Huang J, Zhou Y, Ali FH, Wen WW,
Liu J, Li JS and Yan JB (2014) Genome wide association studies using a new nonparametric model reveal the genetic architecture of 17 agronomic traits in an enlarged maize as-sociation panel. PLoS Genet 10:e1004573.
Zhang H, Cui F, Wang L, Li J, Ding AM, Zhao CH, Bao YG, Yang QP and Wang H (2013) Conditional and unconditional QTL mapping of drought-tolerance-related traits of wheat seedling using two related RIL populations. J Genet 2:213-231.
Zhang HQ and Ma SQ (2008) Transfer of resistant genes from
Aegilops tauschii L. toTriticum aestivum L.and their map-ping by SSR. Zhongguo Nong Ye Da Xue Xue Bao 13:5-11. Zhou GS, Mei FZ, Zhou QZ and Zhu XT (2003) Different wheat
varieties during physiological index comprehensive evalua-tion and predicevalua-tion. Zhongguo Nong Ye Ke Xue 36:1378-1382.
Zhu C, Gore M, Buckler ES and Yu J (2008) Status and prospects of association mapping in plants. Int J Plant Genomics 1:5-20.
Supplementary Material
The following online material is available for this ar-ticle:
- Table S1 - Genetic correlation among selected traits - Table S2 - Top 10 and bottommost 10 genotypes on DI and D value
- Table S3 - Significant SNPs and candidate genes - Figure S1 - The p values of the SNPs and quantile-quantile (Q-Q) plots
This material is available as part of the online article from http://www.scielo.br/gmb
Associate Editor: Everaldo Gonçalves de Barros