13
A PANEL REGRESSION ANALYSIS OF
HUMAN CAPITAL RELEVANCE IN SELECTED
SCANDINAVIAN AND SE EUROPEAN
COUNTRIES
Filip Kokotovic
1Abstract
The study of human capital relevance to economic growth is becoming increasingly important taking into account its relevance in many of the Sustainable Development Goals proposed by the UN. This paper conducted a panel regression analysis of selected SE European countries and Scandinavian countries using the Granger causality test and pooled panel regression. In order to test the relevance of human capital on economic growth, several human capital proxy variables were identified. Aside from the human capital proxy variables, other explanatory variables were selected using stepwise regression while the dependant variable was GDP. This paper concludes that there are significant structural differences in the economies of the two observed panels. Of the human capital proxy variables observed, for the panel of SE European countries only life expectancy was statistically significant and it had a negative impact on economic growth, while in the panel of Scandinavian countries total public expenditure on education had a statistically significant positive effect on economic growth. Based upon these results and existing studies, this paper concludes that human capital has a far more significant impact on economic growth in more developed economies.
Keywords: area studies, human capital proxies, economic growth, education expenditure, Sustainable Development Goals.
Jel Classification: C23; C32; I25
INTRODUCTION
Since Adam Smith’s time in the 18th century, the influence of human capital on economic
growth was considered. There is an increased number of studies that are measuring not only the impact of human capital on economic growth, but several authors have begun to question its relevance as one of the main generators of attracting physical capital and achieving long-term growth (Mujahid, Amin, and Khattak 2014). With the introduction
1Filip Kokotovic, MA, Teaching and research assistant, University college of international relations and
diplomacy Dag Hammarskjöld, Zagreb, Croatia.
Preliminary communication
of the Millennium Development Goals (MDG), the focus of one of the world’s largest
international organization was placed on existential issues related to the survival of the environment and addressing the basic needs of every human being (United Nations General Assembly 2000). The Sustainable Development Goals (SDG) take us a significant step further by not only ensuring what humanity needs to survive, but securing goals that are necessary in order for humanity to prosper. By analysing the SDGs it is clearly possible to state that one of their key guidelines is improving and increasing human capital (United Nations 2015). Many of the goals, such as achieving full employment, are standard topics of academic debates, yet whether such a concept can be achieved has often been contested (Seccareccia 2015). Several authors have addressed the mind-set change concerning the SDGs as primarily human centred and answering key issues humanity is facing today (Kumar, Kuman, and Vivekadhish 2016). There are several methodological approaches to measuring human capital2 and while there are
several models that have wide approval, there is still room for improvement.
While a vast number of studies consider the relation between human capital and economic growth and since the 1990s several studies have addressed that there is a significant difference between the relevance of human capital to economic growth in developed and developing countries. This paper shall implement a panel approach to compare two vastly significant areas within Europe. It shall attempt to address whether there is any statistically significant difference between human capital relevance to economic growth in the chosen SE European countries and the Scandinavian countries. Based upon previously conducted studies and basic macro-economic traits, the initial hypothesis of this paper is that the impact of human capital on economic growth is far more significant in the Scandinavian countries than in the countries of SE Europe (Neagu 2012; Giménez, López-Pueyo and Sanaú 2015, and Akpolat 2014).
1. LITERATURE REVIEW
Lucas (1988) modified the original Sollow-Swan model, which can be summarized as:
Y = AKα (lhL)1-α
(1)
Y GDP growth
A Total factor productivity K Capital
h Stock of human capital L Labour force
α Output elasticity of capital
Inclusion of human capital by augmenting the Sollow model implies further consideration of the relevance of human capital to economic growth. Mankiw (1995, 294) suggest several variables that might be used to proxy human capital in relation to economic growth, where he primarily suggests viewing minimal wage as a return with minimal human capital and return to schooling. This is also one of the two approaches that is generally used to measure human capital. A significant number of studies use proxy variables for human capital, while others use models to calculate the human capital. Judson (2002) conducted a study where she attempted to measure human capital
15
as physical capital and concluded that human capital’s growth discomposition is
significantly lower to that of physical capital.
Giménez, López-Pueyo and Sanaú (2015, 97) conducted a Granger causality test,
measuring the relationship between GDP growth and several human capital proxies in a panel of selected OECD countries, and concluded that while there is a statistically significant link between GDP growth and their proposed human capital indicator there is no relationship between the observed education related human capital variables3 and
GDP growth. Neagu (2012) calculated the market value of human capital, also in selected OECD countries, and his conclusion was that the market value of human capital is higher in more developed OECD countries such as Australia, Austria and the USA. Akpolat (2014) conducted a panel cointegrated regression analysis by using proxy variables4 in
selected developed and developing countries where he concluded that the developed countries had more efficient physical capital and educational expenditure investments. Edrees (2016) conducted an advanced Granger causality test for selected countries of the Arab world and found few structural differences in regards to human capital relevance to economic growth in more developed and less developed countries of the Arab world.
Škare (2001) questioned the relevance of human capital to Croatian GDP growth and
implemented the following model for human capital calculation:
H = f (K, R, N) (2)
H Human capital
K Private expenditure on education R Total public expenditure N Forgone earnings
Based upon his calculations, Skare (2001, 199) concludes that the Croatian economic growth is directly caused by an increase in human capital. Tica and Djukec (2008) conducted a study in which they concluded that physical capital is by far the most important factor in determining the economic growth of Croatia, while other factors such as human capital are far less significant, yet they still are significant at a statistical level. Based upon the conducted literature review, it can be seen that most authors focus on either their respected countries or on versions of panels of OECD countries for which there is the most data available. It can further be concluded that using human capital proxy variables is not only widely accepted, but practised by a significant percentage of the field.
2. METHODOLOGY AND DATA
Data was extracted from Eurostat for the period 1995–2015 for the considered SE European and Scandinavian countries. Within the panel of SE European countries Slovenia, Croatia and Macedonia are considered. The panel of Scandinavian countries consists of Norway, Sweden, Denmark and Finland. Based upon the previously conducted literature review, the author suggests using three significant human capital proxy variables as the independent variables — life expectancy at birth, total public
3 The variables observed by the authors were gross enrolment rate in secondary schooling and average
schooling years in the total population.
expenditure on education and tertiary school enrolment. The dependent variable is the natural logarithm of GDP, measured in constant 2010 millions of euros.
2.1. Unit root test and Granger causality
The first step is to conduct a Granger causality test between GDP and the chosen human capital proxy variables. Before proceeding with the causality test, unit root test will be performed to ensure that the variables are stationary. Several unit root tests will be conducted, namely the tests proposed by Levin, Lin and Chu (2002), Im, Pesaran and Schin (2003) and augmented versions of the test proposed by Philips and Pheron (1988) and Dickey and Fuller (1979). All of these tests are conducted against the null hypothesis of non-stationarity, meaning that the rejection of the null hypothesis leads to the conclusion that we can reject the non-stationarity hypothesis. If the variables were not stationary in their natural logarithms, the first difference of the variables was calculated. Regarding the Granger causality test initially introduced by Granger (1969), it is computed by running bivariate regression with the appropriate number of lags of the tested variable. The number of lags is automatically calculated in E-Views based upon the Schwartz criterion. The general models are as follows:
GDPi,t= α0,i+α1GDPi,t-1+…+αl,iGDPl, t-1+β1,lHCl, t-1+…+β1,lHCl,t-1+…+ϵi,t (3)
HCi,t= α0,i+α1HCi,t-1+…+αl,iHCl, t-1+β1,lGDPl, t-1+…+β1,lGDPl,t-1+…+ϵi,t (4)
GDP Gross domestic product HC Human capital proxy variable α0,I Constant
α1,tI , β1,t Coefficients εi,t Error term
Based upon these models it will be possible to calculate whether there is any statistically significant Granger causal relation between GDP and the chosen human proxy variables.
2.2. Panel regression
Due to the limitations of the Granger causality test, the second step was considering a panel regression model. As the explanatory value of the model might be very low which might compromise the interpretation of the results, several other explanatory variables were considered. The selection of other independent variables was made using stepwise regression in order to achieve that the model have the highest possible explanatory value. The selected panels also provide us with an interesting opportunity to test whether there is any statistically significant difference between the EU and non-EU member states within the respective panels by adding a dummy variable EU.5 Correlation matrixes
between the independent variables are considered in order to avoid multicollinearity. A summary table of all of the variables theoretically considered in the regression is provided in Table 1.
5 Within the panel of SE European countries, Croatia and Slovenia are EU member-states and in the panel
17 Table 1. Variables considered by the regression model: 1995–2015
Name of the variable Abbreviated Relevance to the model Measurement
Gross domestic product* GDP Dependant variable In inflation corrected 2010 million euros Life expectancy at birth Life
In
d
e
p
e
n
d
e
n
t va
ria
b
le
In years Total public expenditure on
education*
Publicexp In inflation corrected 2010 million euros
Tertiary school enrolment Educ Percentage of total
population Total government expenditure* Gov In inflation corrected 2010
million euros Export of goods and services* Exp In inflation corrected 2010
million euros Gross fixed capital formation* GFCF In inflation corrected 2010
million euros
Number of employed* Labour In thousand persons
Taxes less subsidies on products* Tax In inflation corrected 2010 million euros
EU / Dummy variable 1 if country is an EU
member-state, 0 if it is not
Note: * these variables are in the form of their natural logarithms
Based upon the results of the stepwise regression, two additional explanatory variables will be selected alongside the chosen human capital proxy variables. Therefore the final general model of the panel regression will be:
GDPi,t=α0,i+α1lifei,t+α2educi,t+α3publicexpi,t+α4xi,t+α5zi,t+ϵi,t (5)
GDP Gross domestic product educ Tertiary school enrolment
publicexp Total public expenditure on education
α0,i Constant
α1…5 Coefficients
x, z Variables determined by stepwise regression εi,t Error term
2.3. Methodological and data constrains
Several authors have argued against using human capital proxies due to the fact that the results often appear statistically insignificant (Giménez, López-Pueyo, and Sanaú 2015). Using human capital proxies is an imperfect approach, yet as there is no final consensus on a valid approach to human capital measurement, it may be considered suitable. A more significant issue is that the data for the SE European panel is considerably limited in comparison to the panel of the Scandinavian countries. Especially in regards to total public expenditure on education the data for Macedonia was only available for the years 2002 and 2003.6 Despite several attempts to salvage the data from other databases,
ultimately Macedonia was excluded when considering the regression model with total public expenditure on education.
6 For several other considered variables there was no data in 2010 real million euros so the variables in
3. DISCUSSION AND RESULTS
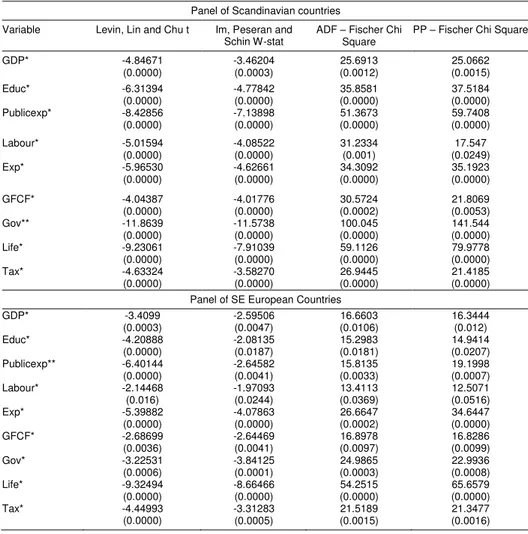
The stationarity of all of the variables considered in the model is confirmed, with a summary of the conducted tests presented in Table 2.
Table 2. Unit root tests with constant and without trend: 1995–2015 Panel of Scandinavian countries
Variable Levin, Lin and Chu t Im, Peseran and Schin W-stat
ADF – Fischer Chi Square
PP – Fischer Chi Square
GDP* -4.84671
(0.0000) -3.46204 (0.0003) 25.6913 (0.0012) 25.0662 (0.0015)
Educ* -6.31394
(0.0000) -4.77842 (0.0000) 35.8581 (0.0000) 37.5184 (0.0000) Publicexp* -8.42856
(0.0000) -7.13898 (0.0000) 51.3673 (0.0000) 59.7408 (0.0000)
Labour* -5.01594
(0.0000) -4.08522 (0.0000) 31.2334 (0.001) 17.547 (0.0249)
Exp* -5.96530
(0.0000) -4.62661 (0.0000) 34.3092 (0.0000) 35.1923 (0.0000)
GFCF* -4.04387
(0.0000) -4.01776 (0.0000) 30.5724 (0.0002) 21.8069 (0.0053)
Gov** -11.8639
(0.0000) -11.5738 (0.0000) 100.045 (0.0000) 141.544 (0.0000)
Life* -9.23061
(0.0000) -7.91039 (0.0000) 59.1126 (0.0000) 79.9778 (0.0000)
Tax* -4.63324
(0.0000) -3.58270 (0.0000) 26.9445 (0.0000) 21.4185 (0.0000) Panel of SE European Countries
GDP* -3.4099
(0.0003) -2.59506 (0.0047) 16.6603 (0.0106) 16.3444 (0.012)
Educ* -4.20888
(0.0000) -2.08135 (0.0187) 15.2983 (0.0181) 14.9414 (0.0207) Publicexp** -6.40144
(0.0000) -2.64582 (0.0041) 15.8135 (0.0033) 19.1998 (0.0007)
Labour* -2.14468
(0.016) -1.97093 (0.0244) 13.4113 (0.0369) 12.5071 (0.0516)
Exp* -5.39882
(0.0000) -4.07863 (0.0000) 26.6647 (0.0002) 34.6447 (0.0000)
GFCF* -2.68699
(0.0036) -2.64469 (0.0041) 16.8978 (0.0097) 16.8286 (0.0099)
Gov* -3.22531
(0.0006) -3.84125 (0.0001) 24.9865 (0.0003) 22.9936 (0.0008)
Life* -9.32494
(0.0000) -8.66466 (0.0000) 54.2515 (0.0000) 65.6579 (0.0000)
Tax* -4.44993
(0.0000) -3.31283 (0.0005) 21.5189 (0.0015) 21.3477 (0.0016)
Note: * signifies that the variable is stationary in its first difference, while ** signifies that the variable is stationary in its second difference. Aside from the test statistic, values in the parenthesis represent the p value.
19 variables will be considered in the form in which they have rejected the null hypothesis of unit root presence.
3.1. Granger causality test
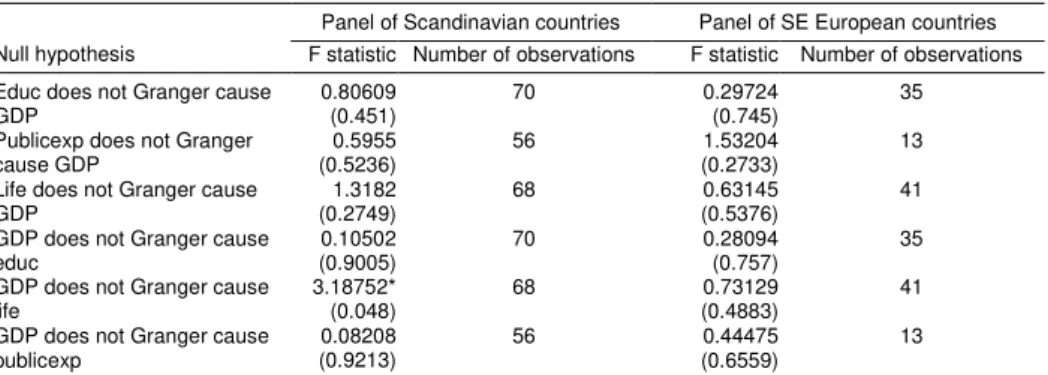
The relationship between GDP and the chosen human capital proxy variables was considered, with the results summarized in Table 3.
Table 3. Granger causality test: number of observations specified in table
Panel of Scandinavian countries Panel of SE European countries Null hypothesis F statistic Number of observations F statistic Number of observations
Educ does not Granger cause GDP
0.80609 (0.451)
70 0.29724
(0.745)
35
Publicexp does not Granger cause GDP
0.5955 (0.5236)
56 1.53204
(0.2733)
13
Life does not Granger cause GDP
1.3182 (0.2749)
68 0.63145
(0.5376)
41
GDP does not Granger cause educ
0.10502 (0.9005)
70 0.28094
(0.757)
35
GDP does not Granger cause life
3.18752* (0.048)
68 0.73129
(0.4883)
41
GDP does not Granger cause publicexp
0.08208 (0.9213)
56 0.44475
(0.6559)
13
Note: * indicates rejection of the null hypothesis at p=0.05; p values may be found in the parenthesis.
Based upon the results of the Granger causality test, we fail to reject the null hypothesis for both panels regarding either of the chosen human capital proxy variables Granger causing GDP. The only statistically significant relationship that was detected using the Granger causality test is between GDP Granger causing life for the panel of Scandinavian countries. As the results of this basic analytic tool have not provided significant results nor suggested that the human capital proxy variables are significant to economic growth to either panel of countries, the regression results should either conclude that the chosen human capital proxy variables are not statistically significant to both panels or provide an alternative conclusion.
3.2. Model specification and stepwise regression
Aside from the chosen human capital proxy variables, the remaining two explanatory variables are chosen through stepwise regression. Table 4 summarizes the stepwise regression analysis.
Table 4. Stepwise regression: 1996–2015
Panel of Scandinavian countries Panel of SE European countries
Variable t-statistic p value t-statistic p value
Exp 12.77834*** 0.0000 6.0676061*** 0.0000
Tax 6.338861*** 0.0000 3.360633*** 0.0021
GFCF 3.155432*** 0.0024 3.656456*** 0.001
Gov -1.362953 0.1777 2.362463*** 0.0015
Labour 1.1101145 0.275 3.485775** 0.0248
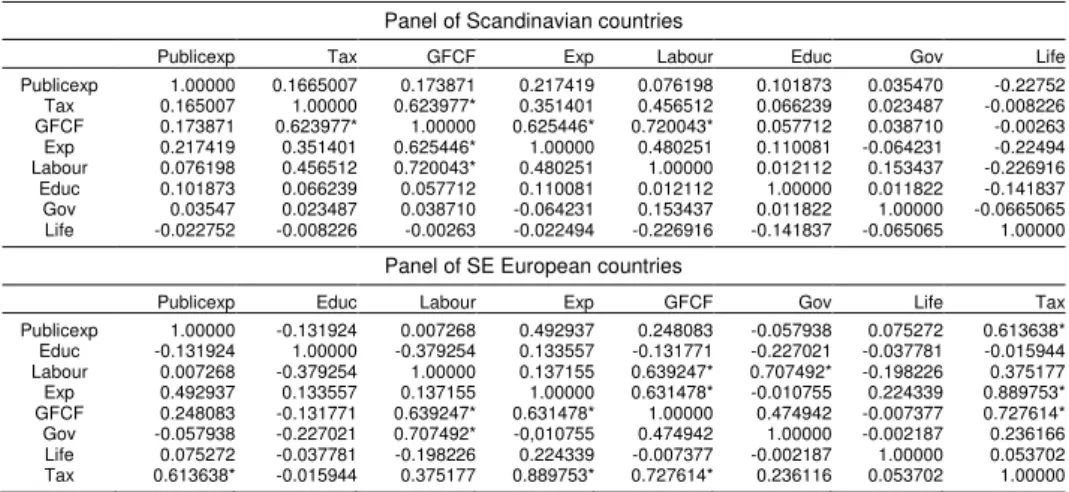
Based upon the results of the stepwise regression, the variables that will maximize the explanatory value of the model are export of goods and services and taxes less subsidies on products for the panel of Scandinavian countries. For the panel of SE European countries the variables that maximize the explanatory value of the model are export of goods and services and gross fixed capital formation. In order to avoid multicollinearity issues, a correlation matrix is considered between all of the possible explanatory variables.7 For both panels there is no significant correlation8 between the
human capital proxy variables and the other explanatory variables.9 For the panel of
Scandinavian countries, the variables that are proposed by the stepwise regression are adequate due to the fact that there is no significant correlation between exports of goods and services and taxes less subsidies on products. For the panel of SE European countries, there is significant correlation between exports of goods and services with the explanatory variables gross fixed capital formation and taxes less subsidies on products. Therefore to avoid multicollinearity issues, the best option was to consider exports of goods and services and the third variable proposed by the stepwise regression, which is total government expenditure.
3.3. Panel regression
Due to the fact that the number of regressors is larger than the number of cross-section units, using a random error regression would yield statistically inaccurate results. Therefore, a standard pooled regression is considered, as well as a regression with cross-section dummy variables. Summarized results are presented in Table 5. Specification tests for the chosen model for both panels are briefly considered and further discussed in the appendix.
Table 5. Summary of panel regression results: 1996–2015
Pooled regression Cross-section fixed regression Panel of Scandinavian countries10
Variable Coefficient Standard error p value Coefficient Standard error p value
Exp*** 0.297601 0.017678 0.0000 0.30861 0.017608 0.0000 Tax*** 0.319358 0.036821 0.0000 0.289376 0.035925 0.0000 Life -0.000153 0.006802 0.9821 0.005768 0.00651 0.3795 Educ 0.000389 0.000742 0.602 0.000397 0.000693 0.5695 Publicexp** 0.065774 0.029464 0.0295 0.062896 0.027883 0.0282 Constant -0.001099 0.002301 0.6346 -0.001943 0.002169 0.3744
R-squared 0.909739 0.927812
Adjusted R-squared 0.901822 0.917118
Durbin-Watson statistic
1.828564 2.26019
7 The correlation matrix generated by E-Views may be found in the appendix. 8 Significant correlation would be considered if the value was higher than 0.5.
9 The only exception being statistically significant correlation between total public expenditure on
education and taxes less subsidies on products in the panel of SE European countries.
10 The value of the Jarque-Berra test statistic of 3.059, with a p value of 0.216608 indicates that we fail to
21 Table 5. (continued)
Pooled regression Cross-section fixed regression
Panel of SE European countries11
Variable Coefficient Standard error p value Coefficient Standard error p value
Exp*** 0.463775 0.042649 0.0000 0.46702 0.04772 0.0000 Gov*** 0.643325 0.139753 0.0008 0.650256 0.149016 0.0014 Life** -0.022805 0.009312 0.0323 -0.022457 0.009847 0.0457 Educ -0.009828 0.005129 0.0817 -0.00876 0.006986 0.2384 Publicexp -0.021675 0.061551 0.7314 -0.019109 0.065264 0.7757 Constant 0.000419 0.00663 0.9507 -0.000591 0.009124 0.9434
R-squared 0.943554 0.943874
Adjusted R-squared 0.917897 0.910199
Durbin-Watson statistic
2.381593 2.392973
Note: *,**,*** implies statistical significance at the respected 0.1, 0.05 and 0.01 values.
Based upon the results of the panel regression, the cross-section fixed model was deemed most representative for the panel of Scandinavian countries and upon conducting the specification tests it exhibited no signs of statistical errors. For the panel of SE European countries, the standard pooled regression results are considered due to the fact that we fail to reject the hypothesis that the fixed effects are redundant. The panels for both countries have a satisfactory R-squared value which indicates that the independent variables can respectably account for 92.8% and 94.4% of the change of the dependant variable. The adjusted R-square, which takes into account the number of independent values in the model, is satisfactory. The final conclusion of the regression is that of the three selected human capital proxy variables, only one was statistically significant at p=0.05 in each of the respective models. In the model considering the Scandinavian countries, the variable total public expenditure on education was statistically significant. It indicates that there is a positive relationship between public expenditure on education and GDP growth. Of the human capital proxy variables considered for the panel of SE European model, only life expectancy was statistically significant at p=0.05 and it had a slightly negative effect on GDP growth. Including the dummy variable EU did not positively affect the explanatory value of the models nor was it deemed statistically significant at p=0.05 for either model.
3.4. Relevance and implications
The results of the panel regression seem to incline that there is no statistically significant positive relationship between the chosen human capital proxy variables and GDP growth in the SE European countries. Perhaps partially the cause is the methodological framework of considering human capital through proxy variables, yet in the case of the Scandinavian countries there was a positive relationship between total public expenditure on education and GDP growth. Akpolat (2014) attempts to explain the relationship
11 The value of the redundant fixed error test confirmed that the cross-section dummy variables included
between life expectancy and economic growth through the viewpoint of the financial burden of retirement. This is a significant problem in several SE European countries where the ratio between the working population and retirees is dangerously close to 1:1. A ratio close to one employee for each retiree in countries with relatively low natural growth and concerning demographic statistics is not sustainable in the long term. Even
during Mankiw’s (1995) consideration of secondary school enrolment rate as a human
capital proxy variable, there was criticism that it was an inadequate variable. Perhaps due
to the presence of the ˝brain drain˝ phenomenon any kind of measuring of enrolment in
education may prove unfavourable results for the panel of SE European countries. Although there is still much debate regarding the measurement of human capital the vast majority of existing calculations of human capital depend upon proxy variables at some point of the calculation. It is possible to conclude that expenditure on education displays the perceived relevance of education in certain societies as one of the pillars of obtaining and increasing human capital. As such it served as an adequate proxy variable to display significant differences between the panel of SE European countries and the Scandinavian countries.
CONCLUSION
Several statistical analysis tools were used to analyse the relevance of chosen human proxy variables on economic growth for selected panels of SE European and Scandinavian countries. While the Granger causality test failed to reject the null hypothesis regarding statistically significant impact of the chosen human capital proxy variables on economic growth, a panel pooled regression confirmed that there was statistically significant relevance of life expectancy on economic growth in the panel of SE European countries and total public expenditure on education in the panel of Scandinavian countries. The results provided by this study suggest that there are statistically significant differences between the relevance of human capital on economic growth in the selected panel of SE European countries and in the Scandinavian countries. The empiric results confirm that, taking into account the current consideration of human capital, it has a far more significant impact on economic growth in more developed economies in comparison to developing economies.
REFERENCES
Akpolat, Ahmet Gokce. 2014. The Long-Term Impact of Human Capital Investment on GDP: A Panel Cointegrated Regression Analysis. Economics Research International (2014): 1–10. doi: 10.1155/2014/ 646518.
Dickey, David A., and Wayne A. Fuller. 1979. Distribution of the Estimators for Autoregressive Time Series with a Unit Root. Journal of the American Statistical Association 74 (366): 427–431.
Eurostat, http://ec.europa.eu/eurostat (accessed March 2, 2016).
Edrees, Abdelbagi. 2016. Human Capital, Infrastructure and Economic Growth in Arab World: A Panel Granger Causality Analysis. Business and Economics Journal 7. doi:10.4172/2151-6219.1000201. General Assembly Resolution A/55/L.2, United Nations Millennium Declaration (8 September 2000) available
from: http://www.un.org/millennium/declaration/ares552e.htm (accessed March 1, 2016)
Giménez, Gregorio, Carmen López-Pueyo, and Jaime Sanaú. 2015. Human Capital Measurement in OECD Countries and its Relation to GDP growth and Innovation. Revista de Economía Mundial 39: 77–107. Granger, Clive W. J. 1969. Investigating Causal Relations by Econometric Models and Cross-spectral
23 Im, Kyung So., Hashem M. Pesaran, and Yongcheol Shin. 2003. Testing for Unit Roots in Heterogeneous
Panels. Journal of Econometrics 115(1): 53–74.
Judson, Ruth. 2002. Measuring Human Capital Like Physical Capital: What Does It Tell us? Bulletin of
Economic Research 54 (3): 209–231.
Kumar, Sanjiv, Neeta Kumar, and Saxena Vivekadhish. 2016. Millennium Development Goals (MDGs) to Sustainable Development Goals (SDGs): Addressing Unfinished Agenda and Strengthening Sustainable Development and Partnership. Indian Journal of Community Medicine 41(1): 1–4.
Levin, Andrew. Chien-Fu Lin, and Chia-Shang J. Chu. 2002. Unit Root Tests in Panel Data: Asymptotic and finite-sample properties. Journal of Econometrics 108 (1): 1–24.
Lucas, Robert E. 1988. On the Mechanics of Economic Development. Journal of Monetary Economics 22: 3– 42.
Mankiw, Gregory N. 1995. The Growth of Nations. Brookings Papers on Economic Activity 26: 275–326. Mujahid, Noreen, Amjad Amin, and Sanam W. Khattak. 2014. Human Capital Investment and Physical Capital
Nexus (A Path to Economic Growth of the Country): A Case Study of Pakistan 1980–2010. Putaj
Humanities & Social Sciences 41(1): 181–187.
Neagu, Olimpia. 2012. The Market Value of Human Capital: An Empirical Analysis. Annals of the University
of Oradea, Economic Science Series 21 (2): 256–264
Seccareccia, Mario. 2015. Basic Income, Full Employment, and Social Provisioning: Some Polanyian/Keynesian Insights. Journal of Economic 49 (2): 397–404.
Skare, Marinko. 2001. Human Capital as a Source of Growth: Myth or Reality? Ekonomski pregled 52 (1–2): 189–205.
Tica, Josip, and Damira Djukec. 2008. Doprinos ljudskog kapitala ekonomskom rastu u Hrvatskoj. [The Impact of Human Capital on Economic Growth in Croatia]. Zbornik Ekonomskog fakulteta u Zagrebu 6: 289– 301.
United Nations, http://www.un.org/sustainabledevelopment/sustainable-development-goals/ (accessed March 1, 2016).
APPENDIX
The correlation matrix for the independent variables used in the panel of Scandinavian countries and the SE European countries is presented in Table A1.
Table A1. Correlation matrix for independent variables
Panel of Scandinavian countries
Publicexp Tax GFCF Exp Labour Educ Gov Life
Publicexp 1.00000 0.1665007 0.173871 0.217419 0.076198 0.101873 0.035470 -0.22752 Tax 0.165007 1.00000 0.623977* 0.351401 0.456512 0.066239 0.023487 -0.008226 GFCF 0.173871 0.623977* 1.00000 0.625446* 0.720043* 0.057712 0.038710 -0.00263 Exp 0.217419 0.351401 0.625446* 1.00000 0.480251 0.110081 -0.064231 -0.22494 Labour 0.076198 0.456512 0.720043* 0.480251 1.00000 0.012112 0.153437 -0.226916 Educ 0.101873 0.066239 0.057712 0.110081 0.012112 1.00000 0.011822 -0.141837 Gov 0.03547 0.023487 0.038710 -0.064231 0.153437 0.011822 1.00000 -0.0665065 Life -0.022752 -0.008226 -0.00263 -0.022494 -0.226916 -0.141837 -0.065065 1.00000
Panel of SE European countries
Publicexp Educ Labour Exp GFCF Gov Life Tax
Publicexp 1.00000 -0.131924 0.007268 0.492937 0.248083 -0.057938 0.075272 0.613638* Educ -0.131924 1.00000 -0.379254 0.133557 -0.131771 -0.227021 -0.037781 -0.015944 Labour 0.007268 -0.379254 1.00000 0.137155 0.639247* 0.707492* -0.198226 0.375177 Exp 0.492937 0.133557 0.137155 1.00000 0.631478* -0.010755 0.224339 0.889753* GFCF 0.248083 -0.131771 0.639247* 0.631478* 1.00000 0.474942 -0.007377 0.727614* Gov -0.057938 -0.227021 0.707492* -0,010755 0.474942 1.00000 -0.002187 0.236166 Life 0.075272 -0.037781 -0.198226 0.224339 -0.007377 -0.002187 1.00000 0.053702 Tax 0.613638* -0.015944 0.375177 0.889753* 0.727614* 0.236116 0.053702 1.00000
Note: * signifies statistically significant correlation between the variables
Table A2. Redundant Fixed Effects Test for panel of Scandinavian countries
Effects test Value of test statistic d.f. p value
Cross-section F 4.506512 (3,54) 0.0068
Cross-section Chi square 14.076276 3 0.0028
For the panel of SE European countries, as can be seen in the value of the cross-section F statistic in Table A3, we fail to reject the null hypothesis that there are statistically significant cross fixed effects. Taking into account these results, only the standard pooled regression was considered.
Table A3. Redundant Fixed Effects Test for panel of SE European countries
Effects test Value of test statistic d.f. p value
Cross-section F 0.056967 (1,10) 0.8162
Cross-section Chi square 0.09657 1 0.756
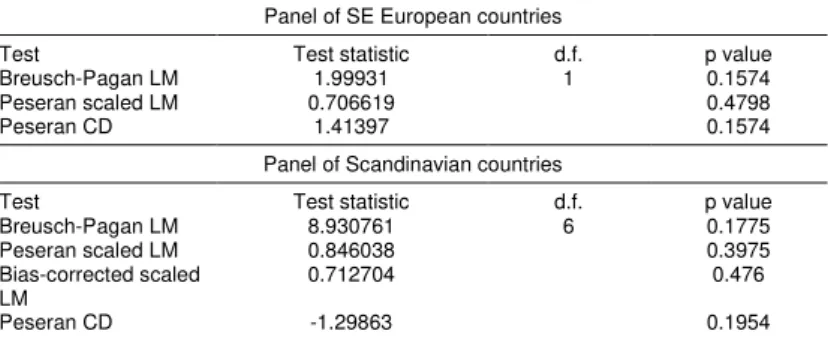
As can be seen from the value of the LM test for autocorrelation, all of the test statistic values suggest that we fail to reject the null hypothesis of no cross-section correlation in residuals, meaning that the model is adequate. These calculations are conducted for the chosen models – the pooled panel regression model for the SE European countries and the cross-sections fixed regression model for the panel of Scandinavian countries.
Table A4. LM Test for Autocorrelation for selected models Panel of SE European countries
Test Test statistic d.f. p value
Breusch-Pagan LM 1.99931 1 0.1574
Peseran scaled LM 0.706619 0.4798
Peseran CD 1.41397 0.1574
Panel of Scandinavian countries
Test Test statistic d.f. p value
Breusch-Pagan LM 8.930761 6 0.1775
Peseran scaled LM 0.846038 0.3975
Bias-corrected scaled LM
0.712704 0.476