❊♥s❛✐♦s ❊❝♦♥ô♠✐❝♦s
❊s❝♦❧❛ ❞❡
Pós✲●r❛❞✉❛çã♦
❡♠ ❊❝♦♥♦♠✐❛
❞❛ ❋✉♥❞❛çã♦
●❡t✉❧✐♦ ❱❛r❣❛s
◆
◦✻✾✵
■❙❙◆ ✵✶✵✹✲✽✾✶✵
❚❤❡ ■♠♣❛❝t ♦❢ ❆■❉❙ ♦♥ ■♥❝♦♠❡ ❛♥❞ ❍✉♠❛♥
❈❛♣✐t❛❧
P❡❞r♦ ❈❛✈❛❧❝❛♥t✐ ●♦♠❡s ❋❡rr❡✐r❛✱ ▼❛r❝❡❧♦ ❘♦❞r✐❣✉❡s ❞♦s ❙❛♥t♦s✱
❙❛♠✉❡❧ ❞❡ ❆❜r❡✉ P❡ss♦❛
❖s ❛rt✐❣♦s ♣✉❜❧✐❝❛❞♦s sã♦ ❞❡ ✐♥t❡✐r❛ r❡s♣♦♥s❛❜✐❧✐❞❛❞❡ ❞❡ s❡✉s ❛✉t♦r❡s✳ ❆s
♦♣✐♥✐õ❡s ♥❡❧❡s ❡♠✐t✐❞❛s ♥ã♦ ❡①♣r✐♠❡♠✱ ♥❡❝❡ss❛r✐❛♠❡♥t❡✱ ♦ ♣♦♥t♦ ❞❡ ✈✐st❛ ❞❛
❋✉♥❞❛çã♦ ●❡t✉❧✐♦ ❱❛r❣❛s✳
❊❙❈❖▲❆ ❉❊ PÓ❙✲●❘❆❉❯❆➬➹❖ ❊▼ ❊❈❖◆❖▼■❆
❉✐r❡t♦r ●❡r❛❧✿ ❘❡♥❛t♦ ❋r❛❣❡❧❧✐ ❈❛r❞♦s♦
❉✐r❡t♦r ❞❡ ❊♥s✐♥♦✿ ▲✉✐s ❍❡♥r✐q✉❡ ❇❡rt♦❧✐♥♦ ❇r❛✐❞♦
❉✐r❡t♦r ❞❡ P❡sq✉✐s❛✿ ❏♦ã♦ ❱✐❝t♦r ■ss❧❡r
❉✐r❡t♦r ❞❡ P✉❜❧✐❝❛çõ❡s ❈✐❡♥tí✜❝❛s✿ ❘✐❝❛r❞♦ ❞❡ ❖❧✐✈❡✐r❛ ❈❛✈❛❧❝❛♥t✐
❈❛✈❛❧❝❛♥t✐ ●♦♠❡s ❋❡rr❡✐r❛✱ P❡❞r♦
❚❤❡ ■♠♣❛❝t ♦❢ ❆■❉❙ ♦♥ ■♥❝♦♠❡ ❛♥❞ ❍✉♠❛♥ ❈❛♣✐t❛❧✴
P❡❞r♦ ❈❛✈❛❧❝❛♥t✐ ●♦♠❡s ❋❡rr❡✐r❛✱ ▼❛r❝❡❧♦ ❘♦❞r✐❣✉❡s ❞♦s ❙❛♥t♦s✱
❙❛♠✉❡❧ ❞❡ ❆❜r❡✉ P❡ss♦❛ ✕ ❘✐♦ ❞❡ ❏❛♥❡✐r♦ ✿ ❋●❱✱❊P●❊✱ ✷✵✶✵
✭❊♥s❛✐♦s ❊❝♦♥ô♠✐❝♦s❀ ✻✾✵✮
■♥❝❧✉✐ ❜✐❜❧✐♦❣r❛❢✐❛✳
The Impact of AIDS on Income and Human Capital
Pedro Cavalcanti Ferreira
yFundação Getulio Vargas
Samuel Pessôa
Fundação Getulio Vargas
Marcelo Santos
Fundação Getulio Vargas
Abstract
This paper studies the impact of HIV/AIDS on per capita income and education. It ex-plores two channels from HIV/AIDS to income that have not been su¢ciently stressed by the literature: the reduction of the incentives to study due to shorter expected longevity and the reduction of productivity of experienced workers. In the model individuals live for three periods, may get infected in the second period and with some probability die of Aids before reaching the third period of their life. Parents care for the welfare of the future generations so that they will maximize lifetime utility of their dynasty. The simulations predict that the most a¤ected countries in Sub-Saharan Africa will be in the future, on average, thirty percent poorer than they would be without AIDS. Schooling will decline in some cases by forty percent. These …gures are dramatically reduced with widespread medical treatment, as it increases the survival probability and productivity of infected individuals.
A …rst version of this paper was partially written when the …rst author was visiting the University of Illinois at Urbana-Champaign. He would like to thank the hospitality of the department of economics and Steve Parente, Werner Baer, Frank Shupp, the editor and two anonymous referees for the helpful comments. The authors acknowledge the …nancial support of CNPq-Brazil and Faperj
yAuthors are from the Graduate School of Economics, Fundação Getulio Vargas, Praia de Botafogo 190, 1125, Rio
1
Introduction
In the time it takes to read this paper, more than 1600 people will become infected by the HIV virus worldwide and 960 will die due to AIDS. Seventy-one percent of the deaths will occur in Africa, by far the worst-a¤ected region. Out of the 39 million persons estimated to be living with HIV/AIDS in the world, almost 65 percent live in Sub-Saharan Africa1. Worse still, of the 5 million adults and
children newly infected with HIV, 4 million are Africans, an indication that the epidemic may not yet have reached its peak. In some countries, such as Swaziland, one out of 3 adults is infected, and the …gures for Lesotho, Botswana and Zimbabwe are not much di¤erent. By the end of 2005, there were 10 countries in Africa in which more than 10 percent of the adult population was infected with HIV, and another …ve countries with infection rates between 6 and 8 percent.
It is clear today that AIDS is not only a health disaster, but a major development crisis. There is now a large array of papers, books and newspapers articles dedicated to the study of the economic consequences of AIDS in Africa (and elsewhere). The majority of them are case studies from household or hospital surveys, from …rm or plant level evidence and from government reports.
The present paper explores two channels from HIV/AIDS to long-run income that has not been su¢ciently stressed by the literature: the reduction of the incentives to study due to shorter expected longevity and the reduction of productivity of experienced workers. According to the
World Population Prospects(United Nations, 2001), life expectancy at birth in the 35 highly a¤ected countries of Africa was estimated to be, in 1995-2000, 6.5 years less than it would have been without AIDS. In Botswana, life expectancy went from 60 years in 1985 to less than 40 in 1999 while in countries such as Swaziland, Zimbabwe, Zambia and South Africa it decreased in the same period by more than 10 years. When comparing to 2015 projections (U.S. Census Bureau, 2004) the picture is even more dramatic, as life expectancy with AIDS in Botswana, 34.7, is less than half of what it would be in a scenario without the epidemic.
The impact of longevity on development and education has been, recently, the object of a large number of studies. In Soares (2005), Khakemi-Ozacan, Ryder and Weil(2000), Boucekkine, de la Croix and Licandro(2002) and Ferreira and Pessôa(2007), we see that in one way or another, longer lives allow for extension of the population working life and, consequently, an increase in the present value of the ‡ow of wages of a given investment in education. Higher returns to education in turn
induce individuals to stay in school longer, increasing average human capital of the population, with a potential e¤ect on long-run income.
The reduction of productivity of infected workers attracted considered more attention. That is so not only because workers in poor health are unable to perform at usual levels, but because absenteeism due to illness. Case study in Burkina Faso, for instance, found that net revenues from agriculture production in Aids-a¤ected household usually decrease by 25 to 50 percent (Guinness and Alban (2000)).2 This study has also evidence of reduction in agriculture output in
AIDS-a¤ected households in Zimbabwe, which goes from 61% in the case of Maize to 29% in the case of cattle.
We use these facts to motivate an arti…cial economy where individuals live for three periods, may get infected in the second period and with some probability die of Aids before reaching the third period of their lives. Parents care for the welfare of the future generations (and their longevity), so that they will maximize lifetime utility of all future generations in their dynasty. Those with the HIV virus may receive or not medical treatment, and infected treated individuals are more productive than those that receive no medical attention (but less so than healthy agents) and have a larger chance to survive to the third period of his life. Motivated by the empirical studies of Neal and Johnson (1996) and Keane and Wolpin (1997), we assume that children’s education depends on the parental human capital investments. The reduction in longevity due to Aids decreases total funds - there are less inter-generational transfers, for instance - available for education, saving and consumption. Parents spend less time helping the education of their children, so that schooling falls when compared to a non-Aids situation. Moreover, if the life expectation along the dynasty decreases, incentives to invest in the future generations will also fall.
This all will have a direct impact on output, as human capital is a factor of production. Moreover, the marginal productivity of capital decreases with the reduction of education, a complementary input. As savings and physical capital investment are endogenous in this model, they will both fall in equilibrium, further reducing output. Additionally, Aids also have a direct impact on aggregate output as HIV positive workers are less productive and also because many workers die at their productive peak, increasing the proportion of less e¢cient workers in the labor force.
This model is used to simulate the long-run impact of the HIV/AIDS epidemics in Africa3. The
2Guinness, L and A. Alban, 2000, The Economic Impact of AIDS in Africa, A Review of the Literature, (UNAIDS background Paper for the ADF 2000).
model predicts that a country with adult infection rate of 20% such as South Africa, will be 18 % less productive than it would be without HIV/AIDS. The most a¤ected countries will be in the future, on average, a quarter poorer than they would be without AIDS. This estimated decrease in per capita output is well above previous estimates. The model also …nds that, in the long run, human capital could fall, in some cases, to two thirds of the levels observed before the epidemic. On a positive note, simulations show that the overall impact on incomes and education could be signi…cantly reduced if medical treatment is extended to most of the infected population.
The …ndings of this study are, to say the least, extremely worrisome. It indicates that the current catastrophic situation in Sub-Saharan Africa, or in any country where HIV/AIDS reaches similar levels, is not yet at its peak. We are already observing a decline in school enrollment in a¤ected areas. According to the 2002 Report on the Global HIV/AIDS Epidemic (UNAIDS (2002)), in Central African Republic and Swaziland it fell by 20-36 percent, and in parts of KwaZulu-Natal Province in South Africa, the number of pupils attending the …rst year of primary school was 20 percent lower in 2001 than in 1998, and economic hardship was the major factor. In Kenya and Tanzania, gross primary enrollment rate fell, between 1980 and 1997, from 115 percent to 85 percent and from 93 percent to 67 percent, respectively (UNAIDS, 2000). This is consistent with the channel stressed by our model. Moreover, Hamoudi and Birdsall (2004) provide econometric evidence, using Sub-Saharian African countries data, that a fall of life expectancy at birth of 10 years is associated with a reduction of 0.6 years of education. On the same topic, Soares (2006) presents micro-level evidence on the e¤ect of adult longevity on schooling. Using data from the 1996 Brazilian Demographic and Health Survey he shows that higher longevity is systematically related to higher education attainment.
fall will be caused by reduced savings as by assumption infected individuals do not save.4
Three recent contributions related to our study are Young (2005), Bell, Devarajan and Gers-bach (2006) and Corrigan, Glomm and Mendez (2005). The …rst paper …nds very little impact of AIDS/HIV. This is so because the population decrease o¤sets the detrimental impact on the human capital accumulation of orphaned children, so that the AIDS epidemic enhances future consumption prospects in South Africa. Note, however, that by working with a Solow model of capital accumula-tion the article forces a large impact of fertility decreases, as long-run income is a negative funcaccumula-tion of population growth rate. In a more complete general equilibrium model such as the neoclassical growth model (or our simple OLG model), where saving is endogenous, income in the long-run is a function of the capital-labor ratio, so that decreases in population brings about an adjustment in capital stock. Furthermore, AIDS epidemic a¤ect age-population distribution in an unequal way. It is true that AIDS brings about a reduction in population, but individuals at advanced ages tend to be more a¤ected than young ones. In some countries in Africa, in which life expectancy is very low, individuals do not reach the more productive and experienced stage of their lives5. Thus, in a life
cycle model, in which age-population distribution tends to play an important role, the increase of the marginal productivity of labor due to the reduction of population tends to be o¤set by the fall of the share of experienced workers. This is the reason that in our model changes in the population growth rate have a very small impact on output.
Bell and coauthors also focus on the impact of the disease environment on human capital trans-mission mechanisms from parents to children in a model calibrated to South Africa. Parents may die, a¤ecting the amount and quality of child-rearing and also the funds necessary to pay for formal education, which is the only form of investment. Results are such that the economy could shrink to half its current size in four generations. A similar model is also found in Corrigan, Glomm and Méndez (2005), which adds physical capital accumulation. In this model parents care for the consumption of their children (and not welfare as in ours) and HIV infected individuals die for sure in the third period of life and are less productive in the second. They …nd an impact much smaller than that in Bell, Devarajan and Gersbach (2006).
The remainder of the paper is organized in four sections. In the next section the theoretical 4Other noteworthy references are Bloom and Mahal (1997), Bonnel (2002) and Dixon, McDonald and Roberts(2000).
model is presented and in Section 3 we discuss the calibration and measurement procedures. In Section 4 the results are presented while Section 5 concludes.
2
Economic Environment
This economy is populated by overlapping generations of people who live for three periods and are altruistic toward their descendants. In the …rst period of life, "children", individuals spend all their time in school. In the second period, "young adult", they work, save and decide the human capital of their kids, by choosing the number of hours they will dedicate to their education. In the last period of life, "experienced adult", individuals only work and choose optimally a bequest, which is received by the young adults.
A fraction of young adults …nds out in the beginning of this period of their life that they are infected by HIV virus. These individuals then decide if they will start treatment or not, whose costs are exogenously given and may be partially or totally subsided by the government. The probability of surviving to the third period of life increases with the treatment. The productivity decreases if workers get infected and decreases even further if they are not getting any medical care. If their parents die of aids (or by any other reason) young adults do not receive the voluntary bequest.
All decisions in this economy are made by the parents, who care for the welfare of their children. Formally, this means that they will maximize lifetime utility of all future generations in their dynasty.
Hence, parents will take into account expected utility of future members of their dynasty when deciding bequest. In this case, the larger the bequest, the more time young adults could dedicate to the education of their children. If parents die prematurely, leaving no bequest, the disposable income of their young adults son/daughter decreases, so they will spend more time in the labor market and less at home helping the education of the kids6. Hence, the higher the infection rate
and consequently the lower life expectancy, the lower will be the education of the next generations, everything else equals. Formally, we assume that human capital of an individual of the next generation,h0, follows:
h0= (nh) ; (1)
where and are constants, n the time parents spend with their children and h is the human capital of parents.
Human capital accumulation occurs outside the labor market. However, in order to obtain a realistic wage pro…le, we assume that productivity increases along the life cycle, so that productivity of young adults, 2;is smaller than that of experienced adults, 3. We also posit that a HIV positive
worker is less productive than otherwise, but that medical expenses enhance the productivity of infected workers.
We assume that parents also care about how long each child will live, in such a way that the discount factor applied to children’s welfare is a function of their expected life expectancy. This captures the idea that parents are altruistic but the parental human capital investment may be in‡uenced by the o¤spring’s expected life expectancy since it may a¤ect the expected return on that investment.7
The model, hence, emphasizes two channels from HIV/AIDS to long-run income, the reduction of longevity and the reduction of productivity. Moreover, the fact that infected individuals die in the peak of their productivity will also impact aggregate output.
The key di¤erence among individuals is whether they were infected or not in the second period of life and, …nding themselves with the HIV virus, if they receive medical care or not. The probability of surviving to the third period of life of a healthy individual, H;is larger than that of an
infected-treated individual, I T;which, in its turn, is larger than that of an infected-non-treated individual, I N: These exogenous probabilities will allow the model to match the observed life expectancy of
di¤erent countries.
2.1
Decision problem of households:
2.1.1 Pa) Healthy individuals:
The problem of a healthy individual is to optimally pick savings,a;bequest, b0; human capital of
their children, h0 and the fraction of the time they dedicate to their children learning, n; so to
7Soares (2005) also assumes that the intergenerational discount depends on o¤spring’s life
maximize:
VH(h; b) =u(c2) + f H[u(c3) + EV(h0; b0)] + (1 H) EV(h0;0)g (2)
subject to his/her second period budget constraint:
c2+a= (1 )(1 n)wh 2+b+ ; (3)
third period budget constraint:
c3+b0 = (1 )wh 3+ (1 +r)a+ ; (4)
and the law of motion of human capital:
h0= (nh) ;
where is the discount rate with respect to his/her own future and the discount factor applied to children’s welfare.
In the second period of life net income from labor, (1 )(1 n)wh 2; and voluntary and
involuntary bequest (band , respectively) are split between consumption,c2; and savings, while
total time is divided between work and child rearing. In the third period of life, income is divided between consumption,c3;and voluntary bequest. We assumed that government taxes labor income
to …nance the subsidy to AIDS treatment. The expected welfare of the children is:
HEV(h; b) + (1 H)EV(h0;0); (5)
given by the sum of the utility EV(h; b)in the case the parent survive to the third period of life and so leaves a bequestb - multiplied by the survival probability H - and the utility EV(h0;0)
in the case the parent dies prematurely (and so the son/daughter gets no bequest) multiplied by
(1 H);the mortality risk of a health individual. The …rst component,EV(h; b);is given by:
EV(h0; b0) = (1 )V
The …rst term to the right-hand side is the probability of the son/daughter not getting infected multiplied by his/her welfare in this case. The second term is the product of the probability of getting infected and the best option, in terms of welfare, between choosing to be treated or not.
The second component of the expected welfare of the children, EV(h;0); follows exactly the same logic ofEV(h0; b0), only that no bequest is left to the son because the parent died (from other
causes than AIDS).
2.1.2 Pb) HIV positive individuals, "treated":
The problem of HIV positive individuals is similar. However, he/she will …rst choose to be treated or not, depending onVI T(h0; b0)being larger or smaller than VI N(h0; b0).
If individuals are receiving medical care, their problem is such that they choseh0; b0; n; ain order
to maximize:
VI T(h; b) =u(c2) + f I T[u(c3) + EV(h0; b0)] + (1 I T) EV(h0;0)g; (7)
subject to:
c2+a = (1 )w(1 n)h 2T +b+ (1 s)m (8)
c3+b0 = (1 )wh 3T + (1 +r)a+ (1 s)m
h0 = (nh) ,
where 2T ( 3T) is the productivity of the young (experienced) adult in this case,mthe cost of the
medical treatment andsis the government subsidy. The relevant di¤erence in the budget constraint with respect to healthy agents is that in this case agents spend in the second and third period of life a …xed amount of their income in medication. The government may pay for a fractionsof the treatment costs.
As just said, HIV positive individuals will choose between receiving or not receiving medical care by comparingVI T toVI N:If the former is larger than the latter, they will choose to be treated.
the third period of life and decreases e¤ective labor.
2.1.3 Pc) HIV positive individuals, "non treated":
In the case in which HIV positive individuals do not receive medical attention, the problem is similar to that of a treated individual, but now the (1 s)m component is not present in the budget constraint and productivity will be 2N and 3N;assumed to be smaller than 2T and 3T;
respectively. Of course, survival probabilities are also di¤erent (and smaller). Finally, we assumed that the discount factor is given by:
= (1 ) H+ [ I T + (1 ) I N]; (9)
which gives the probability that a young adult reaches the third period of life8.The …rst term
in the right-hand side is the product of the probability of not getting infected, (1 ); and the survival rate of health individual, H. The term in brackets is the survival probability of an infected
individual: the fraction of treated infected individuals, ;times their survival probability, I T;plus
the fraction of non-treated individuals, (1 ); times their survival probability I N. This is a
rather simple formulation but captures the idea that parents care not only for the welfare of their children but also for how long they will live9.
2.2
Technology:
Output is produced with a constant returns to scale Cobb-Douglas technology:
Y =ZK H1 ;
whereY represents output,Kdenotes physical capital services,H represents the aggregate human capital servicesH andZ is total factor productivity. The problem of the …rms is standard. They pick capital and human capital optimally and the …rst order conditions are given by:
w= (1 )ZK H (10)
8This is also the probability that children reach the third period of life, as there is no risk of dying between the …rst and second period of life by assumption.
9In the case of no HIV/Aids epidemic is equal to
r= ZK 1H1 (11)
2.3
Equilibrium
Our analysis focuses on stationary equilibria.10 Let ! = fh; bg and H(!) and
I(!); with
R
d H(!) =R
d I(!) = 1;denote the share of healthy and infected agents at state!:11 Given the
policy parameters;an equilibrium for this economy consists of value functions fVH(!); VI T(!); VI N(!)g,
policy functions fc2(!); c3(!); a(!); n(!); b0(!)g; a share of treated infected individuals ;
time-invariant measures of agentsf H(!); I(!)g;accidental bequest distribution ;a labor income tax
and pricesfw; rg;such that:
1)fc2(!); c3(!); n(!); b0(!)gsolve the dynamic problemsP a,P bandP c:
2)The individual and aggregate behavior are consistent:
K =
Z
[ AbI(!) + oaI(!)]d I(!)
+(1 )
Z
[ AbH(!) + oaH(!)]d H(!)
H =
Z
f A[1 nI(!)]hI(!)e2I+ ohI(!)e3Igd I(!)
+(1 )
Z
f A[1 nH(!)]hH(!)e2H+ ohH(!)e3Hgd H(!)
where Aand O are the shares of young adults and experienced adults in the population,
respec-tively.
4)factors’ prices are such that they satisfy the optimum conditions (10)and(11).
5)The share of treated-infected individuals is given by:
=
Z
Id(!)d I(!)
1 0In some experiments, we will also analyze the behavior of the economy during the transition from an equilibrium to another.
1 1Of course, the share of healthy and infected agents in the population is (1 )Rd
H(!) and R
d I(!);
whereId(!) = 18!such thatVI T(!)> VI N(!); Id(!) = 0otherwise. 6)The distribution of accidental bequests is given by:
= O
O+ A
Z
aI(!)d I(!) + (1 )
Z
aH(!)d H(!)
7)The government budget constraint is satis…ed every period:
= sm
wH
8) Let t
i(!) be the measure of agents type i = fH; Ig at period t: Given the decision rules h0(!) = (n(!)h) andb0(!), the measure of agents in equilibrium can be obtained by iteration on
the following condition:
t+1
i (!0) = i
Z
d ti(!) t+1
i (
~
!0) = (1 i)
Z
d ti(!)
where!~0= (h0;0)and t
i(!)is took as given:
3
Calibration
We calibrate our economy to some benchmark African nations. These countries were picked in order to have a broad distribution of infection rates, life expectancy and medical expenditures. Some parameters, however, will be common to all economies.
A=
1
2 + (1 ) H+
~
I
and o=
(1 ) H+
~
I
2 + (1 ) H+
~ I where ~ I = R
fId(!) I T + [1 Id(!)] I Ngd I(!):
One can see that as goes up A increases and o decreases, so that this formulation entails
that as AIDS epidemic gets worse, the share of young and less productive individuals increases and the average labor productivity in the economy falls. This variation can be in‡uenced by how many infected individuals are receiving treatment since it a¤ects the value of ~I:
Capital share is set to0:37;in line with Gollin (2002), and the annual depreciation rate to5%. The scale parameterZ of the production function was chosen in order to normalize the wage rate w. Thus, we setZ= 1:75:
We set the relative risk aversion parameter to 4.0. This value was picked because when using smaller a large number of infected individuals would choose not to be treated even with subsidy close to one. This is so because with lower ;and high intertemporal elasticity of substitution, indi-viduals do not care for smoothing consumption and would rather consume more today than spend money on treatment, even at increasing their risk of dying. However in countries were treatment is entirely funded by the government (such as Brazil) the number of HIV positive individuals that choose not to be treated is extremely small, close to zero. With = 4:0all infected individuals will receive medical care.
We used an interest rate slightly above the U.S. annual interest rate - taking into account the higher risk of African economies - as a target to calibrate the discount factor. Thus, the annual discount factor was taken to be 0.98, corresponding to an annual interest rate in the model without AIDS of about 7%.
Survival probabilities H; T and I N were chosen in order to match the life expectancy of
each type of individual in the model with those observed on data.12 To calibrate H we used the
life expectancy observed in each country before the appearance of the AIDS/HIV epidemic. In general, it means the life expectancy in 1980-85. In contrast, life expectancy in 2000-05 was taken into account to calibrate I N: This procedure might overestimate the life expectancy mainly in
that AIDS treatment started being carried out only recently in most African countries, then our assumption works because it takes time for the e¤ects of AIDS treatment to be felt by infected individuals. Finally, based on empirical evidence from Soloway (2008), life expectancy increases, on average, about 13 years for those who start getting medication at the …rst stage of the disease. Thus, we added this estimation to life expectancy in 2000-05 to obtain a value for I T:In Table 1,
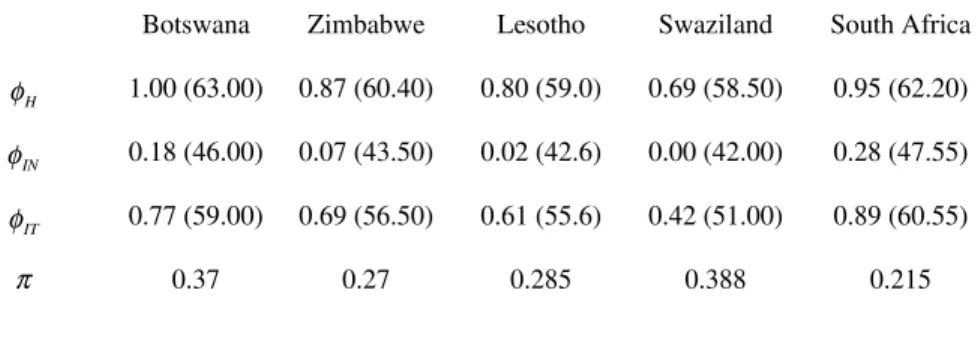
we present the values off H; I N; I Tgand the life expectancy that was used in their calibration. TABLE 1: Life expectancy parameters and infection rate
Botswana Zimbabwe Lesotho Swaziland South Africa
H
φ 1.00 (63.00) 0.87 (60.40) 0.80 (59.0) 0.69 (58.50) 0.95 (62.20)
IN
φ 0.18 (46.00) 0.07 (43.50) 0.02 (42.6) 0.00 (42.00) 0.28 (47.55)
IT
φ 0.77 (59.00) 0.69 (56.50) 0.61 (55.6) 0.42 (51.00) 0.89 (60.55)
π 0.37 0.27 0.285 0.388 0.215
We also show in the last row of Table 1 the infection rate used for each country in our simulations. These values are based on the percent of adults estimated to be living with HIV/AIDS according to UNAIDS (2003).
The parameters of the human capital production function are more di¢cult to calibrate since there is very diverse empirical evidence regarding to them13. We follow Kapicha (2005) and set
= 1:0and = 0:45:
It is very di¢cult to …nd reliable estimates of the medical cost of AIDS/HIV treatment for di¤erent countries. The price of the same medication, for instance, may change from country to country and labor cost also varies considerably. In 1999 the Brazilian Ministry of Health (Ministério da Saúde do Brasil, 1999) …nanced a very comprehensive study on the subject. It estimated the direct and indirect costs of various types of treatment (e.g., at home or in health centers), at di¤erent hospitals and cities. As one could expect, costs vary a lot across hospitals and locations, and in some cases the same type of treatment would be twice as expensive from one place to another.
Given that there was information on the number of persons receiving each type of treatment in each location, we used these estimates to calculate the annual average cost of AIDS/HIV treatment
per patient. We then divided this estimate by the Brazilian income per capita of the same period. We found that, on average, total treatment cost represented 23% of the latter. Hence, we setmto be 0.23 in every country of our sample, almost a quarter of income in the no-Aids scenario14.
Finally, to calibrate productivity we set …rstv3to be 50% larger thanv2;which was normalized to one. Remember that a period in the model represents 21 years, so that we are assuming that productivity increases by 1.8% every year. The second step is to determine the reduction in pro-ductivity due to AIDS when individuals receive or not treatment. There are not many estimates in these cases. Part of the evidence on production and productivity reduction due to AIDS comes from case studies. For instance, in Burkina Faso, net revenues from agriculture production in AIDS-a¤ected household usually decrease by 25 to 50 percent (Guinness and Alban (2000)). This study also has evidence of reduction in agricultural output in AIDS-a¤ected households in Zimbabwe, going from 61% in the case of maize to 29% in the case of cattle.
There is also evidence from company level studies. One such paper is Aventin and Huard (2000), who studied companies in Ivory Coast and found that for an HIV prevalence of 10 percent among these …rms’ workers, costs related to HIV/AIDS could be as high as 10 percent of the total labor cost.
Haacker (2000) uses these studies to calibrate the productivity reduction due to AIDS. In this paper, it is assumed that an AIDS incidence rate among the workforce of 1% reduces total factor productivity by 0.5%. This is the same as in Arndt and Lewis (2000) and Cuddington and Hancock (1994), where productivity of workers with AIDS is reduced by one half. From some of the evidence in the case studies, we …nd these values too high so that we decided for conservative parameters. We set the loss of productivity to be 15% when individuals are under medical care and 30% otherwise.
4
Results
cannot a¤ord it) and the estimated long-run decrease of output per capita ( with respect to the no-AIDS/HIV scenario) caused by the epidemic would range from 44.25% in Swaziland, the most a¤ected country in Africa, to 17.30% in South Africa.
These losses can be signi…cantly reduced as long as infected individuals get medical attention. However, given that people cannot a¤ord all the cost of medication by themselves, nobody will get treatment unless the government decides to subside it. In fact, whens= 1, all infected individuals receive medication and the fall in output per capita ranges from 25.2% to 6.8%, which is much smaller than in the case in whichs= 0. In this case, instead of a fall of almost one third in human capital accumulation in Botswana, we would observe a decrease of only 10% (and less then half the reduction of output). Likewise, in Lesotho output losses are halved when full subsidy is provided, and a major reason is that human capital jumps from 74 percent to 91 percent of the no-Aids scenario.
TABLE 2: Output, Human Capital and Infected Individuals Treated
Output Human Capital Infected Individuals Treated
s=0.0 s=0.5 s=1.0 s=0.0 s=0.5 s=1.0 s=0.0 s=0.5 s=1.0
Botswana 65.40 78.70 85.04 67.87 83.76 90.26 0.0 64.47 100.0
Zimbabwe 69.95 84.62 90.08 72.58 88.52 94.46 0.0 59.15 100.0
Lesotho 71.04 68.60 86.31 73.76 71.46 91.18 0.0 0.0 100.0
Swaziland 56.75 55.14 74.80 62.94 78.79 83.37 0.0 0.0 100.0
South Africa 82.70 85.94 93.20 84.22 88.83 96.75 0.0 52.21 100.0
medical attention and the smaller is the fall in output per capita due to the AIDS epidemic. The reason for the results described above is that treated individuals are more productive and have a smaller probability of dying. This has a direct impact on output, but also induces more human capital investment, boosting long run income even more. Once again we …nd that the impact of the disease can be signi…cantly reduced by government policy. Note that in these two relatively well-o¤ nations, full subsidy is not necessary to induce medical treatment for the entire infected population. Thus, this outcome hints that governments should provide full HIV-treatment since it not only relieves the su¤ering of infected individuals, but also improves the performance of the economy.
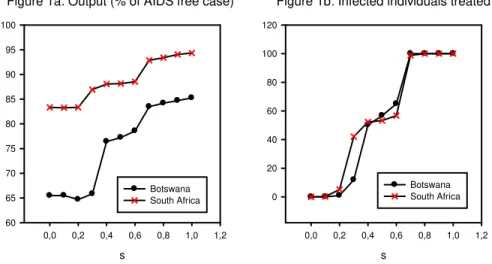
Figure 1a: Output (% of AIDS free case)
s
0,0 0,2 0,4 0,6 0,8 1,0 1,2 60 65 70 75 80 85 90 95 100 Botswana South Africa
Figure 1b: Infected individuals treated
s
0,0 0,2 0,4 0,6 0,8 1,0 1,2 0 20 40 60 80 100 120 Botswana South Africa
TABLE 3: Output per capita (% of AIDS free case)
Life expectancy Labor productivity Total
Botswana 92.01 91.78 85.04
South Africa 98.20 94.85 93.20
In Figure 2, we show the transition path of output per capita if Botswana between di¤erent steady states. First, it is presented the transition from the steady state without AIDS to one in which there is AIDS but government does not pay for the treatment. As soon as the steady state with AIDS ands= 0is reached, we assume that government start providing full subsidy for infected individuals.
Figure 2: Output per capita (% of AIDS free case) - Botswana
Periods
0 5 10 15 20 25
0,65 0,70 0,75 0,80 0,85 0,90 0,95 1,00 1,05
s=0.0 s=1.0
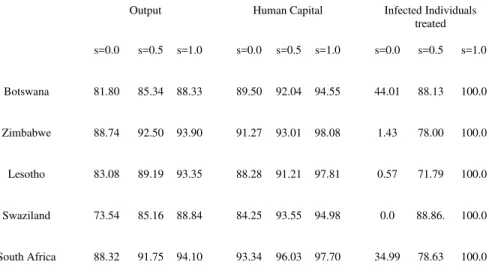
As a robustness check, in Table 4 In the table below, we show the results when = 1:0: In this case, the intergenerational discount does not depend on the o¤spring’s life expectancy and, as a result, AIDS epidemic tends to have a smaller impact on human capital accumulation and on intergenerational transfers of wealth. Now, especially in the cases in which public subsidy is low, the loss of output is smaller. It is only 26.5% in Swaziland, compared to 43% observed in the previous case, whens= 0: Still a very relevant number, but smaller than that in our benchmark calibration.
TABLE 4: Output, Human Capital and Infected Individuals Treated withγ=1
Output Human Capital Infected Individuals treated
s=0.0 s=0.5 s=1.0 s=0.0 s=0.5 s=1.0 s=0.0 s=0.5 s=1.0
Botswana 81.80 85.34 88.33 89.50 92.04 94.55 44.01 88.13 100.0
Zimbabwe 88.74 92.50 93.90 91.27 93.01 98.08 1.43 78.00 100.0
Lesotho 83.08 89.19 93.35 88.28 91.21 97.81 0.57 71.79 100.0
Swaziland 73.54 85.16 88.84 84.25 93.55 94.98 0.0 88.86. 100.0
South Africa 88.32 91.75 94.10 93.34 96.03 97.70 34.99 78.63 100.0
In table 5, we carry out a sensibility analysis regarding the relative risk aversion parameter ; for the case of Botswana.15 The output fall is now stronger; it goes from 14.96% to 18.65%. This
result is mostly due to the changes caused by the fall in life expectancy, since the isolated impact of labor productivity did not change. In fact, as opposed to the case of = 4:0;in the model with
= 3:0 when we modify the parameters of life expectancy (holding productivity constant) only 67% of the infected individuals get medical treatment, so that the fall in output is greater than that obtained with the benchmark calibration.
Note, however, that since s= 1:0 in both cases, everyone should get treatment: A reason for this …nding is that when the intertemporal substitution rate 1 increases, individuals care less about
the period of their life they consume, so they are not willing to spend even small amounts of their income on medication. Thus, given that the probability of dying early is higher for non-treated infected individuals, they may prefer not to take medication and consume as much as they can at early stages of their life, something they will not want to do if the intertemporal substitution rate is low. As said before, we …nd this result with odds with data (people do get treatment when they do not have to pay for it), but in any case the fall in output is not too distant from that of = 4:0.
Table 5: Output and Infected Individuals Treated - Botswana – s=1.0
Life expectancy Labor Productivity Total
σ=3.0 75.04; 67.67 91.98; 100.0 81.35; 100.0
σ=4.0 92.01; 100.0 91.78; 100.0 85.04; 100.0
5
Conclusion
In this paper we use an overlapping generations model with education decision by parents to study the long-run impact of the HIV/AIDS epidemic. Our results show that the life-expectancy and productivity e¤ects are very strong and apparently dominate other channels that the literature has examined. Smaller expected productive life by future members of the dynasty represents a reduction of the return to education investment and so also of the long-run level of human capital. HIV positive individuals are also less productive, so that the spread of the disease have a direct impact on output. This, in turn, decreases the return and consequently the equilibrium level of physical capital stock and savings. The …nal result is a strong decline in output per capita.
The introduction of these general equilibrium e¤ects is the main theoretical contribution of this paper to the study of the economic consequences of the HIV/AIDS epidemic. Once they are taken into account, their estimated impact on per capita income is away above previous estimates. The model predicts that, on average, the group of countries where the epidemic is stronger will be in the long run a quarter poorer than they would be without AIDS. The simulations for Swaziland and Zimbabwe are even more dramatic.
Most of the countries where AIDS has spread dramatically are already extremely poor, so their development prospects are even more pessimistic, especially if the current situation persists. Moreover, HIV/AIDS is expanding rapidly in Eastern Europe and Central Asia, reaching some of the most populous regions and countries in the world, such as China and India. In the latter, close to four million people live with HIV. Hence, if the tragedy in Africa serves as a leading indicator, in the near future there will be an economic, social and health disaster of unheard dimensions in modern times, unless a much stronger prevention e¤ort at the global level is launched.
impact on income and education, by reducing the chance of dying from the disease and by boosting the productivity of HIV positive workers. In some cases, such as South Africa, the income di¤erence between the full coverage scenario and one of no treatment at all – not too distant form the current situation – is above 10 percentage points. This result hints that if not only for purely humanitarian reasons ( e.g., decreasing the chance of dying as well as the pain and su¤ering of large populations) the investment in widespread medical programs should be consider also due to their large income return.
References
[1] Arndt, C. and Lewis. J.D. 2000.“The Macro Implications of HIV/AIDS in South Africa:
A Preliminary Assessment,” Draft, World Bank.
[2] Aventin, L. and Huard, P. 2000. “The Costs of AIDS to Three Manufacturing Firms in
Côte d’Ivoire,”Journal of African Economics 9(2): 161-188.
[3] Bell, C., Devarajan, S. and Gersbach, H. 2006.“The Long-run Economic Costs of AIDS:
A Model with an Application to South Africa”, World Bank Economic Review, 20: 55-89.
[4] Bloom, D. E. and A.S. Mahal 1997. “Does the AIDS Epidemic Threaten Economic
Growth?,” Journal of Econometrics 77(1): 105-124.
[5] Bigsten, A., et alli 2000. “Rates of Return on Physical and Human Capital in Africa’s
Manufacturing Sector,” Economic Development and Cultural Change48(4): 801-27
[6] Bonnel, R. 2000. “HIV/AIDS: Does it Increase or Decrease Growth in Africa?”, Mimeo,
World Bank.
[7] Boucekkine, R., D. de la Croix and O. Licandro, 2002. “Vintage Human Capital,
Demographic Trends and Endogenous Growth,” Journal of Economic Theory, 104(2): 340-375.
[8] Browning, M., Hansen, L.P. and Heckman, J.J. 2000."Micro Data and General
[9] Corrigan, P., G. Glomm, and F. Méndez, 2005."Aids Crisis and Growth," Journal of Development Economics, 77(2): 107-24.
[10] Cuddington, J. T. 1993. “Modeling the Macroeconomic E¤ects of AIDS, with an
Applica-tion to Tanzania”The World Bank Economic Review 7(2): 173-189.
[11] Cuddington, J. T. and Hancock, J. D. 1994. “Assessing the Impact of AIDS on the
Growth Path of the Malawian Economy,”Journal of Developing Economics 43: 363-368.
[12] Dixon, S., S. McDonald and J. Roberts, 2000. “AIDS and Economic Growth: A Panel
Data Analysis,” Manuscript, The University of She¢eld.
[13] Erosa, A., T. Koreshkova and D. Restuccia 2007. "How Important is Human Capital?
A Quantitative Theory of World Income Distribution". Working Paper, University of Toronto.
[14] Ferreira, P.C. and S.A Pessôa, 2007.“The Costs of Education, Longevity and the Poverty
of Nations,”Review of Economic Dynamics, 10(3): 472-493.
[15] Gollin, D., 2002. “Getting Income Shares Right: Self Employment, Unincorporated
Enter-prise, and the Cobb-Douglas Hypothesis,” Journal of Political Economy, 110(2): 458-472.
[16] Guinness, L and A. Alban, 2000."The Economic Impact of AIDS in Africa: A Review of
the Literature". (UNAIDS background Paper for the ADF 2000).
[17] Haacker, M. 2002. “The Economic Consequences of HIV/AIDS in Southern Africa,” IMF
Working Paper.
[18] Hamoudi, A., and N. Birdsall. 2004. "HIV/AIDS and the Accumulation and
Utiliza-tion of Human Capital in Africa." In M. Haacker, ed., The Macroeconomics of HIV/AIDS, Washington, D.C.: International Monetary Fund.
[19] Kalemli-Ozcan, S., H.E.Ryder and D.N.Weil,2000. ”Mortality Decline, Human Capital
Investment, and Economic Growth”, Journal of Development Economics, 62(1): 1-23.
[20] Kapicka,M.,2006."Optimal Income Taxation with Human Capital Accumulation and
[21] Keane, M.P. and Wolpin, K. L. 1997. "The Career Decisions of Young Men". Journal of Political Economy 105, 473-522.
[22] Ministério da Saúde do Brasil, 1999. "Estimativas dos Custos dos Tratamentos da Aids
no Brasil ", manuscript, http://www.aids.gov.br/assistencia/…pe/…pe.htm.
[23] Neal, D. A., and Johnson, W. 1996."The Role of the Premarket Factors in Black-Write
Wage Di¤erences". Journal of Political Economy 104, 869-895.
[24] Soares, R., 2005. “Mortality Reductions, Educational Attainment, and Fertility Choice”,
American Economic Review, 95(3): 580-601
[25] Soares, R. 2006. " The e¤ect of Longevity on Schooling and Fertility: Evidence From the
Brazilian Demographic and Health Survey," Journal of Population Economics, 19(1): 71-97.
[26] Soloway, B. 2008. "Life Expectancy on Antiretroviral Therapy: Dramatically Longer, but
Still Not Normal", Journal Watch General Medicine, August 5.
[27] Trostel, P.A. 1993. "The E¤ect of Taxation on Human Capital". Journal of Political
Econ-omy, 101, 327-350.
[28] UNAIDS, 2000."Report on the Global HIV/AIDS Epidemic".
[29] UNAIDS, 2003."Report on the Global HIV/AIDS Epidemic".
[30] UNAIDS, 2006."Report on the Global HIV/AIDS Epidemic".
[31] United Nations, 2001. “World Population Prospects: The 2000 Revision,” New York, NY.
[32] U.S. Census Bureau, 2004. "The AIDS Pandemic in the 21st Century".
[33] Young, A. 2005. "The Gift of the Dying: The Tragedy of AIDS and the Welfare of Future