Bioluminescence Imaging
Yoshihiro Nakajima1*, Tomomi Yamazaki2, Shigeaki Nishii2, Takako Noguchi1, Hideto Hoshino1, Kazuki Niwa1, Vadim R. Viviani3, Yoshihiro Ohmiya1*
1National Institute of Advanced Industrial Science and Technology (AIST), Ikeda, Osaka, Japan,2Tsuruga Institute of Biotechnology, TOYOBO Co., Ltd., Tsuruga, Fukui, Japan,3Laborato´rio de Bioquı´mica e Biotecnologia de Sistemas Bioluminescentes, Universidade Federal de Sa˜o Carlos, Campus de Sorocaba, Sorocaba, Sa˜o Paulo, Brazil
Abstract
We developed an enhanced green-emitting luciferase (ELuc) to be used as a bioluminescence imaging (BLI) probe. ELuc exhibits a light signal in mammalian cells that is over 10-fold stronger than that of the firefly luciferase (FLuc), which is the most widely used luciferase reporter gene. We showed that ELuc produces a strong light signal in primary cells and tissues and that it enables the visualization of gene expression with high temporal resolution at the single-cell level. Moreover, we successfully imaged the nucleocytoplasmic shuttling of importina by fusing ELuc at the intracellular level. These results demonstrate that the use of ELuc allows a BLI spatiotemporal resolution far greater than that provided by FLuc.
Citation:Nakajima Y, Yamazaki T, Nishii S, Noguchi T, Hoshino H, et al. (2010) Enhanced Beetle Luciferase for High-Resolution Bioluminescence Imaging. PLoS ONE 5(4): e10011. doi:10.1371/journal.pone.0010011
Editor:Immo A. Hansen, New Mexico State University, United States of America ReceivedJuly 29, 2009;AcceptedMarch 15, 2010;PublishedApril 2, 2010
Copyright:ß2010 Nakajima et al. This is an open-access article distributed under the terms of the Creative Commons Attribution License, which permits unrestricted use, distribution, and reproduction in any medium, provided the original author and source are credited.
Funding:This study was supported by a Grant-in-Aid for Scientific Research (No. 21590266 to YN) from Japan Society for the Promotion of Science (JSPS), New Energy and Industrial Technology Development Organization (NEDO), and Fundac¸a˜o de Amparo A Pesquisa do Estado de Sa˜o Paulo (FAPESP, Brazil) for funding the basic research. TY and SN are employed at TOYOBO Corporation. Thus, although TOYOBO Corporation did not provide direct financial support, it can be consider as an indirect funder for this study. The funders had no role in study design, data collection and analysis, decision to publish, or preparation of the manuscript.
Competing Interests:TY and SN are employees of TOYOBO Corporation. Although TOYOBO Corporation did not provide direct financial support, it can be considered as an indirect funder for this study. TOYOBO Corporation manufactures and sells ELuc cDNA and reagents. Purchase and/or use of these are not restricted by patent right. The authors confirm that these competing interests do not alter their adherence to all the PLoS ONE policies on sharing data and materials.
* E-mail: [email protected] (YN); [email protected] (YO)
Introduction
Bioluminescence reporters are widely used in various aspects of biological functions, such as gene expression, post-translational modification, and protein-protein interaction in vitro and in vivo [1,2]. Recent advances in luciferase technology permit the quantitative visualization of gene expression at single-cell resolu-tion by imaging its luminescence in real-time using a highly sensitive charged-coupled device (CCD) camera [3,4]. Although fluorescence imaging techniques that use fluorescent proteins (e.g., green fluorescent protein (GFP) and its derivatives) as probes have greatly contributed to the advancement of cell biology studies, BLI is emerging as a new and sensitive approach for understanding cell physiology.
Luciferase (i.e., enzyme) emits light by oxidizing luciferin (i.e., substrate) in a specific manner. Among the possible luciferase/ luciferin combinations, the beetle luciferase and D-luciferin (benzothiazole) pair is the best probe for long-term and non-invasive reporting of cellular events, as the luminescence generated by their reaction is highly quantitative and has an extremely low background, and luciferin is highly stable and permeates easily into cells or tissues. In addition, external light illumination, which in fluorescence-based methods causes phototoxic damage to cells and bleaches the probes by repetitive illumination, is not required for the luminescence reaction; thus, the characteristic properties of the beetle luciferase/luciferin enable longitudinal and quantitative BLI. However, the light output of the luciferases currently
available, which include FLuc from living cells, is insufficient for analyses at higher temporal and/or spatial resolution. In particular, BLI at the subcellular level is difficult because of the insufficient light output of available probes. A brighter luminescent probe is therefore required to improve the sensitivity and resolution of BLI at single-cell and intracellular resolution. To overcome the technical limitations of luciferase technology in BLI, we have developed an enhanced beetle luciferase from the previously cloned Brazilian click beetle Pyrearinus termitilluminans luciferase, which emits green light (lmax = 538 nm) with D-luciferin, and whose emission color is pH-insensitive [5], by optimizing its cDNA sequence for mammalian expression.
Results and Discussion
Improvement ofP. termitilluminansgreen-emitting luciferase for mammalian expression
expression levels and bioluminescence intensities of the wild-type luciferase and the sequence-optimized luciferase, ELuc, in mouse fibroblast NIH3T3 cells (Figure S2A and B). The transient expression of ELuc in these cells under the control of the cytomegalovirus (CMV) promoter led to a dramatic increase in both the expression at the protein level and in the intensity of the bioluminescent signal (260-fold) in cell extracts when compared with those observed for wild-type luciferase. ELuc exhibits a bioluminescence spectrum in cell extracts with a peak at 538 nm that is identical to the wild-type form [5].
Comparison of light output from FLuc and ELuc using a photomultiplier recording of clock gene expression in fibroblasts
Next, we compared the light output of ELuc with that of FLuc fromPhotinus pyralis(luc(+), Promega) in live cells. Both luciferases were fused with the PEST element of mouse ornithine decarbox-ylase and were expressed in NIH3T3 cells under the control of the mouse clock gene (mPer2) promoter using the same vector backbone. The bioluminescence of these molecules after stimula-tion with dexamethasone was recorded in real-time for 96 h in the presence of D-luciferin using a luminometer. Interestingly, although both luciferases monitored the circadian oscillation of mPer2with a slight delay in phase, ELuc produced a biolumines-cent signal that was 14-fold higher than that of FLuc (Figure 1A). It is assumed that differences in the light output from cells may have been caused by differences in the level of expression and/or stability of the luciferases in these cells. The protein expression level of ELuc was 3-fold higher than that of FLuc, and the functional half-life of ELuc (t1/2= 4 h) in NIH3T3 cells was significantly longer than that of FLuc (t1/2#1 h) (Figure 1B and C), indicating that ELuc is highly expressed and moderately stable in the cells compared with FLuc.
Measurement of the FLuc and ELuc spectra in viable cells
It has been reported that the emission spectrum of FLuc is influenced by reaction conditions, which include pH and temperature, with concomitant changes in quantum yield [7-11]. This property is probably also affected by the reaction condition in viable cells. In addition, the characteristic properties of the emission spectrum in living cells are a critically important feature in the multicolor luciferase assay method [12-14], in which the expression of multiple genes is monitored simultaneously using different color-emitting luciferases. We determined the emission spectra of ELuc and FLuc in NIH3T3 cell extracts and in living cells. ELuc exhibited a similar spectrum in cell extracts (data not shown) and in live cells (Figure 1D), with a peak at 538 nm. In contrast, FLuc exhibited a yellow-green light with a peak at 560 nm in cell extracts, as reported previously [7,10,11], whereas its peak was red-shifted to 610 nm (with a small shoulder at 560 nm) in living cells (Figure 1D), similar toin vivoobservations [9]. Previous observations revealed that FLuc emits red light, the spectrum of which is similar to that observed in live cells (Figure 1D) at low pH or high temperature. In addition, the light output and the quantum yield drastically decrease under these conditions [8,11]. These findings suggest that reaction efficiency, which includes the quantum yield of FLuc, was lower in live cells than in cell extracts, whereas the reaction efficiency of ELuc may be similar in the two contexts. Furthermore, the color of the stable bioluminescence produced by ELuc in live cells demonstrates the feasibility of its use in multicolor BLI in combination with other types of luciferases that emit at different wavelengths, whereas the sensitive spectral emission of FLuc is not amenable to this type of application.
In vitroluminescence and kinetic measurements of purified FLuc and ELuc
To examine the difference in light output from FLuc and ELuc in living cells, we measured the luminescence intensity and kinetics of purified recombinant FLuc and ELuc. The emission spectra of both purified luciferases were consistent with those measured in cell extracts (data not shown). Figure S3A shows representative kinetics of the light output from purified FLuc and ELuc when PicaGene (Toyo Ink) was used as the luminescent substrate. After the addition of the substrate, the FLuc signal remained constant, whereas the ELuc signal gradually increased. The sustaining luminescence kinetics of FLuc are partly attributed to coenzyme A (CoA), a vestigial substrate of beetle luciferase included with the PicaGene reagent, by which CoA removes from the FLuc active site the inhibitors that are produced by luciferin–luciferase reaction [15,16]. Similarly, CoA also seems to participate in the long-lasting light production of ELuc, as discussed by Silva Neto et al. [6]. In contrast to the light output from living cells, the resulting bioluminescence intensity of purified ELuc protein (normalized to the amount of protein) was unexpectedly slightly lower than that of FLuc, (Figure S3B), suggesting that the brighter luminescent signal from viable cells is not simply attributable to the enzymatic activity of the lucifearase.
Recently, several physicochemical properties of recombinant wild-typeP. termitilluminansluciferase (the amino acid sequence of which is the same as that of ELuc, with the exception of a deletion of the duplicated first methionine, as described in the Materials and Methods section) have been determined, and these have been compared with those of other beetle luciferases, including FLuc [6]. The Michaelis–Menten constant (Km) of the wild-type P. termitilluminansluciferase for D-luciferin is rather higher than that of FLuc, whereas theirKmvalues for adenosine triphosphate (ATP) are almost identical. The catalytic constants of both luciferases are also similar. Therefore, these kinetic properties may not contributed to the high light output of ELuc in living cells. In contrast, the decay constant of the luminescence of the wild-type luciferase is higher than that of FLuc [6]. When we measured the luminescence kinetics of purified FLuc protein by adding ATP and Mg2+ as cofactors and D-luciferin, the luminescence displayed
flash-like kinetics (Figure 1E), as descried previously [10]. In contrast, the purified ELuc protein displayed a low increase and a slow apparent decay rate compared with those of FLuc, suggesting a faster release of the luciferin–luciferase reaction product and slower inhibition by the product. In a preliminary study, we also measured the quantum yield of the purified ELuc protein and estimated it to be 1.5-fold higher than that of FLuc (unpublished data). Thus, the slow luminescence decay kinetics and the slightly higher quantum yield of ELuc should facilitated the producing of a stronger bioluminescent signal. However, we can not attribute the greater light intensity (over 10-fold) measured in living cells to these physicochemical properties alone. Therefore we assume that the higher expression of ELuc, achieved by the optimization of the cDNA sequence, and its stability in living cells contribute more to its much brighter signal in cells than do its physicochemical properties.
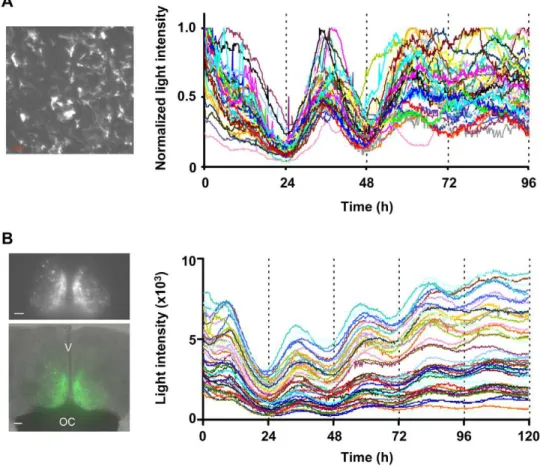
Time-lapse BLI of clock gene expression in primary astrocytes using ELuc
culture. The reporter plasmid mPer2-ELuc-PEST was transiently transfected into cultured astrocytes by electroporation and ELuc luminescence after stimulation with dexamethasone was recorded
using 9 min of exposure time at 10 min intervals for 96 h on a luminescence microscope (CellGraph, ATTO) (Figure 2A). Using a photomultiplier to record luminescence signals, we noted that
Figure 1. Comparison of the characteristic properties of FLuc and ELuc in NIH3T3 cells. (A) Photomultiplier recording of mPer2
transcriptional oscillation in NIH3T3 cells expressing destabilized ELuc (green filled circles) and FLuc (orange filled circles). The reporter plasmids mPer2-dELuc or mPer2-dFLuc were cotransfected with pCMV-CLuc and cells were stimulated with 100 nM of dexamethasone. The respective luciferase activities were normalized to CLuc activity. Error bars indicate the standard deviation (n = 4). Theinsetshows recordings in the case that the peak values of the curves were set to 1. Schematic drawings of the reporter plasmids are shown on the left. (B) Western blot analysis of FLuc and ELuc in NIH3T3 cells. The expression plasmids pCMV-Flag::FLuc or pCMV-Flag::ELuc were transfected into NIH3T3 cells, which were harvested and disrupted 48 h later. Both luciferases were detected using the anti-Flag M2 antibody. Tubulin was used as an internal control. The positions of molecular weight markers are indicated on the left margin of each panel. (C) Stability of destabilized FLuc (orange filled circles) and ELuc (green filled circles) in NIH3T3 cells. NIH3T3 cells were independently transfected with SV40-dFLuc or SV40-dELuc and the culture medium was replaced with DMEM supplemented with 10% FBS and 100mM cycloheximide. After 20 min (time = 0), incubation was continued in DMEM supplemented with 10% FBS and 100mM cycloheximide. At the
indicated times, cells were disrupted and luciferase activity was measured. Error bars indicate the standard deviation (n = 6). (D) Emission spectra of FLuc (orange line) and ELuc (green line) in viable cells. NIH3T3 cells seeded in 35 mm dishes were transfected with pGVC2 (for FLuc) or pCMV-ELuc and incubated for 48 h. To obtain the spectra, the culture medium was replaced with DMEM without phenol red supplemented with 10% FBS and 200mM
D-luciferin, and incubated for 12 h. Spectra were then measured. (E) Kinetics of light production by purified FLuc (orange filled circles) and ELuc (green filled circles) exposed to D-luciferin, ATP and Mg2+. The peak values were set to 1. Error bars indicate the standard errors (n = 3).
ELuc expressed in primary cultures emitted a signal that was 16-fold higher than that of FLuc (Figure S4A), which was similar to the measurements obtained in NIH3T3 cells (Figure 1A). As shown in Figure 2A (and Movie S1), we obtained a significantly bright signal that allowed the quantification of gene expression. Expression profiling in individual cells (n = 40) revealed that almost all cells showed circadian oscillation ofmPer2-driven ELuc luminescence, without remarkable damping, however, this oscil-lation progressively drifted out of phase after three cycles. This finding may be attributed to the loss of synchrony among cells (Figure S4C), similar to that observed in cultured fibroblasts [3,17].
Time-lapse BLI of clock gene expression in the suprachiasmatic nucleus (SCN) using ELuc
To verify whether ELuc can be used at the single-cell level to quantify gene expression in tissues, we generated transgenic mice that expressed ELuc under the control of themBmal1clock gene promoter [18]. Among the 10 transgenic lines obtained, we chose the Bmal1-ELucA4 line because it exhibited the highest light output in several tissues (data not shown). ELuc luminescence from slice cultures of the SCN, which functions as a central clock and is located in the hypothalamus, was imaged using a luminescence microscope. Luminescence was recorded using 10 min of exposure
time at 15 min intervals for 120 h without binning. We successfully detected a significantly bright signal that allowed the quantification of gene expression in individual cells, even at the 10 min exposure (Figure 2B and Movie S2). The 44 individual cells quantified in this way exhibited robust circadian oscillation of the Bmal1-driven-ELuc luminescence, with a tightly regulated period (Figure S5). An exposure of 30–60 min is generally needed for the recording of mPer1- or mPer2-driven-FLuc luminescence from transgenic mouse SCN slices [19–21]. Therefore, our result demonstrates that ELuc allows single-cell imaging analysis of tissue cultures with a much higher temporal resolution than that available using FLuc, although the promoter and the imaging equipment used in the two situations were different.
Subcellular BLI using FLuc and ELuc
Subcellular BLI has been performed in luminescent dinoflagel-lates by capturing their endogenous luciferase emission using an image-intensifier system [22]. However, as far as we know, subcellular BLI with introduction of an exogenpus luciferase gene has never been performed. Although FLuc is used to monitor gene expression by BLI at the single-cell level, it is difficult to perform luminescence imaging at the subcellular level in mammalian cells because of the insufficiency of its light output intensity. Therefore, we next attempted to perform BLI of organelles using ELuc.
Figure 2. Long-term single cell imaging of transcriptional oscillation in living cells using ELuc.(A) Representative CCD image ofmPer2
promoter-driven ELuc luminescence in rat primary astrocytes (scale bar, 100mm) (left panel) and recordings of luminescence from 40 individual cells
(right panel). Images were acquired using 9 min of exposure time at intervals of 10 min with a 46objective lens (numerical aperture (NA), 0.5).
Signals were normalized to maximum count. (B) CCD image ofmBmal1 promoter-driven ELuc luminescence from SCN slices ofBmal1::ELuc transgenic mice (Bmal1-ELucA4, upper left panel) and merged photograph of bright-field and luminescence images (green) (lower left panel). Images were taken using 10 min exposures at intervals of 15 min and a 46objective lens (scale bars, 100mm). V and OC are third ventral and optic chiasm,
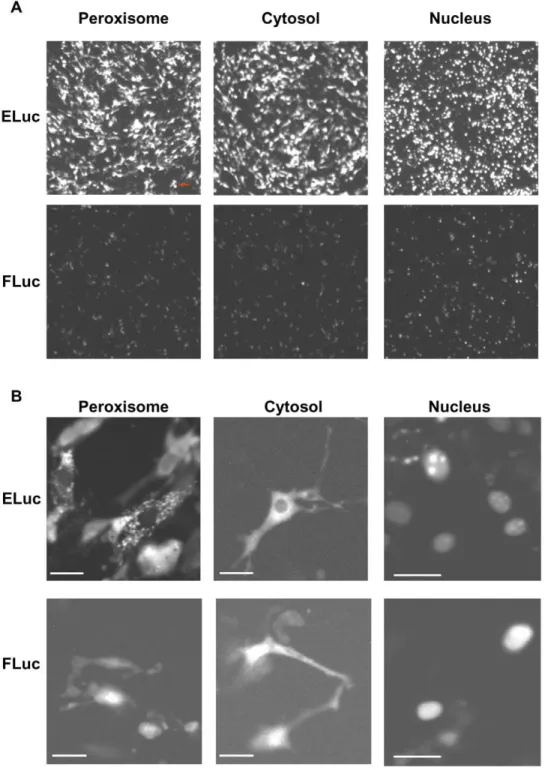
Peroxisome-, cytosol- and nucleus-localized ELuc and FLuc were transiently expressed in NIH3T3 cells under the control of the CMV promoter, and their luminescence was recorded using 3 min of exposure time (Figure 3A). We found that ELuc localized to peroxisomes and nuclei, which was verified by confocal fluores-cence imaging using peroxisome- and nucleus-targeted GFP
(Figure S6), as reported for FLuc [23,24]. As shown in Figure 3A, the quantification of the signal intensity from 150 individual cells revealed that ELuc produced 6-, 18-, and 15-fold higher luminescent signals in the peroxisome, cytosol, and nucleus, respectively, when compared with FLuc. Interestingly, the subcellular localization of ELuc was clearly imaged when images
Figure 3. Representative luminescence CCD images of subcellular-targeted ELuc and FLuc in NIH3T3 cells.(A) Luminescence images of peroxisome- (left panels), cytosol- (middle panels), and nucleus- (left panels) targeted ELuc (upper panels) and FLuc (bottom panels). Expression plasmids for the subcellular-targeted expression of luciferases under the control of the CMV promoter were transiently transfected into NIH3T3 cells. Images were acquired when the signals reached the maximum using 3 min of exposure time and a 46objective lens without binning (scale bars,
100mm). The contrast of all images was adjusted equally. (B) Luminescence images of the luciferase-expressing cells shown in A, as acquired with a
406objective lens (NA, 0.9) (scale bars, 30mm). Images were acquired using a 3 min exposure without binning.
were captured using a 406objective lens (Figure 3B). Notably,
peroxisome-targeted ELuc exhibited a typical peroxisomal dot-like pattern. In contrast, the subcellular localization images for FLuc were less clear (i.e., low resolution), even though FLuc allows nuclear imaging.
To investigate the differences in the resolution of subcellular imaging when ELuc and FLuc are used as probes, we examined the relationships between the D-luciferin concentration and the light intensities of the luciferases in living cells (Figure S7A). The cytosol-targeting expression vector pCMV–Flag::FLuc or pCMV– Flag::ELuc(cyto) was transiently transfected into NIH3T3 cells, and the luminescence was measured for 72 h in real-time with a luminometer (Kronos). We noted that each luciferases-expressing cell displayed the same kinetic pattern at all the luciferin concentrations tested, although the ELuc-expressing cells showed slower increase and decay profiles compared with those of FLuc, similar to the measurements made in vitro(data not shown). The inset of Figure S7A shows the dose–response of the D-luciferin concentrations against the peak luminescence intensities of the luciferases-expressing cells, in which each value was normalized to the count at 2000mM luciferin. The light intensities of both luciferases increased with increasing D-luciferin concentrations in the same dose-dependent manner, and reached a plateau at 1000mM. However, the light output of the FLuc-expressing cells was markedly lower than that of ELuc-expressing cells at all the luciferin concentration tested (Figure S7A). We next examined whether high-resolution CCD images of subcellular-localized FLuc could be captured. Imaging was performed at the highest luciferin concentration (2000mM), which was 10-fold higher than the concentration used for the measurements shown in Figure 3. However, the images were still unclear even at that luciferin concentration (Figure S7B), indicating that the lower-resolution images of FLuc were simply the result of its insufficient luminescence in living cells. We noted that the subcellular images were also not sharp, even when taken using longer exposure times (data not shown). Thus, although FLuc is used for BLI at the single-cell level, the light intensity produced is inadequate for subcellular imaging, as performed under our experimental conditions. These results appear to indicate that ELuc allows the live imaging of changes in intracellular localization of proteins fused to this molecule.
Time-lapse BLI of the intracellular trafficking of importin ausing ELuc
To explore the possibility of performing time-lapse BLI of intracellular trafficking of proteins using ELuc, we attempted to image the trafficking pattern of mouse importina(mRch1) [25,26], which is a representative nucleocytoplasmic shuttling protein. We removed the peroxisome targeting signal located at the extreme C-terminus of ELuc and fused importinaat this C-terminus. The fusion construct was transiently expressed in NIH3T3 cells under the control of the CMV promoter. Immunoblot analysis demonstrated that the fusion protein was expressed in these cells at the expected molecular size of 120 kDa (Figure S8). Time-lapse BLI was recorded 3 h after transfection using 3 min of exposure time at 4 min intervals (Figure 4 and Movie S3). The luminescence signal was initially detected in the cytosol at 480 min after commencement of measurements (time = 0); the signal increased gradually in the nucleus after 28 min, accompanied by a decrease of the signal in the cytosol. Conversely, the signal in the nucleus gradually decreased after 44 min, with a concomitant increase in cytosolic signal, up to 76 min. Accumulation of the signal in the nucleus was again observed from 80 to 112 min. In previous studies, time-lapse fluorescence imaging using GFP-fused importinademonstrated that this protein reversibly migrates into the
nucleus from the cytosol after treatment with UV irradiation in a time-dependent manner [27], almost identical to what was observed in the present study. This demonstrates the accuracy of intracellular BLI using ELuc as a probe.
When we performed continuous time-lapse imaging for up to 20 h, the ELuc::improtin a protein was completely retained within the nucleus after two cycles of shuttling (data not shown). It has been reported that the nuclear accumulation of importin a induced by cellular stress is triggered by the collapse of the gradient of Ran, a small GTPase that is involved in the nuclear cytoplasm shuttling of importina, resulting in the rapid nuclear accumulation importinawith impairment of its nuclear export [27]. Therefore, it is reasonable to assume that the nuclear retention of the ELuc::improtin a protein here was caused by the collapse of the Ran gradient, although we can not correlate the nucleocytoplasmic shuttling observed under our experimen-tal conditions and the ambient stress condition. It is also noted that the repeated nuclear migration of ELuc::improtinaprotein shown in Figure 4 was observed in approximately 10% of luminescent cells, whereas this protein was continuously retained in the nucleus in the other 90% of cells. This may reflect the excessive expression levels of the fusion protein, as a moderate expression level is required for retention of the protein in the cytosol [27].
Thus, we successfully used ELuc to visualize the nucleocyto-plasmic shuttling of importinaat a periodicity of approximately 30 min. This represents the first reported observation of time-lapse imaging of the intracellular movement of a protein by means of BLI.
Conclusions
In conclusion, we have developed ELuc, which is a luciferase with enhanced brightness compared with FLuc. This allowed us to successfully image not only longitudinal gene expression in primary cells and tissues with high temporal resolution, but also the intracellular trafficking of a nucleocytoplasmic shuttling protein with high spatial resolution. Therefore, ELuc is greatly advantageous for the achievement of high spatiotemporal definition BLI for the continuous visualizing gene expression and trafficking of proteins at the single-cell and subcellular levels. Furthermore, in combination with red- and/or orange-emitting luciferases [13,28], the system developed in this study can be applied to multicolor BLI, thereby enabling the simultaneous analysis of multiple cellular events.
Materials and Methods
Optimization of theP. termitilluminansluciferase sequence for mammalian expression
Plasmid construction
To construct expression plasmids carrying Flag-tagged wild-type luciferase and ELuc, cDNA sequences in which the start codon was replaced by an EcoRV site were amplified by polymerase chain reaction (PCR) using pB1py311[5] and pBlue-ELuc, respectively, as the templates. The amplified products were ligated into the EcoRV/KpnI (for wild-type luciferase) and EcoRV/XhoI (for ELuc) sites of pCMV-Tag2B (Stratagene) downstream of the immediate CMV promoter, which resulted in the pCMV-Flag::PTLuc and pCMV-Flag::ELuc constructs. pSV40-ELuc was generated by replacing the NcoI and XbaI fragment of the FLuc expression vector pGVC2 (Toyo Ink, Tokyo, Japan) with ELuc excised from the pBlue-ELuc plasmid. To generate destabilized luciferases in which the PEST element of the mouse ornithine decarboxylase was fused in-frame to the C-terminus of ELuc (dELuc) and FLuc (dFLuc), the PEST sequence (in which theNcoI site was deleted without changing the deduced amino acid sequence) was PCR-amplified using pd1EGFP-N1 (Clontech, Palo Alto, CA) as a template. To generate pGEM-PEST, the amplified fragment was subcloned into pGEM-TEasy (Promega, Madison, WI). ELuc and FLuc in which the stop codon was replaced by anEcoRV site were PCR-amplified using pBlue-ELuc and the pGVC2 as templates, respectively. The amplified fragments were ligated into the NcoI/EcoRV site of pGEM– PEST. To generate the pSV40–dELuc and pSV40–dFLuc constructs, PEST-fused ELuc (dELuc) and FLuc (dFLuc) were
excised usingNcoI andXbaI and ligated into the NcoI/XbaI site of pGVC2, in which the FLuc was removed.
To construct reporter vectors carrying themPer2promoter, the mPer2promoter fragment (2279 to+112 bp, where+1 indicates the putative transcription start site) was PCR-amplified from C57BL/6J mouse genomic, and cloned into the NheI/XhoI site of pGL3–Basic (Promega). The FLuc was replaced with theNcoI and XbaI fragments of pSV40–dELuc and pSV40–dFLuc, resulting in mPer2-dELuc and mPer2-dFLuc, respectively.
To generate the cytosol-targeting ELuc expression vector pCMV-Flag::ELuc (cyto), the ELuc cDNA in which the peroxisome-targeting signal (PTS; Ser-Lys-Lue) at the extreme C-terminus was deleted by PCR using pBlue-ELuc as the template, and the product was ligated to the EcoRV/XhoI site of pCMV-Tag2B. To construct the peroxisome-targeting FLuc expression vector pCMV-Flag::FLuc (pox), the FLuc cDNA in which a PTS was introduced at the extreme C-terminus was PCR-amplified using pGVC2 as the template, and the product was ligated to the EcoRV/XhoI site of pCMV-Tag2B. To construct expression plasmids carrying nucleus-targeting ELuc and FLuc, the cDNA sequences in which the PTS of ELuc and the STOP codons of both luciferases were replaced by aNotI site, and were PCR-amplified using pBlue-ELuc and pGVC2 as templates, respectively. To obtain the Myc::ELuc (nuc) and pCMV-Myc::FLuc (nuc) constructs, the amplified fragments were ligated into the NocI/NotI site of pCMV/myc/nuc (Invitrogen, Carlsbad,
Figure 4. Time-lapse luminescence imaging of the nucleocytoplasmic shuttling of ELuc::importinain NIH3T3 cells.The expression
plasmid carrying ELuc::importinawas transiently transfected into NIH3T3 cells. Images were acquired after 3 h of transfection using 3 min of exposure time at intervals of 4 min with a 406objective lens without binning. Numbers indicate minutes. A schematic drawing of the expression
CA) in which a triple nuclear localization signal (NLS) from SV40 large T antigen was introduced downstream of the multiple cloning site, for C-terminal fusion to the luciferases.
For confocal fluorescence imaging analysis, we generated a peroxisome-targeting EGFP in which a PTS was introduced at the extreme C-terminus of EGFP. The EGFP cDNA was PCR-amplified using EGFP-N1 (Clontech) as a template, and the product was cloned into pcDNA3.1/V5-His TOPO (Invitrogen) to yield pCMV- EGFP (pox).
To construct an expression plasmid carrying ELuc::importina, the ELuc cDNA in which the PTS and the STOP codon were replaced by anEcoRV site was PCR-amplified using pBlue-ELuc as a template, and the product was ligated into the HindIII/ EcoRV site of pcDNA3 (Invitrogen). The importin a-coding sequence (mRch1, GeneBank accession number D55720) in which the start codon was replaced by anEcoRV site was PCR-amplified using pGEX-2T-PTAC58 [25] (kind gift from Dr. Y. Yoneda of Osaka University) as a template, and the product was ligated to the EcoRV andXhoI sites downstream of ELuc to yield pCMV-ELuc:: importina. All constructs were verified by sequencing.
Cell culture
Mouse NIH3T3 cells (RCB1862) were grown in Dulbecco’s Modified Eagle medium (DMEM, Sigma-Aldrich, St. Louis, MO) supplemented with 10% fetal bovine serum (FBS, ICN Biochemicals, Aurora, OH) in a humidified atmosphere containing 5% CO2 at 37uC. To prepare rat primary astrocytes, cerebral cortices were cut into small pieces, incubated in papain solution at 37uC for 15 min, and then separated by gentle trituration passes. Cells were plated onto a flask and cultured in DMEM supplemented with 10% FBS at 5% CO2for 3–4 h and the cultures were washed with phosphate buffered-saline twice. The dissociated cells were cultured in DMEM supplemented with 10% FBS for over 2 weeks. Confluent cells were harvested and placed in a new flask after a two-fold dilution.
Mice and preparation of SCN slices
The reporter plasmid mBmal1 915-ELuc, which carried the 59
flanking region (2816 to +99 bp) of the mBmal1promoter, was constructed by replacing the NcoI/XbaI fragment of the Bp/915-Luc vector [18] (a kind gift from Dr. M. Ikeda of Saitama Medical University) with ELuc. Transgenic mice were generated on the C57BL/6J background as described elsewhere. Among the 10 transgenic lines obtained, we used the Bmal1ELuc-A4line because it showed the highest light intensity of the various tissues examined. The mice were kept in the heterozygous state and maintained in LD12:12. Six-month-old mice were decapitated and the brain was removed. Coronal sections of the brain (250mm thickness) were prepared using a microslicer (Dosaka, Osaka, Japan) and were transferred to ice-cold Hank’s balanced salt solution supplemented with 10 mM Hepes/NaOH (pH7.0), 1.76 mg/ml NaHCO3, 97 U/ml penicillin, and 100mg/ml streptomycin. Bilateral SCNs connected with optic chiasms were trimmed to approximately 2 mm squares. The procedure was strictly in accordance with the protocols approved by the Institutional Animal Care and Use Committee of the National Institute of Advanced Industrial Science and Technology.
Real-time measurement of bioluminescence using a luminometer
NIH3T3 cells were seeded in 35 mm dishes one day before transfection. One hundred nanograms of mPer2-dELuc or mPer2-dFLuc were cotransfected into NIH3T3 cells with 100 ng of the expression plasmid pCMV-CLuc [29] carrying
secreted luciferase from Cypridina noctiluca (CLuc) and 1mg of pBluescript SK(2). Rat primary astrocytes were cultured and 26106 cells were suspended in 100ml of rat astrocyte Nucleo-factor (Amaxa, Ko¨ln, Germany), which was followed by the cotransfection of 4mg of mPer2-dELuc or mPer2-dFLuc with 1mg of pCMV-CLuc using electroporation and the program T-20 of the Nucleofactor electroporator (Amaxa). Transfected cells were seeded on 35 mm dishes. Transfected NIH3T3 cells and primary astrocytes were cultured for 1–2 days until confluence, and an aliquot of the culture medium containing secreted CLuc was collected. CLuc activity was measured using the CLuc reporter assay system (ATTO, Tokyo, Japan), according to manufacturer’s instructions. Transfected cells were treated with 100 nM dexamethasone (Nacalai Tesque, Kyoto, Japan) for 2 h and the medium was replaced with DMEM without phenol red (Gibco-BRL, Grand Island, NY) supplemented with 10% FBS and 200mM D-luciferin (TOYOBO) and overlaid with mineral oil (Sigma-Aldrich) to prevent evaporation. Bioluminescence was recorded for 1 min at intervals of 19 min under a 5% CO2 atmosphere at 37uC using the dish-type luminometer AB2500 Kronos (ATTO).
CCD imaging of bioluminescence
Transfected NIH3T3 cells or primary astrocytes were grown on 35 mm glass-bottom dishes (Iwaki, Tokyo, Japan) until confluence, and an aliquot of medium was collected to measure CLuc activity. For BLI of subcellular-localized luciferases, 2mg of expression plasmids were cotransfected with 100 ng of pCMV-CLuc into NIH3T3 cells. For imaging of mPer2-driven luciferase luminescence, cells were treated with 100 nM dexamethasone for 2 h before measurement. The culture medium was replaced with DMEM without phenol red and supplemented with 10% FBS, 25 mM Hepes/NaOH (pH7.0), and 200mM D-luciferin, and was overlaid with 2 ml of mineral oil. For imaging of ELuc BLI in SCN slices, the slices were placed on a culture membrane (Millicell-CM, Millipore, Bill-erica, MA) with 1.3 ml of DMEM without phenol red supplemented with 10 mM Hepes/NaOH (pH7.0), B27 supple-ment (Invitrogen), and 200mM D-luciferin, and the dish was sealed with parafilm. BLI was performed using the luminescence microscope CellGraph (ATTO) at 37uC. CCD images were acquired using a 46(NA, 0.5; ATTO) or 406(NA, 0.9; Nikon, Tokyo, Japan) objective lens at 161 binning of the 5126512 pixel array. The luminescence intensity was quantified using Metamorph (Universal Imaging, Brandywine, PA).
Measurement of luciferase activity in cell extracts
NIH3T3 cells were seeded one day before transfection in 24-well plates at a density of 56104 cells per well. One hundred
Spectrum measurement
To measure the bioluminescent spectrum in cell extracts and in live cells, 400 ng or 2mg of expression plasmid was transfected into NIH3T3 cells that were seeded in a 24-well plate or in a 35 mm dish, respectively, and cultured for 2 days. Cells in the 24-well plate were lysed in 200ml of Passive Lysis Buffer and the spectrum was measured by mixing 15ml of Luciferase Assay Reagent II into 15ml of the cell extract. For measurement of the spectrum in live cells, the culture medium of cells grown in a 35 mm dish was replaced with DMEM without phenol red supplemented with 10% FBS and 200mM D-luciferin, and the dish was placed on the sample stage of a spectrophotometer. Spectrum measurement was carried out using an AB-1850 spectrophotometer (ATTO) for 1 min with 1 mm slit width. All spectra were corrected for the spectral sensitivity of the equipment and normalized.
Expression and purification of recombinant luciferase
To generate the plasmids for the expression of the recombinant proteins in Escherihia coli, the FLuc and ELuc cDNAs were subcloned into theXhoI/XbaI andHindIII/XbaI sites, respectively, of the pCold II vector (Takara Bio, Kyoto, Japan), so that the hexahistidine tag was fused in-frame to the N-terminus of the luciferase. The resulting plasmid was transformed intoE. coliBL21 (DE3), and grown in Luria–Bertani medium. Luciferase expression was induced at 15uC for 24 h in the presence of 0.1 mM isopropyl-b-D-thiogalactopyranoside. The harvested cells were resuspended in buffer A (50 mM sodium phosphate (pH 7.0), 300 mM sodium chloride) containing 10 mM imidazole, sonicat-ed, and centrifuged. The histidine-tagged luciferase was then bound to Ni–NTA agarose beads (Qiagen, Valencia, CA), washed twice with buffer A containing 20 mM imidazole, and eluted with buffer A containing 250 mM imidazole. Glycerol was added to the eluates to a final concentration of 8% (w/v). SDS–PAGE was used to confirm the amounts and purity of the recombinant luciferases.
Activity and kinetics measurements of the purified luciferase
The activities and temporal kinetics of the luciferases were measured with an AB-2250 luminometer (ATTO) after 0.1mg of purified luciferase was mixed with 100ml of PicaGene for 60 s. The decay kinetics were measured by mixing 10ml of 0.1mg/ml purified luciferase solution that was diluted in 25 mM Hepes/ NaOH (pH 7.0) with 90ml of luciferin solution containing 0.4 mM D-luciferin potassium salt (TOYOBO), 3 mM ATP disodium salt, and 8 mM magnesium sulfate (Wako) using an auto injector. Luminescence was measured for 20 s at 0.2 s intervals using a microplate-type luminometer (AB2350 Phelios, ATTO). All measurements were made at room temperature.
Immunoblot analysis
NIH3T3 cells were seeded in 6-well plates at a density of 16106 cells per well one day before transfection. Two micrograms of expression plasmid was transfected into cells, incubated for 2 days, and the cells were then lysed using the M-PER extraction reagent (Pierce Biotechnology, Rockford, IL). SDS-urea-PAGE and blotting were carried out as described previously [30]. We used mouse anti-Flag M2 (Sigma-Aldrich) and mouse anti-a-tubulin (Sigma-Aldrich) as primary antibodies. The rabbit anti-ELuc polyclonal antibody was raised against purified recombinant ELuc. We used horseradish peroxidase-conjugated anti-mouse IgG (BioRad, Hercules, CA) and anti-rabbit IgG (Jackson Immmu-noResearch, West Grove, PA) as secondary antibodies. Antibodies
were diluted in Can Get Signal solution (TOYOBO). Immunor-eacted bands were detected using the ECL plus kit (GE Healthcare, Freiburg, Germany) according to the manufacturer’s instructions.
Measurement of the stability of luciferases in NIH3T3 cells
To estimate the functional half-life of ELuc and FLuc in NIH3T3 cells, we used destabilized luciferases (dELuc and dFLuc) fused to the PEST element, as we could not precisely estimate the half-life of ELuc (.8 h) because of its high stability in cells (data not shown). Stability measurement was performed as described previously [31]. One hundred nanograms of the expression plasmids pSV40-dELuc and pSV40-dFLuc were independently transfected into NIH3T3 cells seeded in 48-well plates. One day after transfection, the culture medium was replaced with DMEM supplemented with 10% FBS and 100mM cycloheximide and incubated for 20 min, to block protein synthesis. After 20 min (time = 0), the incubation was continued in the same medium. At the indicated times, cells were lysed with 200ml of the Passive Lysis Buffer and luciferase activity was measured by mixing 20ml of the cell lysate with 20ml of the Luciferase Assay Reagent II and using an AB-2250 luminometer.
Confocal fluorescence imaging
NIH3T3 cells seeded in 35 mm glass-bottom dishes were cotransfected with 2mg of pCMV-Flag::ELuc(pox) and 0.5mg of pCMV-EGFP(pox) or 2mg of pCMV-Myc::ELuc(nuc) and 0.5mg of pAcGFP1-Nuc (Clontech). One day after transfection, cells were fixed with 4% (w/v) paraformaldehyde and treated with 0.3% (w/v) TritonX-100. Cells were then incubated with anti-Flag M2 or anti-Myc (9E10, Santa Cruz Biotechnology, Santa Cruz, CA) antibodies and stained with Cy5-conjugated anti-mouse IgG (Santa Cruz). ELuc and GFP were visualized using laser confocal microscopy (BioRad).
Supporting Information
Figure S1 Nucleotide sequences of P. termitilluminans wild-type luciferase and ELuc. cDNA sequences of wild-type luciferase and sequence-optimized luciferase, ELuc, are shown in the upper and lower rows, respectively. Identical sites are marked by asterisks. Found at: doi:10.1371/journal.pone.0010011.s001 (1.19 MB TIF)
Figure S2 Improvement of the expression and light intensity of ELuc in NIH3T3 cells. (A) Western blot analysis of the expression of wild-type luciferase and ELuc in NIH3T3 cells. NIH3T3 cells were transfected with expression plasmid carrying wild-type luciferase (pCMV-Flag::PTLuc) or sequence-optimized luciferase, ELuc (pCMV-Flag::ELuc) and cells were harvested and disrupted 48 h later. Both luciferases were detected using the anti-Flag M2 antibody. Tubulin was used as an internal control. The positions of molecular weight markers are indicated on the left margin of each panel. (B) Luminescence intensity of wild-type luciferase- and ELuc-expressing cell extracts. One hundred nanograms of the expression plasmids pCMV-Flag::PTLuc or pCMV-Flag::ELuc was cotransfected with 10 ng of phRL-TK into NIH3T3 cells. One day after transfection, cells were disrupted using 10 mM Tris/HCl (pH 7.4). The luminescent activities of wild-type luciferase and ELuc were measured and normalized to Renilla luciferase activity. The light intensity of normalized wild-type luciferase was set to 1. Error bars indicate the standard deviation (n = 6).
Figure S3 Comparison of the kinetics and light output from purified FLuc and ELuc. (A) Representative kinetics of light output from purified FLuc (orange line) and ELuc (green line). The kinetics was measured for 60 s by mixing purified protein (0.1 IˆJg) and PicaGene as a substrate. (B) Luminescence intensity of FLuc and ELuc. Signals were accumulated for 60 s, as shown in (A), and normalized to IˆJg of protein. Error bars indicate
standard deviation (n = 6).
Found at: doi:10.1371/journal.pone.0010011.s003 (0.66 MB TIF)
Figure S4 Real-time monitoring and single-cell imaging of mPer2 promoter-driven transcriptional oscillation in rat primary astrocytes. (A) Photomultiplier recording of mPer2 transcriptional oscillation in primary astrocytes expressing ELuc (green filled circles) and FLuc (orange filled circles). The reporter plasmids mPer2-dELuc or mPer2-dFLuc were cotransfected with pCMV-CLuc and cells were stimulated with 100 nM of dexamethasone. Bioluminescence was counted for 1 min at intervals of 19 min using luminometer (Kronos), and the respective luciferase activities were normalized to CLuc activity. The inset shows recordings where the peak values of the curves were set to 1. (B) Representative CCD image of mPer2 promoter-driven ELuc luminescence in primary astrocytes (scale bar, 100 IˆJm). We quantified 40 individual cells (yellow squares). (C) Recordings of luminescence from the 40 individual cells shown in B.
Found at: doi:10.1371/journal.pone.0010011.s004 (1.89 MB TIF)
Figure S5 Time-lapse BLI of mBmal1 promoter-driven tran-scriptional oscillation in an SCN slice of Bmal1-ELuc transgenic mice. (A) Representative CCD image of mBma1 promoter-driven ELuc luminescence from SCN (scale bar, 100 IˆJm). We quantified 44 individual cells (yellow circles). (B) Serial CCD images of the SCN slice. Numbers indicate hours. (C) Recordings of luminescence from the 44 individual cells shown in A. Found at: doi:10.1371/journal.pone.0010011.s005 (1.77 MB TIF)
Figure S6 Confocal micrographs of peroxisome- and nuclear-localized ELuc in NIH3T3 cells. pCMV-Flag::ELuc(pox) and pCMV-EGFP(pox) or pCMV-Myc::ELuc(nuc) and pAcGFP1-Nuc were cotransfected into NIH3T3 cells. Twenty-four hours after transfection, cells were fixed and peroxisome-localized ELuc and nuclear-localized ELuc were detected using the anti-Flag M2 and anti-Myc antibodies, respectively.
Found at: doi:10.1371/journal.pone.0010011.s006 (1.80 MB TIF)
Figure S7 Effects of increasing concentration of D-luciferin on the light output from FLuc- and ELuc-expressing live cells and luminescence CCD images of cytsol-targeted FLuc at higher D-luciferin concentration. (A) Relationships between the concentra-tion of D-luciferin and peak intensities of FLuc-expressing (orange filled circles) and ELuc-expressing (green filled circles) NIH3T3 cells. Two micrograms of expression plasmid pCMV-Flag::FLuc or pCMV-Flag::ELuc(cyto) was transfected into NIH3T3 cells. One day after transfection, bioluminescence was measured using
luminometer (Kronos), in real-time at various D-luciferin concen-trations. Peak intensities at each luciferin concentration, as obtained by real-time measurement, are plotted in the figure. The inset shows the D-luciferin dose dependencies of FLuc and ELuc luminescence where the counts at 2000 IˆJM was set to 1. (B) Luminescence images of the cytosol-localized FLuc in NIH3T3 cells captured at 2000 IˆJM D-luciferin. NIH3T3 cells were transiently transfected with pCMV-Flag::FLuc(pox). Images were acquired when the signals reached the maximum, using a 3 min exposure time and 406objective lens without binning.
Found at: doi:10.1371/journal.pone.0010011.s007 (1.31 MB TIF)
Figure S8 Western blot analysis of the ELuc::importina fusion protein in NIH3T3 cells. NIH3T3 cells transfected with pCMV-ELuc::importin a were harvested and disrupted 48 h after transfection. The ELuc::importin Iˆ6fusion protein was detected using an anti-ELuc antibody. Tubulin was used as an internal control. The positions of molecular weight markers are indicated on the left margin of each panel.
Found at: doi:10.1371/journal.pone.0010011.s008 (0.82 MB TIF)
Movie S1 Time-lapse BLI of mPer2 promoter-driven ELuc luminescence from the rat astrocytes shown in Figure 2A and Figure S4. CCD images were acquired using 9 min of exposure time at 10 min intervals for 96 h with a 46objective lens.
Found at: doi:10.1371/journal.pone.0010011.s009 (2.59 MB AVI)
Movie S2 Time-lapse BLI of mBmal1 promoter-driven ELuc luminescence from the SCN slice of Bmal1-ELuc transgenic mice shown in Figure 2B and Figure S5. CCD images were acquired using 10 min of exposure time at 15 min intervals for 120 h with a 46objective lens.
Found at: doi:10.1371/journal.pone.0010011.s010 (4.20 MB AVI)
Movie S3 Time-lapse intracellular BLI of the nucleocytoplasmic shuttling of ELuc::importina in the NIH3T3 cells shown in Figure 4. CCD images were acquired using 3 min of exposure time at 4 min intervals for 112 min with a 406objective lens.
Found at: doi:10.1371/journal.pone.0010011.s011 (0.28 MB AVI)
Acknowledgments
We thank Dr. M. Ikeda of Saitama Medical University for providing the
mBmal1promoter, Dr. Y. Yoneda of Osaka University for providing the importinacDNA, Dr. M. Yamamoto for for construction of the transgenic mice and H. Enomoto and H. Kubota of ATTO Co. for performing measurements during luminescence imaging. We also thank S. Kumata of AIST for excellent technical assistance.
Author Contributions
Conceived and designed the experiments: YN YO. Performed the experiments: YN TN HH KN. Analyzed the data: YN. Contributed reagents/materials/analysis tools: YN TY SN VRV. Wrote the paper: YN.
References
1. Wilson T, Hastings JW (1998) Bioluminescence. Annu Rev Cell Dev Biol 14: 197–230.
2. Greer LF, Szalay AA (2002) Imaging of light emission from the expression of luciferases in living cells and organisms: a review. Luminescence 17: 43–74. 3. Welsh DK, Kay SA (2005) Bioluminescence imaging in living organisms. Curr
Opin Biotechnol 16: 73–78.
4. Roda A, Guardigli M, Michelini E, Mirasoli M (2009) Bioluminescence in analytical chemistry and in vivo imaging. Trends Anal Chem 28: 307–322. 5. Viviani VR, Silva AC, Perez GL, Santelli RV, Bechara EJ, et al. (1999) Cloning
and molecular characterization of the cDNA for the Brazilian larval click-beetle Pyrearinus termitilluminans luciferase. Photochem Photobiol 70: 254–260. 6. Silva Neto AJ, Scorsato V, Arnoldi FGC, Viviani VR (2009) Pyrearinus
termitilluminans larval click beetle luciferase: active site properties, structure and
function relationships and comparison with other beetle luciferases. Photochem Photobiol Sci 8: 1748–1754.
7. Seliger HH, Buck B, Fastie WG, McElroy WD (1964) The spectral distribution of firefly light. J Gen Physiol 48: 95–104.
8. Baggett B, Roy R, Momen S, Morgan S, Tisi L, et al. (2004) Thermostability of firefly luciferases affects efficiency of detection by in vivo bioluminescence. Mol Imaging 3: 324–332.
9. Zhao H, Timothy CD, Coquoz O, Kalish F, Rice BW, et al. (2005) Emission spectra of bioluminescent reporters and interaction with mammalian tissue determine the sensitivity of detection in vivo. J Biomed Optics 10: 041210. 10. Shimomura O (2006) The firefly and luminous insects. In: Shimomura O, ed.
11. Ando Y, Niwa K, Yamada N, Enomoto T, Irie T, et al. (2007) Firefly bioluminescence quantum yield and colour change by pH-sensitive green emission. Nat Photonics 2: 44–47.
12. Nakajima Y, Ikeda M, Kimura T, Honma S, Ohmiya Y, et al. (2004) Bidirectional role of orphan nuclear receptor RORain clock gene transcriptions demonstrated by a novel reporter assay system. FEBS Lett 565: 122–126. 13. Nakajima Y, Kimura T, Sugata K, Enomoto T, Asakawa A, et al. (2005)
Multicolor luciferase assay system: one-step monitoring of multiple gene expressions with a single substrate. Biotechniques 38: 891–894.
14. Noguchi T, Ikeda M, Ohmiya Y, Nakajima Y (2008) Simultaneous monitoring of independent gene expression patterns in two types of cocultured fibroblasts with different color-emitting luciferases. BMC Biotechnol 8: 40.
15. Airth RL, Rhodes WC, McElroy WD (1958) The functioning of coenzyme A in luminescence. Biochim Biophys Acta 27: 519–532.
16. Fontes R, Dukhovich A, Sillero A, Gu¨nther Sillero MA (1997) Synthesis of dehydroluciferin by firefly luciferase: Effect of dehydroluciferin, coenzyme A and nucleoside triphosphates on the luminescent reaction. Biochem Biophys Res Commun 237: 445–450.
17. Welsh DK, Imaizumi T, Kay SA (2005) Real-time reporting of circadian-regulated gene expression by luciferase imaging in plants and mammalian cells. Methods Enzymol 393: 269–288.
18. Yu W, Nomura M, Ikeda M (2002) Interactivating feedback loops within the mammalian clock: BMAL1 is negatively autoregulated and upregulated by CRY1, CRY2 and PER2. Biochem Biophys Res Commun 290: 933–941. 19. Yamaguchi S, Isejima H, Matsuo T, Okura R, Yagita K, et al. (2003)
Synchronization of cellular clocks in the suprachiasmatic nucleus. Science 302: 1408–1412.
20. Inagaki N, Honma S, Ono D, Tanahashi Y, Honma K (2007) Separate oscillating cell groups in mouse suprachiasmatic nucleus couple photoperiodi-cally to the onset and end of daily activity. Proc Natl Acad Sci USA 104: 7664–7669.
21. Liu AC, Welsh DK, Ko CH, Tran HG, Zhang EE, et al. (2007) Intercellular coupling confers robustness against mutations in the SCN circadian clock network. Cell 129: 605–616.
22. Widder EA, Case JF (1982) Distribution of sub-cellular bioluminescent sources in a dinoflagellate,Pyrocystis fusiformis. Biol Bull 162: 423–448.
23. Gould SJ, Keller GA, Hosken N, Wilkinson J, Subramani S (1989) A conserved tripeptide sorts proteins to peroxisomes. J Cell Biol 108: 1657–1664. 24. Hageman J, Vos MJ, van Waarde MA, Kampinga HH (2007) Comparison of
intra-organellar chaperone capacity for dealing with stress-induced protein unfolding. J Biol Chem 282: 34334–34345.
25. Imamoto N, Shimamoto T, Takao T, Tachibana T, Kose S, et al. (1995) In vivo evidence for involvement of a 58 kDa component of nuclear pore-targeting complex in nuclear protein import. EMBO J 14: 3617–3626.
26. Goldfarb DS, Corbett AH, Mason DA, Harreman MT, Adam SA (2007) Importina: a multipurpose nuclear-transport receptor. Trends Cell Biol 14: 505–514.
27. Miyamoto Y, Saiwaki T, Yamashita J, Yasuda Y, Kotera I, et al. (2004) J Cell Biol 165: 617–623.
28. Viviani VR, Uchida A, Suenaga N, Ryufuku M, Ohmiya Y (2001) Thr226 is a key residue for bioluminescence spectra determination in beetle luciferases. Biochem Biophys Res Commun 280: 1286–1291.
29. Nakajima Y, Kobayashi K, Yamagishi K, Enomoto T, Ohmiya Y (2004) cDNA Cloning and characterization of a secreted luciferase from the luminous Japanese ostracod, Cypridina noctiluca. Biosci Biotechnol Biochem 68: 565–570.
30. Nakajima Y, Yoshida S, Inoue Y, Ono T (1996) Occupation of the QB-binding pocket by a photosystem two inhibitor triggers dark cleavage of the D1 protein subjected to brief preillumination. J Biol Chem 271: 17383–17389.