Modis time series for irrigated-area mapping in hydrographic
basins of the Brazilian Northeastern region
Andre Keiiti Ide(1) and Gustavo Macedo de Mello Baptista(2)
(1)Ministério da Integração Nacional, Secretaria de Infraestrutura Hídrica, Esplanada dos Ministérios, Bloco E, CEP 70067-901 Brasília, DF, Brazil. E-mail: [email protected] (2)Universidade de Brasília, Instituto de Geociências, Campus Darcy Ribeiro, Asa Norte, CEP 70910-900 Brasília, DF, Brazil. E-mail: [email protected]
Abstract – The objective of this work was to evaluate the applicability of time series of the enhanced vegetation index (EVI), from the moderate resolution imaging spectroradiometer (Modis), in the mapping of irrigated areas in the Northeastern region of Brazil. Annual time series from 2006 to 2015 were classified with the iterative self-organizing data analysis technique (Isodata) algorithm, generating a binary map of irrigated and nonirrigated areas for each year. In the Sertão region, the classification showed an average kappa coefficient of 0.66, underestimating the irrigated area by 7.6%, compared with data of the 2006 agricultural census. In regions more humid than the Sertão, such as Agreste and Zona da Mata Nordestina, the methodology showed limitations to distinguish irrigated areas from natural vegetation, presenting average kappa coefficients of 0.26 and 0.00, respectively. The EVI time series from Modis are applicable for the mapping of irrigated areas in the Sertão of the Northeastern region of Brazil.
Index terms: agricultural and environmental planning, EVI, remote sensing, semiarid, vegetation index, water resources management.
Séries temporais do sensor Modis para mapeamento de áreas
irrigadas em bacias hidrográficas do Nordeste brasileiro
Resumo – O objetivo deste trabalho foi avaliar a aplicabilidade do uso de séries temporais do índice de vegetação realçado (EVI), do sensor “moderate resolution imaging spectroradiometer” (Modis), no mapeamento de áreas irrigadas em bacias hidrográficas da região Nordeste. As séries temporais anuais, do período de 2006 a 2015, foram classificadas pelo algoritmo “iterative self-organizing data analysis technique” (Isodata), tendo-se gerado um mapa binário de áreas irrigadas e não irrigadas para cada ano. Na região do Sertão, a classificação apresentou coeficiente de concordância Kappa médio de 0,66, tendo subestimado a área irrigada em 7,6%, em comparação aos dados do censo agropecuário de 2006. Para regiões mais úmidas que o Sertão, como as do Agreste e da Zona da Mata Nordestina, a metodologia apresentou limitações em distinguir áreas irrigadas de vegetação natural, tendo apresentado coeficiente Kappa médio de 0,26 e 0,00, respectivamente. As séries temporais de EVI do sensor Modis são aplicáveis ao mapeamento de áreas irrigadas no Sertão Nordestino.
Termos para indexação: planejamento agrícola e ambiental, EVI, sensoriamento remoto, semiárido, índice de vegetação, gestão de recursos hídricos.
Introduction
The monitoring of irrigated agriculture, including information on its spatial and temporal distribution, is essential for the management of water resources, hydrological watershed modeling, and agricultural and environmental planning (Biggs et al., 2006; Ozdogan et al., 2010).
Usually, quantitative information about irrigated areas is derived from census data based on which it is impossible to depict the interannual dynamics of these areas (Dheeravath et al., 2010). However, alternative
irrigated areas based on remote sensing images either adopted methodologies applicable only at local or microregion scales (Sá et al., 2007; Silva et al., 2014) or were also restricted to mapping areas irrigated by the central pivot system (Guimarães & Landau, 2015). Therefore, researches aiming to develop and evaluate methodologies that are applicable to irrigated-area mapping at a regional scale and that are not limited to the mapping of central pivots are necessary in Brazil.
Mapping of irrigated areas using remote sensing data is complex because it also includes land use, not only land cover (Ozdogan et al., 2010). In addition, it is
an activity that requires specific knowledge about area
management and where and when farmers apply water
to crops. Due to these difficulties, irrigated areas are
often treated only as a class in most land use and land cover-mapping studies, not as their focus (Dheeravath et al., 2010).
Other difficulties associated with irrigated areas
are: separation of irrigated crops from rainfed crops in wetlands; presence of clouds; and frequency of images due to the high temporal dynamics of agricultural areas (Ozdogan et al., 2010). Therefore, for an adequate
quantification of the entire irrigated area over a year
or season, images from consecutive dates are required (Alexandridis et al., 2008; Gumma et al., 2011b).
The use of vegetation index time series derived from sensors with high temporal resolution has been shown to be a successful alternative for irrigated-area mapping in India, Afghanistan, Ghana, and the United States (Biggs et al., 2006; Ozdogan & Gutman, 2008; Dheeravath et al., 2010; Gumma et al., 2011a; Pervez et al., 2014).
The use of vegetation index time series from the moderate resolution imaging spectroradiometer (Modis) sensor aboard the Terra and Aqua satellites is emphasized, which has great potential for agricultural-area mapping on a regional scale because of the high temporal resolution (1 to 2 days) and free availability of long historical series (Pervez et al., 2014).
From the vegetation indices available from Modis preprocessed products, the enhanced vegetation index (EVI) is used. It was originally developed by Huete et al. (2002) and later adapted by Jiang et al. (2008) as EVI2 for use for data that does not include the blue band. This index was developed to be applied to Modis sensor data, as an alternative to minimize several normalized difference vegetation index (NDVI)
limitations such as the saturation issue for high leaf area index vegetation and the effects of the canopy substrate and atmosphere (Huete et al., 2002).
The EVI calculated from Modis surface reflectance
images is provided in the MOD13Q1 product as a composition of the best pixels over a period of 16 days, thus reducing the probability of using pixels affected by the presence of clouds (Pervez et al., 2014).
Although the EVI included in MOD13Q1 is calculated from atmospherically-corrected surface
reflectance data, the historical series present noise
due to atmospheric disturbances and imperfections of the sensor calibration (Pervez et al., 2014). Therefore, before its use, it is recommended to minimize the noise
using smoothing filters such as those implemented in
the Timesat software developed by Jönsson & Eklundh (2002).
An important aspect of land use and land cover mapping is the occurrence of great heterogeneity at the subpixel scale when using images from sensors with medium spatial resolution. The EVI images of Modis MOD13Q1 are available at 250 m spatial resolution; each pixel covers an area of 6.25 ha. Therefore, it is natural that a certain fraction of a pixel that has been
classified as “irrigated area” includes other land uses
and covers, such as natural vegetation, roads, and buildings. This way, to avoid an overestimation of the irrigated area, it is essential to estimate the fraction of the irrigated subpixel area (Thenkabail et al., 2007).
In the Northeastern region of Brazil, most of the irrigated areas are concentrated in public irrigation districts and along the margins of the main water stream and reservoirs. The sprinkler irrigation method is predominant in 62% of the irrigated area, followed by surface and localized irrigation methods, representing 18 and 11% of the total, respectively, according to
Instituto Brasileiro de Geografia e Estatística (IBGE,
2006). Fruit crops play an important role in irrigated agriculture in the region and, along with irrigated annual crops, such as bean, onion, and rice, represent an important economic activity that generates income and jobs.
Materials and Methods
In this study, the agricultural area with partial or total application of water to the soil to meet the water demand of the crop was considered an irrigated area. Areas that are cultivated with more than one crop throughout the year were considered only once.
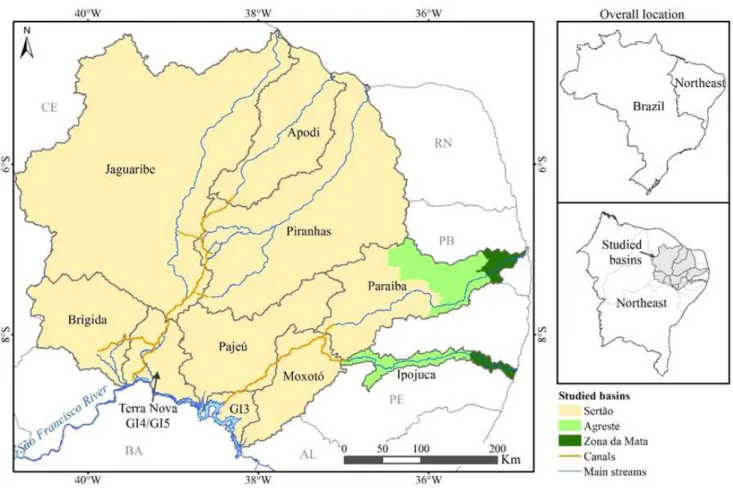
The study area is located in the Northeastern region of Brazil (4º18'0"S–9º24'0"S, 34º42'0"W–41º00'0"W), covering the entire territory of the Jaguaribe, Apodi, Piranhas, Paraíba, Ipojuca, Moxotó, Pajeú, Terra Nova, and Brígida river basins and the São Francisco River subbasin. These basins are associated with the São Francisco River integration project (transposition) and receive water from the northern and eastern
canal systems (Figure 1). According to Köppen’s classification, the predominant climates in the region
are BSh, semiarid, and As, tropical with dry summer (Alvares, 2013). The average rainfall in this region is 750 mm; however, it can vary between 500 and 2,000 mm depending on the site. Precipitation is concentrated in the period from January to July, presenting an irregular distribution and great interannual variability (Montenegro et al., 2010; Marengo & Bernasconi, 2015).
For this study, the EVI data at 250 m spatial resolution, included in MOD13Q1 collection 5 of the Modis sensor, was obtained from the United States Geological Survey database. To cover the entire study area, h13v09 and h14v09 tiles were obtained, from January 2006 to December 2015, totaling 460 images. The data originally recorded using sinusoidal projection in the hierarchical data format (HDF) were mosaicked, resized to the study area, and reprojected
on the geographical coordinate system using the Modis reprojection tool (MRT) algorithm.
To minimize the effects of noise, the time series was smoothed by adjustment to the double logistic function using Timesat (Jönsson & Eklundh, 2002). The smoothing of Modis sensor time series using this technique was evaluated by Borges et al. (2014); the authors reported good performance for vegetation analysis purposes in the Cerrado biome. This technique
was applied for this reason and because no specific
study results were found regarding the performance of vegetation index time series smoothing techniques for agricultural-area mapping in the studied region. The parameters used for the adjustment to the double logistic function were: time series = 10 years; 23 images per year; amplitude limit (cutoff) = 0; spike method = 3; adaptation = 3; and number of iterations = 1 (Figure 2).
The smoothed time series were subdivided into annual periods, containing 23 images for each year, from 2006 to 2015. Each of these time series was
classified using the iterative self-organizing data
analysis technique (Isodata) algorithm implemented in the environment for visualizing images (ENVI) software, version 5.1 (Harris Geospatial Solutions,
Broomfield, CO, USA). Therefore, 40 classes were
generated, with a maximum of 15 iterations and a convergence threshold of 5%.
Areas covered with permanently green natural vegetation, independently of the season, especially those located on top of mountains and plateaus, which
can be confused with irrigated areas, were identified
using existing vegetation maps, digital elevation models, and Landsat images and were later excluded
from the classification process through a mask (Biggs
et al., 2006).
After classification, classes corresponding to irrigated areas were identified based on visual
inspection at control points located in the main public irrigation districts of the region, supported by visual interpretation of images with higher spatial resolution. Landsat thematic mapper (TM) and operational land imager (OLI) images were used for the years 2006 to 2011 and 2013 to 2015, respectively; due to the absence of Landsat images, LISS3 sensor images from the Resourcesat satellite were used for 2012.
The irrigated area, calculated based on Modis
image classification, was multiplied with an irrigated
area fraction according to the following equation: Al = f × Amodis, where Al is the net irrigated area; f is the irrigated area fraction; and Amodis is the irrigated
area calculated based on classified Modis images.
To calculate the irrigated area fraction (f), a total of 20 windows (10x10 km) were generated in areas
already classified as irrigated. Within these windows,
images with higher spatial resolution (Landsat and
Resourcesat) were classified for each year. The irrigated area in each window, calculated from the classified
images with the highest spatial resolution, was divided
by the irrigated area calculated based on the classified
Modis image. A f-value was obtained for each year (Biggs et al., 2006) using the following equation:
f
Ah
N i N
= ∑=1
Amodis ,
where Ah is the irrigated area calculated from classified
images with higher spatial resolution (Landsat and Resourcesat); N is the number of 10x10 km windows; and i is the i-th window.
For the evaluation of classification accuracies, a
confusion matrix was constructed for each studied year, considering “irrigated” and “nonirrigated” classes,
followed by overall accuracy index, kappa coefficient,
and omission and commission error calculations. The
stratified sampling scheme was adopted; 50% of the
pixels were sampled from the irrigated class and 50% were sampled from the nonirrigated class. The sample size was 288 pixels for each year, calculated according to the binomial distribution equation, adopting a 95%
confidence interval, 75% overall accuracy, and 5%
permissible sampling error (Costa & Brites, 2004). The results of the visual interpretation of Landsat or Resourcesat images were used as reference for each sampled pixel. In cases where only a fraction of the sampled pixel includes an irrigated area, the pixel was
considered as “irrigated”. Figure 3 shows the flow
chart of the applied methodology.
Results and Discussion
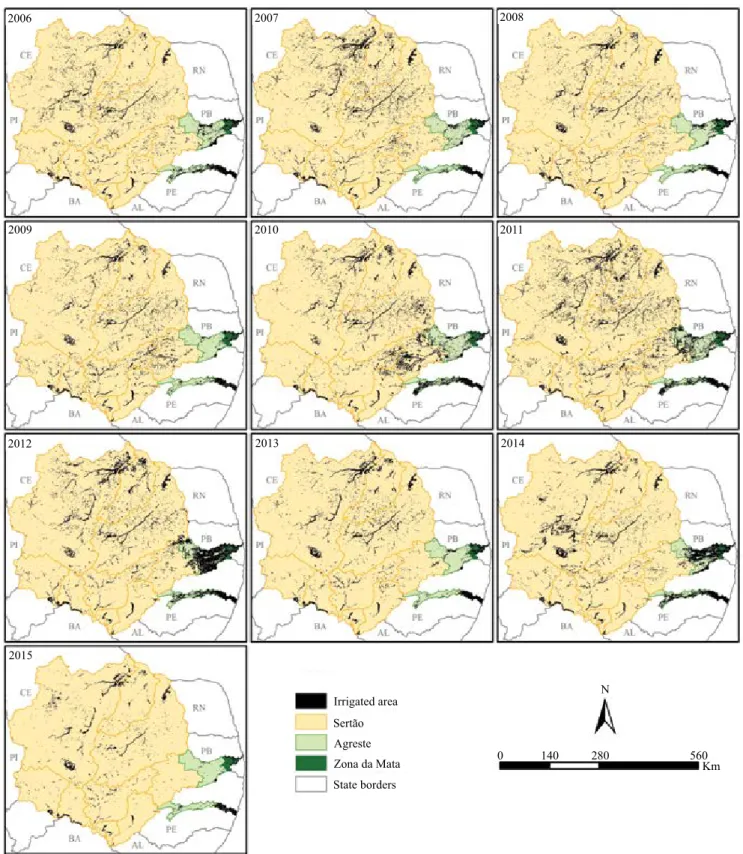
The time series classification resulted in a binary
map for each studied year, indicating the location and spatial distribution of the irrigated areas (Figure 4). In addition to the irrigated areas that were concentrated in public irrigation districts, several small, irrigated
areas distributed along the rivers were identified. As
an exception to this pattern, groundwater-irrigated areas composed of small and spatially dispersed plots
were detected in the west of the state of Rio Grande do Norte.
Significant variations were observed in part of
the irrigated area over the years, especially in small, dispersed areas (Figure 4). These interannual spatial variations are mainly due to mapping errors. The Agreste and Zona da Mata regions showed a greater interannual variability due to the higher levels of mapping errors associated with these regions.
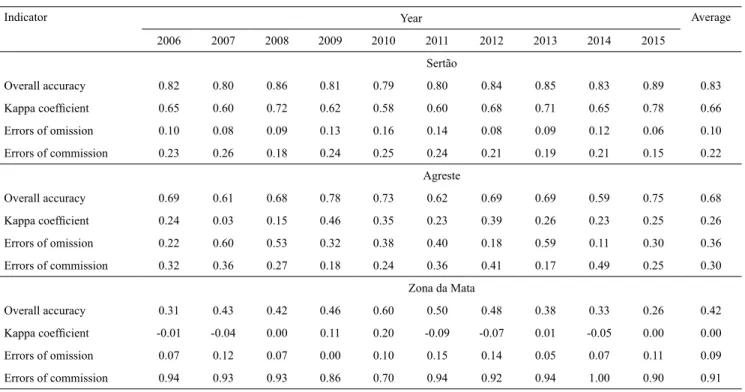
The applied methodology allowed the distinction between irrigated and nonirrigated areas in the Sertão region, resulting in maps with a global accuracy
varying from 0.79 to 0.89 and a kappa coefficient
ranging from 0.58 to 0.78 (Table 1). According to the
classification proposed by Landis & Koch (1977), a kappa coefficient between 0.41 and 0.60 indicates
moderate agreement between the generated data, and reference and values between 0.61 and 0.80 imply a substantial agreement.
For the wetter portions of the study area, such as the Agreste and Zona da Mata regions, the adopted methodology was ineffective in distinguishing irrigated agriculture from other land uses and land covers. The
kappa coefficient ranged from 0.03 to 0.46 in the
Agreste region and from -0.09 to 0.20 in the Zona da
Figure 3. Methodology flow chart applied to irrigated-area mapping using time series of the enhanced vegetation index
Mata region. Due to the well-distributed, high amount of precipitation in these regions, the natural vegetation
that was not excluded from the classification by the
mask process, and even nonirrigated agricultural areas,
presented EVI temporal curves with some degree of similarity with those of irrigated areas. Therefore,
the applied classification was not able to distinguish
irrigated areas from other vegetation.
The difficulty in mapping irrigated areas in wetlands
based on remote sensing images has been often reported in the literature (Ozdogan et al., 2010; Zhu et al., 2014); and there is no proven methodology that can be applied to any agricultural and climatic conditions.
To minimize the problem arising from differences in precipitation regimes, some authors propose the segmentation of the study area into climatically similar regions. Dheeravath et al. (2010) mapped irrigated areas in India at a national scale and subdivided the territory into six climatically similar zones, separately classifying NDVI time series for each of these regions. This is an alternative that should applied to irrigated-area mapping in the Northeastern region in the future, which is characterized by varied climatic conditions.
To improve the classification of irrigated areas in the
Agreste and Zona da Mata regions, other methodologies
could be tested, such as the incorporation of other
wavelength bands in the classification processes, and
other data could be used, such as precipitation and census data (Ozdogan & Gutman, 2008; Dheeravath
et al., 2010; Zhu et al., 2014). Other classification
algorithms can also be evaluated, such as decision trees and spectral matching techniques (Thenkabail et al., 2007; Pervez et al., 2014). Warren et al. (2014) also pointed out the possibility of identifying irrigated
areas based on a simplified water balance derived from
remote sensing data, in which the areas with a higher evapotranspiration output than precipitation input are considered irrigated.
In most cases, the commission errors (nonirrigated
areas classified as irrigated) were greater than the
omission errors. This is mainly due to the existence of natural vegetation areas and nonirrigated agricultural areas that present EVI temporal curves with a greater similarity to those of irrigated areas, which were
erroneously classified as irrigated. Although most of
the areas covered by well-preserved natural vegetation, especially those located on top of mountains and
Table 1. Overall accuracy, kappa coefficient, and errors of omission and commission of the irrigated area using enhanced
vegetation index (EVI) time series from the moderate resolution imaging spectroradiometer (Modis) sensor in the Northeastern region of Brazil.
Indicator Year Average
2006 2007 2008 2009 2010 2011 2012 2013 2014 2015 Sertão
Overall accuracy 0.82 0.80 0.86 0.81 0.79 0.80 0.84 0.85 0.83 0.89 0.83
Kappa coefficient 0.65 0.60 0.72 0.62 0.58 0.60 0.68 0.71 0.65 0.78 0.66
Errors of omission 0.10 0.08 0.09 0.13 0.16 0.14 0.08 0.09 0.12 0.06 0.10 Errors of commission 0.23 0.26 0.18 0.24 0.25 0.24 0.21 0.19 0.21 0.15 0.22
Agreste
Overall accuracy 0.69 0.61 0.68 0.78 0.73 0.62 0.69 0.69 0.59 0.75 0.68
Kappa coefficient 0.24 0.03 0.15 0.46 0.35 0.23 0.39 0.26 0.23 0.25 0.26
Errors of omission 0.22 0.60 0.53 0.32 0.38 0.40 0.18 0.59 0.11 0.30 0.36
Errors of commission 0.32 0.36 0.27 0.18 0.24 0.36 0.41 0.17 0.49 0.25 0.30 Zona da Mata
Overall accuracy 0.31 0.43 0.42 0.46 0.60 0.50 0.48 0.38 0.33 0.26 0.42
Kappa coefficient -0.01 -0.04 0.00 0.11 0.20 -0.09 -0.07 0.01 -0.05 0.00 0.00
plateaus, were masked and excluded from the
classification, some areas still involved commission
errors. Most of these areas are located in the rainier portions of the study area such as the Chapada do Araripe, Agreste, and Zona da Mata regions and at the northern coast of the states of Rio Grande do Norte and Ceará. In future studies, the improvement of masking based on more accurate vegetation surveys or even a preliminary survey of agricultural areas might contribute to the reduction of commission errors.
Spatially concentrated irrigated areas, such as those occurring in public irrigation districts and at
the watercourse margins, were more easily identified. The identification of small and fragmented irrigated
areas, especially of those in heterogeneous landscapes,
proved to be more challenging. This difficulty was
expected; according to Velpuri et al. (2009), this is due to the low spatial resolution of the used images. For a more accurate mapping of these small areas, it would be necessary to use images with higher spatial resolution. However, the use of images with
high spatial resolution for the mapping of irrigated areas at a regional scale is limited because of the low availability of cloud-free images, which implies
difficulties in capturing all temporal dynamics typical
for annual irrigated crops. Alternatively, Gumma et al. (2011a) proposed a methodology based on 30-m Landsat images in fusion with Modis time series for the mapping of small irrigated areas in Ghana; the authors obtained satisfactory results: accuracy from 67 to 93%.
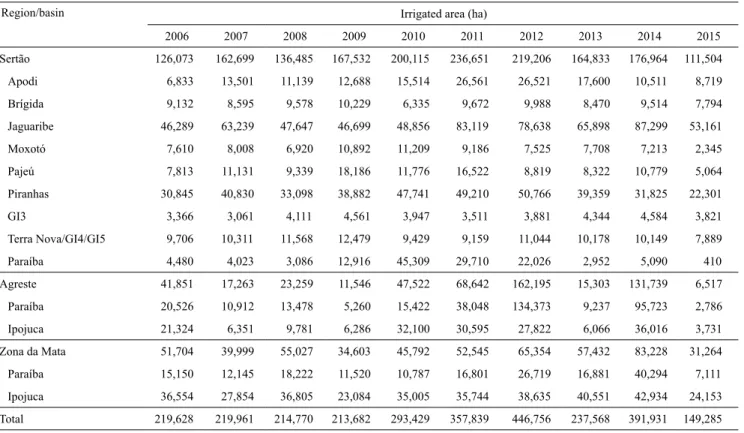
Table 2 presents the irrigated area, calculated for each year, in the studied basins and regions. The irrigated area greatly varies over the years, especially in the Agreste region. These variations are partly due to mapping errors. For the year 2015, a consistent
reduction in the irrigated area was identified in
relation to the period average. It can be inferred that this reduction is mainly due to errors in the mapping and also to the reduction in the water supply of the region. Starting in 2013, attributed adopted emergency regulatory actions due to the low water availability in
Table 2. Irrigated area in each studied region and basin, from 2006 to 2015, obtained with moderate resolution imaging spectroradiometer (Modis) sensor-enhanced vegetation index (EVI) time series classification.
Region/basin Irrigated area (ha)
2006 2007 2008 2009 2010 2011 2012 2013 2014 2015 Sertão 126,073 162,699 136,485 167,532 200,115 236,651 219,206 164,833 176,964 111,504
Apodi 6,833 13,501 11,139 12,688 15,514 26,561 26,521 17,600 10,511 8,719 Brígida 9,132 8,595 9,578 10,229 6,335 9,672 9,988 8,470 9,514 7,794
Jaguaribe 46,289 63,239 47,647 46,699 48,856 83,119 78,638 65,898 87,299 53,161 Moxotó 7,610 8,008 6,920 10,892 11,209 9,186 7,525 7,708 7,213 2,345
Pajeú 7,813 11,131 9,339 18,186 11,776 16,522 8,819 8,322 10,779 5,064 Piranhas 30,845 40,830 33,098 38,882 47,741 49,210 50,766 39,359 31,825 22,301
GI3 3,366 3,061 4,111 4,561 3,947 3,511 3,881 4,344 4,584 3,821 Terra Nova/GI4/GI5 9,706 10,311 11,568 12,479 9,429 9,159 11,044 10,178 10,149 7,889
Paraíba 4,480 4,023 3,086 12,916 45,309 29,710 22,026 2,952 5,090 410 Agreste 41,851 17,263 23,259 11,546 47,522 68,642 162,195 15,303 131,739 6,517
Paraíba 20,526 10,912 13,478 5,260 15,422 38,048 134,373 9,237 95,723 2,786 Ipojuca 21,324 6,351 9,781 6,286 32,100 30,595 27,822 6,066 36,016 3,731
Zona da Mata 51,704 39,999 55,027 34,603 45,792 52,545 65,354 57,432 83,228 31,264 Paraíba 15,150 12,145 18,222 11,520 10,787 16,801 26,719 16,881 40,294 7,111
some of the studied basins, such as restrictions and even suspensions of water withdrawal for irrigation purposes (ANA, 2015), which might have affected the reduction in the irrigated area.
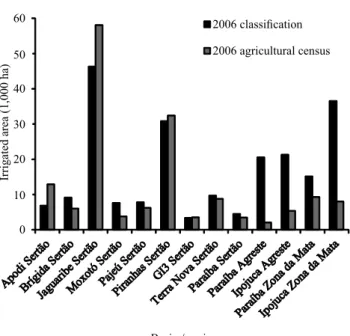
According to data from IBGE, the total irrigated area in the studied basins was 159,825 ha in 2006, i.e., 27% lower than the area calculated in the present study (Figure 5). The irrigated area of the Sertão region was underestimated in some basins and overestimated in others, resulting in a calculation of an irrigated area 7.6% lower than the area reported in the data from the census. These underestimations might be
due to the nonidentification of small and fragmented
irrigated areas and to uncertainties in the estimate of the irrigated area fraction at the subpixel scale. For the Agreste and Zona da Mata regions, the applied methodology overestimated the irrigated area by ~400 and 200%, respectively. The observed overestimations
are mainly due to natural vegetation areas classified as
irrigated areas.
Figure 5. Comparison of the 2006 agricultural census irrigated area data with the enhanced vegetation index (EVI) time series irrigated area, mapped for the year 2006, in each studied basin and region.
Conclusions
1. The classification of time series of the enhanced
vegetation index (EVI) from the moderate resolution imaging spectroradiometer (Modis) sensor can be applied to the mapping of irrigated areas in the Sertão region in Northeastern Brazil.
2. The applied methodology underestimates the irrigated area compared with the agricultural census data.
3. The applied methodology is not effective for mapping irrigated areas in the Agreste and Zona da Mata regions, in Northeastern Brazil, implying overestimations of the irrigated area.
References
ALEXANDRIDIS, T.K.; ZALIDIS, G.C.; SILLEOS, N.G. Mapping irrigated area in Mediterranean basins using low cost satellite earth observation. Computers and Electronics in Agriculture, v.64, p.93-103, 2008. DOI: 10.1016/j. compag.2008.04.001.
ALVARES, C.A.; STAPE, J.L.; SENTELHAS, P.C.; GONÇALVES, J.L. de M.; SPAROVEK, G. Köppen’s climate classification map for Brazil. Meteorologische Zeitschrift, v.22, p.711-728, 2013. DOI: 10.1127/0941-2948/2013/0507.
ANA. Agência Nacional de Águas. Conjuntura dos recursos hídricos no Brasil: Informe 2015. Brasília: SPR 2015. p.434. Available at: <http://www3.snirh.gov.br/portal/snirh/centrais-de-conteudos/conjuntura-dos-recursos-hidricos/conjuntura_ informe_2015.pdf>. Accessed on: Oct. 6 2016.
ANA. Agência Nacional de Águas. Levantamento da agricultura irrigada por pivôs centrais no Brasil – 2014: relatório síntese. Brasília, 2016. 33p. Available at: <http://arquivos.ana.gov.br/ imprensa/arquivos/ProjetoPivos.pdf>. Accessed on: Oct. 11 2016. BIGGS, T.W.; THENKABAIL, P.S.; GUMMA, M.K.; SCOTT, C.A.; PARTHASARADHI, G.R.; TURRAL, H.N. Irrigated area mapping in heterogeneous landscapes with Modis time series, ground truth and census data, Krishna Basin, India. International Journal of Remote Sensing, v.27, p.4245-4266, 2006. DOI: 10.1080/01431160600851801.
BORGES, E.F.; SANO, E.E.; MEDRADO, E. Radiometric quality and performance of TIMESAT for smoothing moderate resolution imaging spectroradiometer enhanced vegetation index time series from western Bahia State, Brazil. Journal of Applied Remote Sensing, v.8, p.083580-1-083580-21, 2014. DOI: 10.1117/1. JRS.8.083580.
COSTA, T.C. e C. da; BRITES, R.S. A influência do tamanho da amostra de referência na exatidão de classificação de imagens de sensoriamento remoto. Revista Brasileira de Cartografia,v.56, p.151-155, 2004.
GUMMA, M.K.; VELPURI, M. Irrigated areas of India derived using Modis 500 m time series for the years 2001-2003. ISPRS Journal of Photogrammetry and Remote Sensing,v.65, p.42-59, 2010. DOI: 10.1016/j.isprsjprs.2009.08.004.
GUIMARÃES, D.P.; LANDAU, E.C. Monitoramento da agricultura irrigada em tempo real. In: SIMPÓSIO BRASILEIRO DE SENSORIAMENTO REMOTO, 17., 2015, João Pessoa. Anais. São José dos Campos: INPE, 2015. Available at: <http:// www.dsr.inpe.br/sbsr2015/files/p0693.pdf>. Accessed on: Oct. 11 2016.
GUMMA, M.K.; THENKABAIL, P.S.; HIDETO, F.; NELSON, A.; DHEERAVATH, V.; BUSIA, D.; RALA, A. Mapping irrigated areas of Ghana using fusion of 30 m and 250 m resolution remote-sensing data. Remote Sensing, v.3, p.816-835, 2011a. DOI: 10.3390/rs3040816.
GUMMA, M.K.; THENKABAIL, P.S.; NELSON, A. Mapping irrigated areas using Modis 250 Meter Time-Series Data: a study on Krishna River Basin (India). Water, v.3, p.113-131, 2011b. DOI: 10.3390/w3010113.
HUETE A.; DIDAN, K.; MIURA T.; RODRIGUEZ, E.P.; GAO, X.; FERREIRA, L.G. Overview of the radiometric and biophysical performance of the Modis vegetation indices. Remote Sensing of Environment, v.83, p.195-213, 2002. DOI: 10.1016/ S0034-4257(02)00096-2.
IBGE. Instituto Brasileiro de Geografia e Estatística.
Censo Agropecuário 2006. 2006. Available at:
<http://www.ibge.gov.br/home/estatistica/economia/agropecuaria /censoagro/2006>. Accessed on: Oct. 15 2016.
JIANG, Z.; HUETE, A.R.; DIDAN, K.; MIURA, T. Development of a two-band enhanced vegetation index without a blue band.
Remote Sensing of Environment, v.112, p.3833-3845, 2008. DOI: 10.1016/J.RSE.2008.06.006.
JÖNSSON, P.; EKLUNDH, L. Seasonality extraction by function fitting to time-series of satellite sensor data. IEEE Transactions on Geoscience and Remote Sensing, v.40, p.1824-1832, 2002. DOI: 10.1109/TGRS.2002.802519.
LANDIS, J.R.; KOCH, G.G. The measurement of observer agreement for categorical data. Biometrics, v.33, p.159-174, 1977. DOI: 10.2307/2529310.
MARENGO, J.A.; BERNASCONI, M. Regional differences in aridity/drought conditions over Northeast Brazil: present state and future projections. Climatic Change, v.129, p.103-115, 2015. DOI: 10.1007/S10584-014-1310-1.
MONTENEGRO, S.G.; MONTENEGRO, A.; RAGAB, R. Improving agricultural water management in the semi-arid region of Brazil: experimental and modelling study. Irrigation Science, v.28, p.301-316, 2010. DOI: 10.1007/S00271-009-0191-Y.
OZDOGAN, M.; GUTMAN, G. A new methodology to map irrigated areas using multi-temporal Modis and ancillary data: an application example in the continental US. Remote Sensing of Environment, v.112, p.3520-3537, 2008. DOI: 10.1016/j. rse.2008.04.010.
OZDOGAN, M.; YANG, Y.; ALLEZ, G.; CERVANTES, C. Remote sensing of irrigated agriculture: opportunities and challenges.
Remote Sensing, v.2, p.2274-2304, 2010. DOI: 10.3390/rs2092274.
PERVEZ, M.S.; BUDDE, M.; ROWLAND, J. Mapping irrigated areas in Afghanistan over the past decade using Modis NDVI.
Remote Sensing of Environment, v.149, p.155-165, 2014. DOI: 10.1016/j.rse.2014.04.008.
SÁ, I.I.S.; MOURA, M.S.B.; SÁ, I.B.; GALVÍNCIO, J.D.; RIBEIRO, J.G. Dinâmica da agricultura irrigada em uma área do Vale do São Francisco utilizando técnicas de sensoriamento remoto. In: CONGRESSO BRASILEIRO DE AGROMETEOROLOGIA, 15., 2007, Aracaju. Efeito das mudanças climáticas na agricultura: anais. Aracaju: Sociedade Brasileira de Agrometeorologia: Embrapa Tabuleiros Costeiros, 2007. Available at: <https://www. embrapa.br/busca-de-publicacoes/-/publicacao/159189/dinamica- da-agricultura-irrigada-em-uma-area-do-vale-do-sao-francisco-utilizando-tecnicas-de-sensoriamento-remoto>. Accessed on: Oct. 11 2016.
SILVA, G.N.S. da; MORAES, M.M.G.A. de; SILVA, A.C.S. da. Delimitação das áreas irrigadas no trecho do Sub-Médio do Rio São Francisco. In: SIMPÓSIO DE RECURSOS HÍDRICOS DO NORDESTE, 12., 2014, Natal. Anais. Porto Alegre: ABRH, 2014. Available at: <http://docplayer.com.br/17029290-Xii-simposio-de-recursos-hidricos-do-nordeste.html>. Accessed on: Oct. 11 2016.
THENKABAIL, P.S.; BIRADAR, C.M.; NOOJIPADY, P.; DHEERAVATH, V.; LI, Y.; VELPURI, M.; GUMMA, M.; GANGALAKUNTA, O.R.P.; TURRAL, H.; CAI, X.; VITHANAGE, J.; SCHULL, M. A.; DUTTA, R. Global irrigated area map (GIAM), derived from remote sensing, for the end of the last millennium. International Journal of Remote Sensing, v.30, p.3679-3733, 2009. DOI: 10.1080/01431160802698919. THENKABAILC, P.S.; BIRADAR, C.M.; NOOJIPADY, P.; CAI, X.; DHEERAVATH, V.; LI, Y.; VELPURI, M.; GUMMA, M.; PANDEY, S. Sub-pixel area calculation methods for estimating irrigated areas. Sensors,v.7, p.2519-2538, 2007.
VELPURI, N.M.; THENKABAIL, P.S.; GUMMA, M.K.; BIRADAR, C.; DHEERAVATH, V.; NOOJIPADY, P.; YUANJIE, L. Influence of resolution in irrigated area mapping and area estimation. Photogrammetric Engineering and Remote Sensing, v.75, p.1383-1395, 2009. DOI: 10.14358/ PERS.75.12.1383.
WARREN, M.S.; TEIXEIRA, A.H. de C.; RODRIGUES, L.N.; HERNANDEZ, F.B.T. Utilização do sensoriamento remoto termal na gestão de recursos hídricos. Revista Brasileira de
Geografia Física, v.7, p.65-82, 2014.
ZHU, X.; ZHU, W.; ZHANG, J.; PAN, Y. Mapping irrigated areas in China from remote sensing and statistical data. IEEE
Journal of Selected Topics in Applied Earth Observations and Remote Sensing, v.7, p.4490-4504, 2014. DOI: 10.1109/ JSTARS.2013.2296899.