Oleci Pereira Frota
I, Adriano Menis Ferreira
I, Odanir Garcia Guerra
II, Marcelo Alessandro Rigotti
II,
Denise de Andrade
III, Najla Moreira Amaral Borges
IV, Margarete Teresa Gottardo de Almeida
V I Universidade Federal de Mato Grosso do Sul, Postgraduate Program in Health andDevelopment in the Midwest Region. Campo Grande, Mato Grosso do Sul, Brazil.
II Universidade Federal de Mato Grosso do Sul, Nursing Course. Três Lagoas, Mato Grosso do Sul, Brazil.
III Universidade de São Paulo, Ribeirão Preto College of Nursing, Department of General and Specialized Nursing.
Ribeirão Preto, São Paulo, Brazil.
IV Campinas City Hall, Department of Public Health. Campinas, São Paulo, Brazil.
V Faculdade de Medicina de São José do Rio Preto, Department of Skin, Infectious and Parasitic Diseases.
São José do Rio Preto, São Paulo, Brazil.
How to cite this article:
Frota OP, Ferreira AM, Guerra OG, Rigotti MA, Andrade D, Borges NMA, Almeida MTG. Efficiency of cleaning and disinfection of surfaces: correlation between assessment methods.
Rev Bras Enferm [Internet]. 2017;70(6):1176-83. DOI: http://dx.doi.org/10.1590/0034-7167-2016-0608
Submission: 11-16-2016 Approval: 02-02-2017
ABSTRACT
Objective: to assess the correlation among the ATP-bioluminescence assay, visual inspection and microbiological culture in monitoring the efficiency of cleaning and disinfection (C&D) of high-touch clinical surfaces (HTCS) in a walk-in emergency care
unit. Method: a prospective and comparative study was carried out from March to June 2015, in which five HTCS were sampled
before and after C&D by means of the three methods. The HTCS were considered dirty when dust, waste, humidity and stains were detected in visual inspection; when ≥2.5 colony forming units per cm² were found in culture; when ≥5 relative light units
per cm² were found at the ATP-bioluminescence assay. Results: 720 analyses were performed, 240 per method. The overall rates
of clean surfaces per visual inspection, culture and ATP-bioluminescence assay were 8.3%, 20.8% and 44.2% before C&D, and 92.5%, 50% and 84.2% after C&D, respectively (p<0.001). There were only occasional statistically significant relationships
between methods. Conclusion: the methods did not present a good correlation, neither quantitative nor qualitatively.
Descriptors: Equipment Contamination; Housekeeping; Nursing Audit; Health Facility Environment; Infectious Disease Transmission.
RESUMO
Objetivo: avaliar a correlação do teste de ATP-bioluminescência com inspeção visual e cultura microbiológica na monitorização da eficiência da limpeza e desinfecção (L&D) de superfícies clínicas altamente tocadas (SCAT) em unidade de pronto
atendimento. Métodos: estudo comparativo, prospectivo, conduzido de março a junho de 2015, de forma que cinco SCAT
foram amostradas antes e depois da L&D de rotina pelos três métodos. As SCAT foram consideradas sujas quando apresentaram:
na inspeção visual, poeira, dejetos, umidade e manchas; na cultura, ≥2,5 unidades formadoras de colônias por cm2 e; no
ATP-bioluminescência, ≥5 Unidades Relativas de Luz por cm2. Resultados: foram realizadas 720 avaliações, sendo 240 por
método. A taxa global de superfícies limpas por inspeção visual, cultura e ATP-bioluminescência foi, respectivamente, de 8,3%, 20,8% e 44,2% antes da L&D e de 92,5%, 50% e 84,2% após (p<0,001). Houve apenas associações pontuais estatisticamente
significativas entre os métodos. Conclusão: os métodos nem apresentaram boa correlação quantitativa, nem, qualitativa.
Descritores: Contaminação de Equipamentos; Serviço de Limpeza; Auditoria de Enfermagem; Ambiente de Instituições de Saúde; Transmissão de Doença Infecciosa.
Efficiency of cleaning and disinfection of surfaces:
correlation between assessment methods
INTRODUCTION
Although increasing prevention and awareness-raising efforts have been made, healthcare-associated infections (HAI) remain as one of the greatest challenges to clinical practice. The healthcare environment can be a source and a transmission medium of pathogens. Many publications have highlighted the importance of high-quality cleaning and dis-infection (C&D) of surfaces as part of a comprehensive pro-gram to reduce HAI. To do so, it is necessary to assess and fully understand the results obtained by evaluation methods of C&D effectiveness(1).
Visual inspection and microbiological cultures are the most common methods to assess C&D effectiveness of high-touch clinical surfaces (HTCS) and surfaces that are close to patients, such as buttons of continuous infusion pumps, medication preparation areas, glucometers, pulse oximeters, heart monitors, among others. Visual inspection is easy to be performed, relatively cheap and simple, and it may meet aesthetic requirements but does not provide objective infor-mation about levels of cleanliness or infection risks. Micro-biological cultures present great sensitivity and specificity, but they take time. They are expensive and require differ-ent equipmdiffer-ent and supplies, a microbiology laboratory and specialized staff(2).
Over the last decade, the measurement of organic ad-enosine triphosphate (ATP) in HTCS with ATP-biolumines-cence assay gained popularity, due to its speed, objectivity, sale, provision of quantitative data, possibility of immediate feedback on results and ability to improve C&D practices with a minor level of technical training. An experiment pub-lished about the use of ATP-bioluminescence assay to moni-tor C&D effectiveness in surfaces of healthcare facilities showed the use of a wide range of benchmarks. Currently, the best cut-off point of relative light units (RLU) to define a surface as clean is unknown. In addition, the correlation between the levels of ATP and microbial contamination is
uncertain and controversial(3).
Due to the lack of studies – none in walk-in emergen-cy care units (WECU) – about the correlation between the
ATP-bioluminescence assay and other methods, the main objective of this study was to assess the correlation among the ATP-bioluminescence assay with visual inspection and microbiological culture in monitoring the efficiency of C&D of HTCS and surfaces that were close to patients in a walk-in emergency care unit.
METHOD
Ethical aspects
The study was approved by the Research Ethics Committee of the Federal University of Mato Grosso do Sul and its devel-opment met national and international ethical requirements for research involving human subjects.
Study design, location and duration
A prospective study was carried out from March to June 2015 in a walk-in emergency care unit (WECU) in Mato Grosso do Sul, Brazil. The unit was in good conditions and had been opened for 14 months only. Within a WECU, dif-ferent invasive procedures are performed, many of which in situations of emergency and emotional stress, and this can lead to a disruption in sanitation strictness, with pa-tients being subject to HAI. This imposes the need to have preventive safety measures implemented, such as C&D of HTCS.
Sample and selection criteria
Non-probability (convenience) sampling technique was used, and HTCS were selected on the basis of the frequency of hand contact and closeness to patients. It was decided to select environments in which procedures of greater risks for HAI were performed. Therefore, the included surfaces were the medication preparation area 1, heart monitor (both from the emergency room), medication preparation area 2 (medication room), dressing trolley (bandaging room) and mattress (observation room). All HTCS are made of stainless steel, except for the mattress (polyvinyl chloride and polyes-ter knitted fabric) and the heart monitor (polyvinyl chloride and rubber).
Oleci Pereira Frota E-mail: [email protected] CORRESPONDING AUTHOR
RESUMEN
Objetivo: evaluar correlación del test ATP-bioluminiscencia con inspección visual y cultivo microbiológico en monitoreo de eficiencia de limpieza y desinfección (L&D) de superficies clínicas altamente tocadas (SCAT) en unidad de pronta atención. Métodos: estudio comparativo, prospectivo, realizado de marzo a junio de 2015, cuando cinco SCAT fueron muestreadas antes y después de L&D de rutina por los tres métodos. Las SCAT fueron consideradas sucias cuando presentaban: en inspección
visual: polvo, deyecciones, humedad y manchas; en cultivo: ≥205 unidades formadoras de colonias por cm2, y en
ATP-bioluminiscencia: ≥5 Unidades Relativas de Luz por cm2. Resultados: fueron realizadas 720 evaluaciones, 240 por método. La
tasa global de superficies limpias por inspección visual, cultivo y ATP-bioluminiscencia fue, respectivamente, 8,3%, 20,8% y 44,2% antes de la L&D y de 92,5%, 50% y 84,2% después (p<0,001). Existieron sólo asociaciones puntuales estadísticamente
significativas entre los métodos. Conclusión: los métodos no presentan buena correlación cuantitativa, ni cualitativa.
Routine of cleaning and disinfection of surfaces
The C&D of the surfaces surveyed was performed by the nursing team once a day – at the beginning of the morning shift – or when organic liquids were spilled over, except for the mattress, which was always disinfected after patient dis-charge. The procedure included the use of cleaning cloths folded into four parts, sprinklers and a hospital disinfectant for fixed surfaces, composed of glucoprotamin (12.4%) and alkyl dimethyl benzyl ammonium chloride (15%), which acts as a detergent and disinfectant, therefore cleaning and disinfecting at one go.
Data collection methods and cleaning standards
The HTCS were sampled by visual inspection, microbio-logical culture and ATP-bioluminescence assay before and af-ter C&D. The surfaces were sampled – exclusively by the au-thors of this study, and only once a day – right before and 10
minutes after the end of the C&D morning session(3-4). There
was not a specific department for collection of HTCS.
Visual inspection
First method applied: surfaces that contained dust, waste (blood, wound ooze, organic liquids, physiological serum crystals, ointment or cream, oil, solute, etc.), patch residues,
humidity and stains were considered dirty(4-5).
ATP-bioluminescence assay
In order to detect ATP by bioluminescence, a hand-held luminometer was used (Clean-Trace ATP System; 3M™) and a Clean Trace Kit - a specific swab. Following the
manufactur-er’s recommendation and the literature(4), a sterile cotton swab
was leaned over the tested surface until it was slightly bend-ed, forming a 30° angle, and then rubbed in zigzag fashion. This method measures the amount of organic ATP found in the sample. By means of a proper swab, the organic material found on the surface is collected and transferred to a detection device made up of an enzyme-substrate compound (luciferin-luciferase). The reaction that results from the contact of the sample with this compound releases a certain type of light, whose intensity is measured by hand-held luminometers and which is expressed in RLU. The amount of RLU is proportional to the amount of ATP, which in turn is proportional to the
den-sity of the organic material(6-8). The surfaces were considered
clean when the ATP index was <5 RLU/cm², collected from a
100 cm² surface, that is, <500 RLU/surface(3-5,9)
Microbiological cultures
The microbiological samples were collected by means of RODAC plates (Replicate Organism Detection And Count-ing) with trypticase soy agar (TSA), which contained sanitizer
neutralizers and a 24 cm² area(3,10). The plates were labeled,
pressed for 10 seconds against the surfaces at ~25 g/cm2,
without any sideways movement, and incubated at 37ºC for
24-48h(6,10-11). For the aerobic colony counting (ACC), an
elec-tronic and digital colony counter was used (Logen® LS6000).
The surfaces were considered clean when the ACC was <2.5 CFU/cm2, that is, <60 CFU/plate(3,9-10).
Analysis of results and statistics
The comparison between the methods and associations between the disapproval rates was analyzed by means of a Fisher’s exact test or a Kruskall-Wallis test. The levels of RLU and ACC obtained before and after C&D were analyzed by means of the Wilcoxon signed-rank test. The Spearman’s cor-relation test was used to examine the corcor-relation between the ATP and ACC scores, and the McNemar’s test was used for the qualitative correlation (approved or disapproved). The re-ceiver operating characteristic (ROC) curve was drawn, and the significance level adopted was 5% (p<0.05).
RESULTS
A total of 720 samples were collected, 240 of which by monitoring, half of them before and the other half after C&D. Each one of the five surfaces was sampled 48 times per meth-od, 24 of which were done before C&D and the other 24 after C&D. According to Table 1, out of the 120 evaluations carried out before C&D, 8.3%, 20.8% and 44.2% were con-sidered clean, respectively, by visual inspection, ACC, and ATP-bioluminescence, against 92.5%, 50% and 84.2% after C&D (p<0.001).
Considering that the p-value is <0.05, which shows a sta-tistically significant difference, and that we analyzed the cor-relation among methods, p≥0.05 indicates the existence of a correlation among methods, and p=1.00, a perfect correla-tion. Thus, when the disapproval rates of all surfaces are com-pared (Table 1), we can see that there is only one significant association (p>0.05): ACC and visual inspection after C&D. In all, there were 16 associations (six between ATP and visual inspection; five between ATP and ACC, and five between ACC and visual inspection) and 20 discrepancies. Regarding the cut-off points, the ATP-bioluminescence assay showed scores that were higher than those of ACC, both before and after cleaning and/or disinfection.
With the Spearman’s correlation test (data not presented), there was no statistically significant correlation between ACC and RLU, which indicates that when there is a decrease in CFU after cleaning, it is not possible to assume a decrease in RLU, and vice-versa. There was a great variation between the correlation coefficients: from -0.611 to 0.905. Additionally, the McNemar’s test was used to assess the qualitative discrep-ancy (dirty or clean) among methods. Qualitative results ob-tained before and after C&D were considered. The test results were highly significant, suggesting that there is a discrepancy among the methods with regard to approval or disapproval of surfaces: bioluminescence vs. ACC (p<0.0001); ATP-bioluminescence vs. visual inspection (p<0.0001); and ACC vs. visual inspection (p=0.0006).
Table 1 – Disapproval rates, median and variation, according to collection time, surface and monitoring method
Time / surfaces
Visual ATP*(RLU/cm2) ACC (CFU/cm2) p value†
Disapproval n (%)
Median (variation)
Disapproval n (%)
Median (variation)
Disapproval n (%)
ATP vs visual
ATP vs ACC
ACCvs visual
Before C&D
Med Prep 1 23 (95.8) 6.9 (1.2-209.7) 15 (62.5) 3.1 (0.1-74.6) 13 (54.2) 0.010 0.770‡ <0.001
Heart Monitor 16 (66.7) 8.1 (2-1148.7) 15 (62.5) 1.4 (0.9-11) 8 (33.3) 1.000‡ 0.082‡ 0.022
Med Prep 2 23 (95.8) 11.2 (3.3-37.5) 22 (91.7) 2.9 (0.1-67.7) 13 (54.2) 1.000‡ 0.008 <0.001
Dressing trolley 24 (100) 14 (4.1-2920.3) 23 (95.8) 3.5 (0.4-69) 16 (66.7) 1.000‡ 0.023 0.001
Mattress 24 (100) 15.3 (1.9-221.2) 20 (83.3) 2.9 (0.5-82) 13 (54.2) 0.109‡ 0.060‡ <0.001
All 110 (91.7) 11.2 (1.2-2920.3) 95 (87.1) 2.7 (0.1-81.9) 67 (61.4) 0.010 <0.001 <0.001
After C&D
Med Prep 1 1 (4.2) 4.2 (0.4-18.5) 10 (41.7) 0.9 (0-18.8) 2 (8.3) 0.004 0.017 1.000‡
Heart Monitor 0 (0) 1.4 (0.5-3.7) 0 (0) 0.2 (0-10.5) 3 (12.5) 1.000‡ 0.234‡ 0.234‡
Med Prep 2 1 (4.2) 7.5 (0.7-56.7) 16 (66.7) 0.4 (0.1-8) 3 (12.5) <0.001 <0.001 <0.001
Dressing trolley 9 (37.5) 7.1 (0.5-21.5) 18 (75) 0.1 (0-68.5) 4 (16.7) 0.534‡ 0.724‡ 0.193‡
Mattress 1 (4.2) 5.9 (1.4-271) 14 (58.3) 0.8 (0.1-5.4) 2 (8.3) <0.001 0.001 1.000‡
All 12 (10.0) 4.9 (04-270.9) 58 (48.3) 0.2 (0-68.5) 14 (11.7) <0.001 <0.001 0.684‡
Notes: *ATP-bioluminescence; †Test for two proportions; ‡p ≥0.05, indicating a correlation between methods; ATP – adenosine triphosphate; RLU – relative light units; ACC – aerobic colony count; CFU – colony forming units; C&D – cleaning and disinfection.
Table 2 – Characteristics of non-microbiological methods, according to the comparison with a microbiological culture for the definition of a clean or dirty surface
Method
Characteristics of the test to define a surface as dirty (%)
Sensitivity Specificity PPV† NPV‡ Accuracy
Visual inspection 83.1 64.4 52.5 89 70.4
ATP*(< 5 RLU/cm2) 78 42.9 39.2 80.5 54.1
ATP*(< 8 RLU/cm2) 62.3 61.4 43.2 77.5 61.7
Notes: *ATP-bioluminescence; †positive predictive value; ‡negative predictive value. of results of the statistical tests applied. However, we can see that the median and the 25-75 interquartile range were con-siderably lower after C&D for all surfaces.
Adopting the reference ACC<2.5 CFU/cm² for the
defi-nition of a clean surface(3,9-10), following the ROC curve, the
best cut-off point for ATP-bioluminescence was 7.9 RLU/ cm². The characteristics of visual inspection and
ATP-bio-luminescence with a <5 RLU/cm2 cut-off point and <8
RLU/cm2 with regard to the microbiological comparison are
DISCUSSION
This is the first research study carried out by the authors com-paring methods for effectively monitoring C&D of surfaces in out-of-hospital environments. Generally speaking, the results showed a weak association between qualitative results (clean or dirty) of ATP-bioluminescence and the other monitoring methods. Both vi-sual inspection and ATP-bioluminescence did not show any cor-relation with microbiological comparison when they were cross-checked in different ways and by statistical tests. In all methods, the quantitative and/or qualitative results indicated that routine C&D had positive effects on sanitation of the surfaces surveyed.
According to the ROC curve, the best cut-off point of ATP-biolumi-nescence for the referred unit was 8 RLU/cm². With that cut-off point, there is an increase in sensitivity, a decrease in specificity and an in-crease in accuracy (Table 2).
Although the cleaning of sur-faces is internationally considered as necessary to control HAI, so far there is no consensus that is universally accepted regarding the preferred methods to assess C&D of hospitals, much less so in an
WECU(12). The efficiency of
ATP-bioluminescence has been tested in many studies(3-4,12-13), and strong
cor-relations between ACC and levels of ATP were found under specific and controlled conditions, but they were limited in healthcare environ-ments(1,3,14). This can be explained
by the diversity of ATP measure-ment systems, cut-off points and surface C&D practices among the institutions/units where those stud-ies were conducted. In addition, if cleaning is not appropriate, dirt and microorganisms cannot be re-moved, but only relocated, which leads to the discrepancy with mi-crobiological cultures(3).
Another explanation can be ATP stability. A study proved that, in the absence of C&D, ATP residues coming from both organic mate-rial and microorganisms (dead or alive), do not deteriorate rapidly. After 29 days, surfaces infected
with suspension of P. aeruginosa,
E. faecalis and C. albicans kept ATP levels of 65%, 69% and 96% of levels originally present in the solu-tion, respectively. Surfaces that con-tained blood had 100% and 8% of
the original ATP after 4 and 29 days, respectively(15). Therefore,
when C&D methods fail to remove dirt, ATP can remain stable for more than 24 hours on ambient surfaces; and microorganisms are then dead by the action of the disinfectant. Thus, after C&D, there will be a high RLU score and a low ACC.
Although technologies that identify microbial and non-microbial ATP are commercially available, it is important to highlight that most studies carried out in health units use a bioluminescence system that measures total ATP (organic ma-terial, dead or living microorganisms), whereas microbiologi-cal cultures measure viable microorganisms. A surface may contain organic material in abundance, but not necessarily
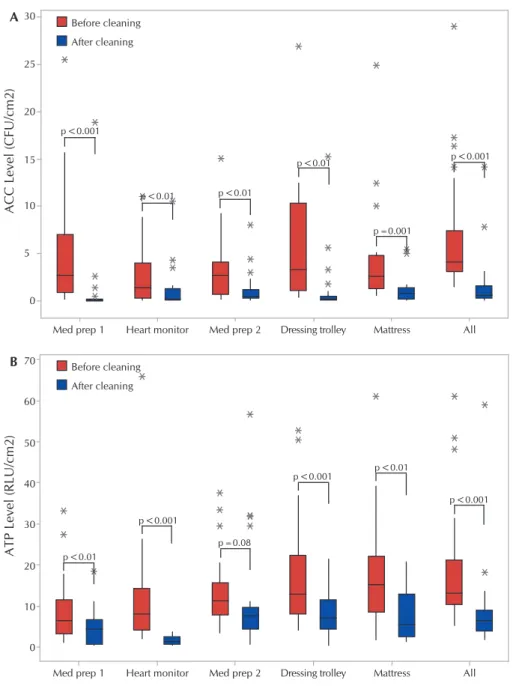
Before cleaning After cleaning Before cleaning After cleaning p<0.001 p<0.01 p<0.001
p<0.001 p<0.01
p<0.001
p=0.08 p<0.01 p<0.01
p<0.01 p<0.001
p=0.001
All Mattress
Dressing trolley Med prep 2
Med prep 1 Heart monitor
70 60 50 40 30 20 10 0
ATP Level (RLU/cm2)
B
All Mattress
Dressing trolley Med prep 2
Med prep 1 Heart monitor
30 25 20 15 10 5 0
ACC Level (CFU/cm2)
A
Note: P-value for Wilcoxon signed-rank test; ACC - aerobic colony count; CFU - colony forming units; RLU – Rela-tive light units; ATP - adenosine triphosphate.
a high microbial density and vice-versa. In that sense, the in-terpretation of ATP can never be made so as to indicate the
presence or absence of pathogens responsible for HAI(14,16).
Previous studies(16-17) recommended to find corresponding
benchmarks of cleanliness in a certain configuration, and use ATP-bioluminescence to monitor the ability of an intervention in reducing the amount of microbes to a predefined level. In other words, ATP-bioluminescence is not a reliable method for the identification and surveillance of potentially infected HTCS, but rather a tool that assesses the efficiency of cleaning procedures or other infection controlling measures.
In addition to the discrepancy with the microbiological
com-parison, a recent study(18) reported the absence of a correlation
between two different measurement systems of ATP-biolumines-cence (Kikkoman ATP device with Lucipak-Pen swabs and Hygi-ena ATP device with Ultrasnap swabs). In addition to the intrinsic singularities of each system, the distribution of organic material over the surface (some areas may have more dirt on a same sur-face) and the researcher’s ability to keep the homogeneity during the collection with the swab may interfere in RLU interpretation.
Many studies have found a weak correlation between non-microbiological methods and ACC for the monitoring of the ef-ficiency of C&D in HTCS(4,13,16,19). In this study, visual inspection
and ATP-bioluminescence differed from ACC qualitative results in 29.6% and 45.8% of cases, respectively. Similar results were
found in a study(19) that used a hand-held luminometer
(Clean-Trace ATP System; 3M™) and a Clean (Clean-Trace kit and cut-off point
of <5 RLU/cm2 to assess the efficiency of final cleaning, in
which the discrepancy of visual inspection and ATP-biolumines-cence with the microbiological comparison was 42% and 37%, respectively. These results support the fact that non-microbiolog-ical methods cannot estimate the efficiency of cleaning when microbiological cultures are used as a reference.
Although visual inspection has a weak correlation with
ACC, as documented in many studies(3-4,13,17), in this study and
in another one it is the method that is closest to microbiologi-cal comparison, as far as sensitivity, specificity and accuracy values are concerned. This can be related, to some extent, to the evaluator’s skills. The greatest limiting factor is its low
specificity, which varies from 9% to 65%(13,19). In addition, it is
known that, after C&D procedures, many more surfaces con-sidered as dirty by ACC are seen as clean by visual inspec-tion when compared to another non-microbiological method
(ATP-bioluminescence, fluorescent marker)(4,13).
Studies suggest that visual assessment is not sufficient to ensure the quality of the process, and it is less efficient than quantitative methods in raising awareness about the need to improve
sanita-tion practices(20). The use of ATP-bioluminescence to assess and
have feedback of results leads to greater awareness, collaboration, communication and education of cleaning and nursing staffs, and therefore, it improves the efficiency of practices(21-22).
In this study, sensitivity, specificity, accuracy, PPV and NPV of visual inspection and ATP-bioluminescence were cal-culated using a microbiological culture (cut-off point of 2.5 CFU/cm²) as a “reference” test. The results obtained were very similar to those of a study conducted in the wards of a
teach-ing hospital(13), confirming that sensitivity and specificity of
ATP-bioluminescence are around 80% and 40%, respectively. The referred study found a very low specificity for visual in-spection (9%), suggesting that infected surfaces can be ap-proved by this method, especially after C&D.
However, it should be highlighted that these findings are far
from being unanimous in the literature. Another study(3) found
different results, in which sensitivity of visual inspection was 27.3% and specificity, 94.6%. This might be related to the fact that there is no standardization of techniques, supplies, cut-off points and technology of the monitoring methods.
It was observed that ATP-bioluminescence <8 RLU/cm2, the
cut-off point suggested by the ROC curve, reduced sensitivity but increased specificity, PPV, and therefore, the accuracy of the test,
when compared to the cut-off point <5 URL/cm2 that is
conven-tionally used for cleaning of hospital environments(3-5,9).
Study limitations
The limitations of this study concern its development in only one institution, the small sample considered and the study de-sign, which did not allow for establishing a relationship between the results of the three methods before and/or after C&D with the contraction of HAI. Although the surfaces sampled by swab (ATP-bioluminescence assay) and RODAC plates before and after C&D were adjacent, it is possible that different levels of dirt may have been present in different areas of the surface. The sample was defined for convenience, but considering that we chose the rooms with greater risks of HAI and clinical surfaces that are more frequently touched by hands and related to invasive procedures, we believe that the effect of the non-randomized sampling of rooms and surfaces on the internal validity and/or mainstreaming is minor. From the perspective of cross-transmission of pathogens, this was the best sample possible for this study. Finally, although there are limited data about the cut-off points that are clinically relevant to reduce the transmission of pathogens, cut-off points for each test were used on the basis of studies carried out in hospitals, which may not be suitable to a WECU.
Contributions to the nursing, healthcare or public policy fields The results of this study provide inputs for evidence-based nursing practice, since they provide grounds for the choice of the ideal method of assessment of the efficiency of C&D of HTCS in daily situations, outbreaks and assessment of the impact of spe-cific interventions, as well as they indicate the best cut-off points (benchmarks) of ATP-bioluminescence assay for a WECU, ac-cording to its singularities and using a specific and widely known device to measure the bioluminescence. In addition, this study fosters: the creation of public health policies focused on patient safety, with regard to the ongoing or implemented assessments of C&D of surfaces, as well as operational guidelines; health educa-tion aceduca-tions (continuing educaeduca-tion, curricular structuring of un-dergraduate and graduate courses); and future research to address other inputs, ways and devices for monitoring C&D.
CONCLUSIONS
performed in a systematic and standardized way can be the preferable method to assess the efficiency of C&D routine in a WECU, given its sensitivity and accuracy, as well as its sim-plicity, ease, low cost and minimal training required. Howev-er, when it is intended to improve C&D practices, audit C&D efficiency, provide immediate feedback on results and assess the impact of specific interventions – educational, operation-al, logistic–, the use of an ATP-bioluminescence assay and/or microbiological cultures is recommended.
FUNDING
Foundation for the Support of Teaching, Science and Technology Development of the state of Mato Grosso do Sul (FUNDECT) for the Unified Health System (SUS) - FUNDECT/ DECIT-MS/CNPq/SES call, agreement 04/2013 PPSUS-MS, protocol n. 26434.386.4552.26042013, (FUNDECT; funding of research) and Support and Evaluation of Graduate Educa-tion (CAPES - PhD scholarship from first author).
REFERENCES
1. Gibbs SG, Sayles H, Chaika O, Hewlett A, Colbert A, Smith PW. Evaluation of the relationship between ATP bioluminescence assay and the presence of organisms associated with healthcare-associated infections. Healthcare Infect[Internet]. 2014[cited 2016 Mar 02];19(3):101-7. Available from: http://www.publish.csiro.au/hi/HI14010
2. Mitchell BG, Wilson F, Dancer SJ, McGregor A. Methods to evaluate environmental cleanliness in healthcare facilities. Healthcare Infect [Internet]. 2013[cited 2016 Apr 16];18(1):23-30. Available from: http://www.publish.csiro.au/hi/HI12047
3. Huang YS, Chen YC, Chen ML, Cheng A, Hung IC, Wang JT, et al. Comparing visual inspection, aerobic colony counts, and adenosine triphosphate bioluminescence assay for evaluating surface cleanliness at a medical center. Am J Infect Control [Internet]. 2015[cited 2016 Mar 10];43(8):882-6. Available from: https://www.ncbi.nlm.nih.gov/pubmed/25952617
4. Ferreira AM, Andrade D, Rigotti MA, Almeida MTG, Guerra OD, Santos Junior AG. Assessment of disinfection of hospital surfaces using different monitoring methods. Rev Latino-Am Enfermagem [Internet]. 2015[cited 2016 Jan 23];23(3):466-74. Available from: http://www.scielo.br/pdf/rlae/v23n3/0104-1169-rlae-23-03-00466.pdf
5. Knape L, Hambraeus A, Lytsy B. The adenosine triphosphate method as a quality control tool to assess ‘cleanliness’ of frequently touched hospital surfaces. J Hosp Infect [Internet]. 2015[cited 2016 Mar 25];91(2):166-70. Available from: https://www.ncbi.nlm. nih.gov/pubmed/26213368
6. Mulvey D, Redding P, Robertson C, Woodall C, Kingsmore P, Bedwell D, et al. Finding a benchmark for monitoring hospital cleanliness. J Hosp Infect [Internet]. 2011[cited 2016 Mar 02];77(1):25-30. Available from: https://www.ncbi.nlm.nih.gov/ pubmed/21129820
7. Hardy K, Abbott G, Bashford S, Bucior H, Codd J, Holland M, et al. Can measuring environmental cleanliness using ATP aid in the monitoring of wards with periods of increased incidence of Clostridium difficile? J Infect Prev [Internet]. 2014[cited 2016 Mar 15];15(1):31-5. Available from: http://bji.sagepub.com/content/15/1/31.short
8. Gordon L, Bruce N, Suh KN, Roth V. Evaluating and operationalizing an environmental auditing program: a pilot study. Am J Infect Control [Internet]. 2014[cited 2016 Aug 08];42(7):702-7. Available from: https://www.ncbi.nlm.nih.gov/pubmed/24969123
9. Boyce JM, Havill NL, Havill HL, Mangione E, Dumigan DG, Moore BA. Comparison of fluorescent marker systems with 2 quantitative methods of assessing terminal cleaning practices. Infect Control Hosp Epidemiol [Internet]. 2015[cited 2016 Aug 12];32(12):1187-93. Available from: https://www.ncbi.nlm.nih.gov/pubmed/22080657
10. Cloutman-Green E, D’Arcy N, Spratt DA, Hartley JC, Klein N. How clean is clean-is a new microbiology standard required? Am J Infect Control [Internet]. 2014[cited 2016 Aug 18];2(9):1002-3. Available from: https://www.ncbi.nlm.nih.gov/pubmed/25179334
11. Bogusz A, Stewart M, Hunter J, Yip B, Reid D, Robertson C, Dancer SJ. How quickly do hospital surfaces become contaminated after detergent cleaning? Healthcare Infect [Internet]. 2013[cited 2016 Feb 16];18(1):3-9. Available from: http://citeseerx.ist.psu. edu/viewdoc/download?doi=10.1.1.829.8211&rep=rep1&type=pdf
12. Amodio E, Dino C. Use of ATP bioluminescence for assessing the cleanliness of hospital surfaces: a review of the published literature (1990-2012). J Infect Public Health [Internet]. 2014[cited 2016 Aug 10];7(2):92-8. Available from: https://www.ncbi. nlm.nih.gov/pubmed/24231159
13. Luick L, Thompson PA, Loock MH, Vetter SL, Cook J, Guerrero DM. Diagnostic assessment of different environmental cleaning monitoring methods. Am J Infect Control [Internet]. 2013[cited 2016 Sep 15];41(8):751-2. Available from: https://www.ncbi.nlm. nih.gov/pubmed/23380380
14. Shama G, Malik DJ. The uses and abuses of rapid bioluminescence-based ATP assays. Int J Hyg Environ Health [Internet]. 2013[cited 2016 Sep 15];216(2):115-25. Available from: https://www.ncbi.nlm.nih.gov/pubmed/22541898
16. Russotto V, Cortegiani A, Raineri, SM, Gregoretti, C, Giarratano A. Adenosine triphosphate bioluminescence in intensive care units: be careful with its use. Am J Infect Control [Internet]. 2016[cited 2016 Jun 01];44(6):732-3. Available from: https://www. ncbi.nlm.nih.gov/pubmed/26971140
17. Boyce JM, Havill NL, Dumigan DG, Golebiewski M, Balogun O, Rizvani R. Monitoring the effectiveness of hospital cleaning practices by use of an adenosine triphosphate bioluminescence assay. Infect Control Hosp Epidemiol [Internet]. 2009[cited 2016 Jun 12];30(7):678-84. Available from: https://www.ncbi.nlm.nih.gov/pubmed/19489715
18. Whiteley GS, Knight JL, Derry CW, Jensen SO, Vickery K, Gosbell IB. A pilot study into locating the bad bugs in a busy intensive care unit. Am J Infect Control [Internet]. 2015[cited 2016 Sep 20];43(12):1270-5. Available from: https://www.ncbi.nlm.nih.gov/ pubmed/26654232
19. Snyder GM, Holyoak AD, Leary KE, Sullivan BF, Davis RB, Wright SB. Effectiveness of visual inspection compared with non-microbiologic methods to determine the thoroughness of post-discharge cleaning. Antimicrob Resist Infect Control [Internet]. 2013[cited 2016 Sep 15];2:26. Available from: https://www.ncbi.nlm.nih.gov/pmc/articles/PMC3852477/pdf/2047-2994-2-26. pdf
20. Zambrano AA, Jones A, Otero P, Ajenjo MC, Labarca JA. Assessment of hospital daily cleaning practices using ATP bioluminescence in a developing country. Braz J Infect Dis [Internet]. 2014[cited 2016 Feb 11];18(6):675-7. Available from: http://www.scielo.br/ pdf/bjid/v18n6/1413-8670-bjid-18-06-0675.pdf
21. Branch-Elliman W, Robillard E, McCarthy G Jr, Gupta K. Direct feedback with the ATP luminometer as a process improvement tool for terminal cleaning of patient rooms. Am J Infect Control [Internet]. 2014[cited 2016 Aug 15];42(2):195-7. Available from: https://www.ncbi.nlm.nih.gov/pubmed/24485376