Impaired cognition in depression and Alzheimer
(AD): a gradient from depression to depression
in AD
Alterações cognitivas na depressão e na doença de Alzheimer: um gradiente da depressão
até a doença de Alzheimer
Narahyana Bom de Araujo1,2, Helena Sales Moraes1,2, Heitor Silveira1,2, Cynthia Arcoverde6, Paulo Eduardo Vasques1,2, Maria Lage Barca4, Anne-Brita Knapskog4, Knut Engedal4, Evandro Silva Freire Coutinho3, Andrea Camaz Deslandes1,2, Jerson Laks2,5
ABSTRACT
Objective:To assess cognition in major depressed (MD), Alzheimer’s disease (AD), and depression in AD elderly.Method:Subjects were evaluated by Mini Mental, Rey Auditory Verbal Learning Test, Rey Complex Figure, Digit Span, Similarities, Trail Making A/B, Verbal Fluency and Stroop. One-way ANOVA and multivariate models were used to compare the performance of each group on neuropsychological tests. Results:We evaluated 212 subjects. Compared to MD, attention, working memory, processing speed and recall showed significantly better in controls. Controls showed significantly higher performance in all cognitive measures, except in attention compared to AD. Verbal fluency, memory, processing speed and abstract reasoning in MD was significantly higher compared to AD. AD was significantly better in general cognitive state than depression in AD. All other cognitive domains were similar.Conclusion:A decreasing gradient in cognition appeared from the control to depression in AD, with MD and AD in an intermediate position.
Keywords:Alzheimer’s disease, depression, neuropsychological tests and cognition.
RESUMO
Objetivo:Avaliar a cognição em idosos com depressão Maior (DM), doença de Alzheimer (DA) e Depressão na DA.Método:Utilizou-se o Mini Mental, Rey Auditory Verbal Learning Test, Figura de Rey, Dígitos, Semelhanças, Trail Making A/B, Fluência Verbal e Stroop. ANOVA one-way e modelos multivariados foram utilizados para comparar o desempenho dos grupos.Resultados:Foram avaliados 212 sujeitos. Comparado com DM, controles apresentaram desempenho significativamente melhor na atenção, memória de trabalho, velocidade de processamento e evocação. Os controles apresentaram desempenho significativamente superior em todas as avaliações, exceto na atenção comparado com DA. Fluência verbal, memória, velocidade de processamento e raciocínio abstrato na DM foi significativamente maior comparado com DA. DA foi significativamente melhor no estado cognitivo geral comparado a depressão na DA, os outros domínios foram semelhantes.Conclusão:Observou-se um gradiente decrescente na cognição dos controles até a Depressão na DA, com os grupos DM e DA com desempenhos intermediários.
Palavras-chave:doença de Alzheimer, depressão, testes neuropsicológicos e cognição.
Alzheimer’s disease (AD) and major depression (MD) are the most common neuropsychiatric disorders in the elderly
and several patients have both disorders1. The relation
between MD and AD may have several directions: MD
1Laboratório de Neurociência do Exercício, Universidade Gama Filho, Rio de Janeiro RJ, Brazil;
2Centro de Doenças de Alzheimer e outras Desordens Mentais na Velhice, Instituto de Psiquiatria, Universidade Federal do Rio de Janeiro, Rio de Janeiro RJ,
Brazil;
3Escola Nacional de Saúde Pública, Fundação Oswaldo Cruz, Rio de Janeiro RJ, Brazil;
4Norwegian Centre for Dementia Research, Centre for Ageing and Health, Department of Geriatric Medicine, Ullevaal University Hospital, and Faculty of
Medicine, University of Oslo, Oslo, Norway;
5Centro de Estudos e Pesquisa do Envelhecimento, Instituto Vital Brasil, Rio de Janeiro RJ, Brazil;
6Centro Universitário do Instituto Brasileiro de Medicina de Reabilitação, Rio de Janeiro RJ, Brazil.
Correspondence:Narahyana Bom de Araujo; Universidade Federal do Rio de Janeiro, Instituto de Psiquiatria; Avenida Venceslau Brás, 71; 22290-140 Rio de Janeiro RJ, Brasil; E-mail: [email protected]
Conflict of interest:There is no conflict of interest to declare.
Financial Support:Conselho Nacional de Pesquisa (CNPQ, Brazilian National Council for Research) and the Fundação de Amparo à Pesquisa do Rio de Janeiro (FAPERJ, Foundation for Research Support of Rio de Janeiro).
Received 18 February 2014; Received in final form 28 May 2014; Accepted 24 June 2014.
DOI:10.1590/0004-282X20140108
may be a risk factor for dementia2, a comorbid disorder with
dementia, or even a neuropsychiatric syndrome in AD, regardless of the severity of dementia3.
It is known that the cognitive impairment is more com-mon in depressed elderly than in younger people with depression4. The impairment in speed of information
proces-sing, in attention/concentration, and in executive functions are the most important cognitive features in geriatric depression4. However, these problems are the very same
cog-nitive problems which appear in mild cogcog-nitive impairment and in mild AD and MD1,5, making it difficult to distinguish
both disorders when depression is present5.
In addition, several studies have focused on the severity of cognitive impairment within the spectrum ranging from nor-mal aging, MD, cognitive dysfunction, mild cognitive impair-ment, and dementia6,7. The cognitive performance of older
persons with MD is thought to be in between the performance observed in healthy and dementia subjects. As already pointed out, the main cognitive changes in MD are observed in atten-tion and executive funcatten-tions, whereas immediate and delayed recall are more characteristic impairments of dementia in Alzheimer’s disease5. However, older adults with MD may have
prominent deficits in memory too, as well as AD patients have significant deficits in executive function5. When dementia is
associated with depression, there are conflicting results in the literature. Some studies have shown that depression in dementia is associated with reduced cognitive performance when compared with AD without depression8,9 and others
found no difference in cognitive function between AD and depression in AD10,11.
So, it seems that the severity of the cognitive decline fol-lows a gradient according to the interaction of depression and dementia. It is reasonable to hypothesize that patients with depression in DA are the ones with most impairment, whereas dementia would be in between depression and depression in AD. This is possibly due to an increasing hip-pocampal neuropathology when depression is superimposed to dementia, suggesting an interaction between depression and neuropathology processes in AD12.
Therefore, the purpose of the present study is to assess the cognitive impairment in older persons with MD, AD, and with depression in AD.
METHOD
Subjects
Patients were diagnosed by psychiatrists at the university center. For diagnosis, psychiatrists used the DSM-IV13 and
the NINCDS-ADRDA14to AD, and the DSM-IV criteria13to
MD. Imaging and laboratory evaluation were required and a screening using the Mini Mental State Examination (MMSE), the clock test, and the verbal fluency test was
applied. After the diagnosis, patients were selected according to the inclusion/exclusion criteria. The inclusion/exclusion criteria were: subjects with comorbid neurological or clinical disorders were excluded from the sample, as well as those subjects who had important physical limitations, and visual or hearing impairment. The healthy elderly were recruited from an exercise program at the same university campus in Rio de Janeiro. Control participants included individuals who were designated cognitively normal by clinical evalu-ation and MMSE and without neurological or psychiatric diseases. A total of 212 elderly patients ($60 years) were included in the final sample (MD=61; AD=46; depression in AD=43; healthy elderly=62).
The severity of depression in each disorder was measured by the Brazilian validated versions of the Hamilton Depression Scale (cutoff scores - mild: 8-13; moderate: 14-18; severe: 19-22)15 and Cornell Scale for Depression in Dementia Scale
(CSDD)16. Severity of dementia was rated with the Clinical
Dementia Rating Scale (stages 1 to 3)17. In addition, all subjects
were assessed with the MMSE, verbal fluency test using the animal category (VF), Digit span and Similarities subtests of the WAIS-R, Stroop Test, Rey Auditory Verbal Learning Test (RAVLT) and Rey Complex Figure.
Hamilton Depressive Scale
The Hamilton Depressive Scale is a multiple item question-naire used to provide an indication of severity of depression. The Brazilian version has 17 items, each item is scored from 0 to 4 according to the severity of the symptom15. The
follow-ing topics are evaluated: depressed mood, feelfollow-ings of guilt, sui-cide ideation, insomnia, agitation or retardation, anxiety, weight loss, genital symptoms, somatic symptoms and aware-ness of the disease. Scores higher than 25 indicate severe clas-sification, scores between 18 and 24 define a classification moderate, scores between 7 and 17 indicate mild rating, and scores below 7 represent remission or absence of depression15.
Cornell Scale for Depression in Dementia Scale (CSDD)
The CSDD was developed to assess signs and symptoms of major depression in patients with dementia. This scale has 19 items, each item is rated for severity on a scale of 0-2 (0=absent, 1=mild or intermittent, 2=severe).CSDD eval-uates mood, behavioral disorders, physical signs, cyclic func-tions and ideational disorder16.
Clinical Dementia Rating (CDR)
Cognitive function assessment
Mini-Mental State Examination
The MMSE is a brief screening test for cognitive capabi-lities that evaluates orientation (spatial and time), attention, concentration, memory, calculation, language, and praxis18.
Verbal Fluency
The VF test is a one-minute assessment in which the patient is asked to name as many animals as he can. This test assesses executive functions, semantic memory and lin-guistic abilities19.
Digit span
The digit span subtest is divided in two parts, the first portion assesses attention and immediate memory and the second portion assesses working memory. A series of num-ber sequences are presented to the subject. In the first por-tion of the test, the subject is asked to reproduce the exact sequence, whereas in the second portion he/she is asked to repeat the sequence backwards20.
Similarities
In Similarities, the subject is asked in what way two objects or concepts are alike. This test assesses abstract rea-soning and verbal comprehension20.
Stroop
In this test patients are required to name the ink color in which incongruent color names are printed. The instrument assesses selective attention and concentration, cognitive flexibility and inhibitory control21.
RAVLT
In the RAVLT, there is a sequence of 30 substantives with 15 substantives in each list (list A and list B). The list A is read aloud to the subject five consecutive times. After each reading the subject must say the words to remember. Then a list of interference, list B, is read to the subject, after he/she must say the words to remember (B1). The examiner asks the subject to recall the words from list A (A6). After a 20 or 30 minutes, the examiner asks the subject to remember the words from list A (attempt A7). Then a recognition list (RL) is read and the subject is asked to indicate if the word belongs to list A, or not22. The instrument assesses recent
memory, verbal learning, susceptibility to interference, reten-tion of informareten-tion and recognireten-tion memory22.
Rey-Osterriech Complex Figure
The Rey-Osterrieth complex figure (Rey Figure) is a test used to investigate visual memory, visuospatial ability and some aspects of planning and executive function. In the
present study only the copying task was used. The figure was placed in front of the patient and he was asked to copy the figure as accurately as possible23.
The study was approved by the Ethics Committee of the Institute of Psychiatry of theUniversidade Federal do Rio de Janeiro, and all participants signed informed consent forms before any procedure.
Statistical analysis
A descriptive statistics was initially calculated for the demographic and clinical characteristics of the patients. Kolmogorov-Smirnov and the Levene’s tests were used to investigate the normality and homoscedasticity of the neuro-psychological data, respectively. One-way ANOVA with post-hoc Tukey test (parametric data) and Kruskall-Wallis with post-hoc Tamhane (non-parametric data) were used to com-pare the neuropsychological tests among the groups (MD, AD, depression in AD).
Multivariate regression models were fitted to compare the performance of each group on neuropsychological tests adjusting the data by gender, age, and education. As the attempt to normalize the distribution of the scores failed, negative binomial models were employed with the coeffi-cients expressing the ratio of means of each group compared to the control group.
The analysis was conducted using SPSS1 for Windows (version 17.0) and Stata 12. The significance level accepted in this study was p,0.05.
RESULTS
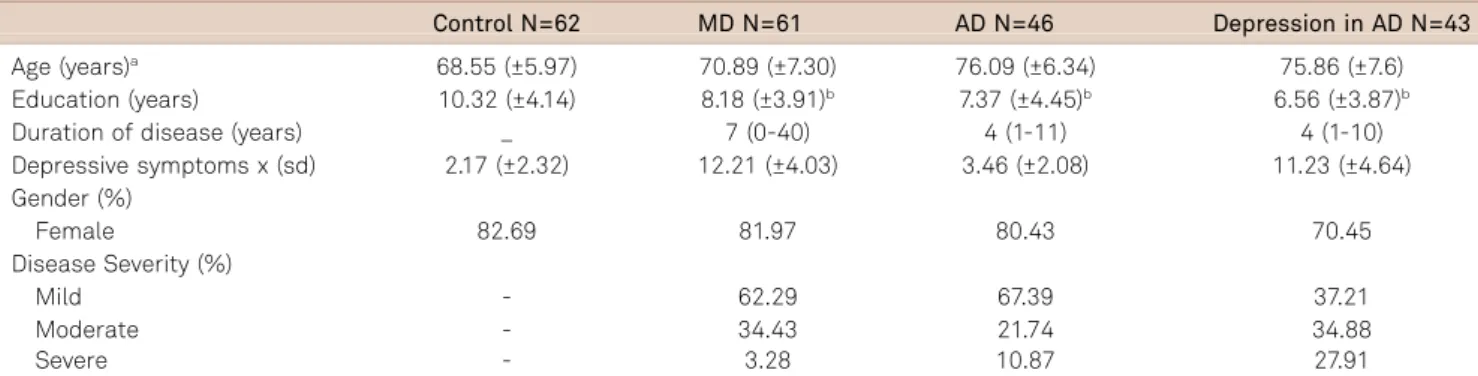
Table 1 presents the demographic and clinical characteris-tics across the four groups. In all groups, most participants were women. The patients in the AD group were signifi-cantly older than in the MD and the control group. Also, MD patients were significantly older than the control group and significantly younger than the depression in AD group. Inversely, education level of the control group was significantly higher than in any other group, whereas the comparison among the other groups revealed no statistical difference with this regard.
As expected, patients with MD and depression in AD showed higher scores on depression symptoms. MD patients had a longer disease duration, followed by the patients of the AD and depression in AD groups. All groups were classified predominantly as mild cases.
Nonetheless, the statistically significant results among all groups were observed in the overall cognitive state as eval-uated by the MMSE. The control group showed a significant
higher cognitive performance in all functions compared to AD and depression in AD. Moreover, the control group showed significantly better results in the assessment of
Table 1.Demographic and clinical characteristics of the patients: mean (±standard deviation).
Control N=62 MD N=61 AD N=46 Depression in AD N=43
Age (years)a 68.55 (±5.97) 70.89 (±7.30) 76.09 (±6.34) 75.86 (±7.6) Education (years) 10.32 (±4.14) 8.18 (±3.91)b 7.37 (±4.45)b 6.56 (±3.87)b
Duration of disease (years) _ 7 (0-40) 4 (1-11) 4 (1-10)
Depressive symptoms x (sd) 2.17 (±2.32) 12.21 (±4.03) 3.46 (±2.08) 11.23 (±4.64) Gender (%)
Female 82.69 81.97 80.43 70.45
Disease Severity (%)
Mild - 62.29 67.39 37.21
Moderate - 34.43 21.74 34.88
Severe - 3.28 10.87 27.91
N: number of patients; MD: major depression; AD: Alzheimer disease;aSignificant differences among groups controlvsAD (p
,0.001); controlvsdepression in AD (p,0.001); MDvsAD (p=0.001); MDvsdepression in AD (p=0.001);bSignificant difference compared to control group (p
,0.05).
Table 2.Cognitive assessment in control group, MD, AD, depression in AD. Value expressed with median (minimum-maximum).
Control MD AD Depression in AD
X2
(p)Post hoc
N; Median (min-max) N; Median (min-max) N; Median (min-max) N; Median (min-máx)
MMSE (score) 62; 29 (24-30) 61; 28 (21-30) 46; 19 (2-28) 43; 13 (0-27) 152.589 (,0.001) bp,0.001 cp
,0.001 dp,0.001 ep
,0.001 fp,0.001 gp=0.025 Verbal fluencya 62; 17.85 (4.89) 61; 15.90 (3.85) 46; 9.98 (5.15) 43; 7.37 (5.56) 52.705 (
,0.001) cp,0.001 dp
,0.001 ep,0.001
fp
,0.001 Digit span (score) 62; 10 (4-23) 61; 8 (4-15) 44; 7 (0-17) 43; 6 (0-14) 53.848 (,0.001)
bp
,0.001 cp,0.001 dp,0.001 fp
,0.001 Digit forward (score) 62; 5.5 (2-13) 61; 4 (1-9) 44; 4 (0-11) 43; 4 (0-8) 24.304 (,0.001)
bp=0.003 cp=0.006 dp
,0.001 Digit backward (score) 62; 5 (1-10) 61; 4 (2-9) 44; 3 (0-6) 43; 2 (0-7) 65.059 (,0.001)
bp=0.002 cp,0.001 dp,0.001 ep=0.009 fp,0.001 Stroop points (sec) 59; 15 (10-32) 61; 23 (12-50) 37; 28 (13-71) 34; 38,5 (13-226) 66,756 (,0.001)
bp,0.001 cp
,0.001 dp,0.001 fp=0.012 Errors-stroop points 59; 0 (0-2) 61; 0 (0-0) 37; 0 (0-7) 34; 0.5 (0-19) 33,769 (,0.001)
dp=0.008 fp=0.007 gp=0.021
Continuation
Stroop words (sec) 59; 20 (12-32) 61; 25 (13-59) 37; 34 (15-108) 34; 49.5 (14-144) 75,628 (,0.001) ap,0.001 cp
,0.001 dp,0.001 ep=0.030 fp,0.001 Errors-stroop words 59; 0 (0-1) 61; 0 (0-2) 37; 0 (0-24) 34; 1.5 (0-23) 51.105 (,0.001)
dp,0.001 fp=0.002 Stroop colors (sec) 59; 31 (19-58) 61; 38 (18-126) 37; 48 (20-118) 35; 57 (21-249) 46.931(,0.001)
bp=0.001 cp
,0.001 dp,0.001 fp=0.008 Errors-stroop colors 59; 0 (0-18) 61; 0 (0-13) 37; 4 (0-24) 35; 7.5 (0-24) 64,621(,0.001)
cp=0.004 dp,0.001 ep=0.001 fp
,0.001 RAVLTa(list A1-A5) 62; 43.82 (12.51) 61; 36.28 (11.03) 42; 19.24 (8.99) 40; 13.57 (10.52) 81.633(,0.001)
bp=0.003 cp,0.001 dp
,0.001 ep,0.001 fp,0.001 RAVLT B 62; 5 (1-12) 61; 5 (0-10) 41; 2 (0-5) 40; 1 (0-5) 102.852 (,0.001)
bp=0.40 cp
,0.001 dp,0.001 ep
,0.001 fp,0.001 RAVLT A6 62; 8.5 (2-14) 61; 7 (0-13) 41; 1 (0-6) 40; 0 (0-6) 129.420 (,0.001)
bp=0.004 cp,0.001 dp
,0.001 ep,0.001 fp
,0.001 RAVLT A7 62; 9 (0-15) 61; 6 (0-14) 41; 0 (0-7) 40; 0 (0-4) 130.106(,0.001)
cp
,0.001 dp,0.001 ep
,0.001 fp
,0.001 RAVLT LR 62; 14 (4-18) 60; 13 (5-15) 37; 11 (0-15) 26; 6.5 (0-15) 53.187 (,0.001)
cp
,0.001 dp,0.001 ep=0.001 fp,0.001 Similaritiesa 62; 16.16 (5.55) 61; 16.18 (5.85) 25; 8.24 (5.47) 12; 5.25 (3.49) 25.279 (
,0.001) cp,0.001 dp,0.001 ep
,0.001 fp,0.001 Rey figure 61; 31 (8-36) 60; 26.5 (3-34) 22; 18 (0-34) 14; 6.5 (0-34) 29.344(,0.001)
bp=0.008 cp=0.004 dp=0.003 fp=0.025
Kruskal-Wallis Test (Values in median and minimum-maximum); *Anova Oneway (Values in mean and standard deviation)
asignificant difference from control group compared to MD;bsignificant difference from control group compared to AD;csignificant difference from control
group compared to Depression in AD;dsignificant difference from MD compared to AD;esignificant difference from MD compared to Depression in AD; fsignificant difference from AD compared to Depression in AD.
attention and working memory (Digit Span, Digit Forward, Digit Backward), processing speed (Stroop), learning and verbal memory (RAVLT A1-A5), immediate recall (RAVLT B), recall after interference (RAVLT A6) and visuospatial abil-ity and planning (Rey Figure) as compared to the MD group. The MD group showed a significantly higher performance in verbal fluency (FV), in all memory evaluations (Digit Backward, RAVLT A1-A5; RAVLT B; RAVLT B; RAVLT A6; RAVLT A7; RAVLT LR), as well as in processing speed (Stroop words), inhibitory control (Errors-stroop colors), and abstract reasoning (Similarities) when compared to the AD group. The MD group showed a significant higher cognitive performance in all functions compared to depression in AD, except for the assessment of attention (Digit Forward).
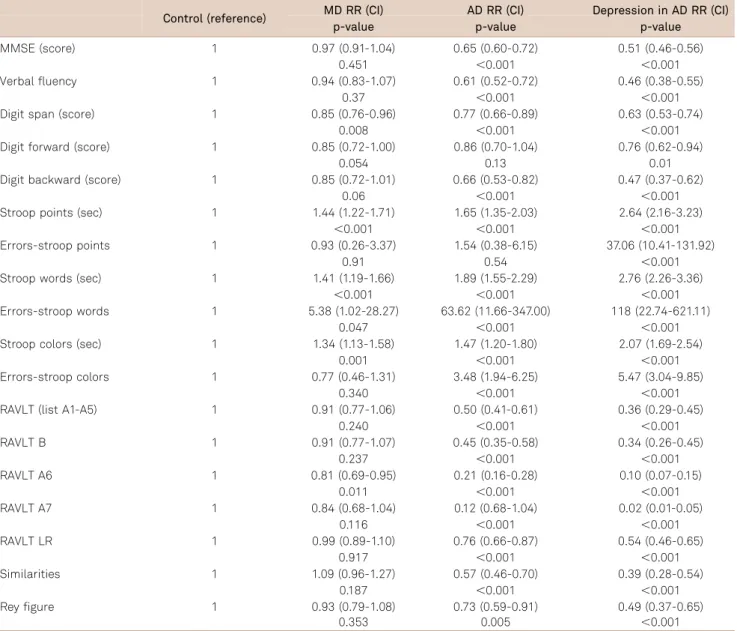
As some factors such as age, education, and gender may influence the cognitive performance, we calculated the
adjusted ratio of means of the scores using the control group as the reference (Table 3). For example, in Table 3 the observed ratio of means for MMSE (0.97, 0.65 and 0.51) indi-cates that the mean of the MD group is 3% smaller than in the control group (1-0.97). Nevertheless, this finding was not statistically significant (p=0.45). On the other hand, for the AD group, the mean of MMSE was 45% smaller than in the control group (1-0.65), reaching statistical significance (p,0.001).
Unlike the unadjusted data (Table 2), the difference in cognitive performance between the MD and control groups was no longer statistically significant for the cognitive status (MMSE), learning and verbal memory (RAVLT A1-A5), immediate recall (RAVLT B1), visual spatial ability and plan-ning (Rey figure) after the control for gender, age, and edu-cation (Table 3). When the AD group was compared to the
Table 3.Ratio of means adjusted for age, gender, and education (Reference: control group).
Control (reference) MD RR (CI) AD RR (CI) Depression in AD RR (CI)
p-value p-value p-value
MMSE (score) 1 0.97 (0.91-1.04) 0.65 (0.60-0.72) 0.51 (0.46-0.56)
0.451 ,0.001 ,0.001
Verbal fluency 1 0.94 (0.83-1.07) 0.61 (0.52-0.72) 0.46 (0.38-0.55)
0.37 ,0.001 ,0.001
Digit span (score) 1 0.85 (0.76-0.96) 0.77 (0.66-0.89) 0.63 (0.53-0.74)
0.008 ,0.001 ,0.001
Digit forward (score) 1 0.85 (0.72-1.00) 0.86 (0.70-1.04) 0.76 (0.62-0.94)
0.054 0.13 0.01
Digit backward (score) 1 0.85 (0.72-1.01) 0.66 (0.53-0.82) 0.47 (0.37-0.62)
0.06 ,0.001 ,0.001
Stroop points (sec) 1 1.44 (1.22-1.71) 1.65 (1.35-2.03) 2.64 (2.16-3.23)
,0.001 ,0.001 ,0.001
Errors-stroop points 1 0.93 (0.26-3.37) 1.54 (0.38-6.15) 37.06 (10.41-131.92)
0.91 0.54 ,0.001
Stroop words (sec) 1 1.41 (1.19-1.66) 1.89 (1.55-2.29) 2.76 (2.26-3.36)
,0.001 ,0.001 ,0.001
Errors-stroop words 1 5.38 (1.02-28.27) 63.62 (11.66-347.00) 118 (22.74-621.11)
0.047 ,0.001 ,0.001
Stroop colors (sec) 1 1.34 (1.13-1.58) 1.47 (1.20-1.80) 2.07 (1.69-2.54)
0.001 ,0.001 ,0.001
Errors-stroop colors 1 0.77 (0.46-1.31) 3.48 (1.94-6.25) 5.47 (3.04-9.85)
0.340 ,0.001 ,0.001
RAVLT (list A1-A5) 1 0.91 (0.77-1.06) 0.50 (0.41-0.61) 0.36 (0.29-0.45)
0.240 ,0.001 ,0.001
RAVLT B 1 0.91 (0.77-1.07) 0.45 (0.35-0.58) 0.34 (0.26-0.45)
0.237 ,0.001 ,0.001
RAVLT A6 1 0.81 (0.69-0.95) 0.21 (0.16-0.28) 0.10 (0.07-0.15)
0.011 ,0.001 ,0.001
RAVLT A7 1 0.84 (0.68-1.04) 0.12 (0.68-1.04) 0.02 (0.01-0.05)
0.116 ,0.001 ,0.001
RAVLT LR 1 0.99 (0.89-1.10) 0.76 (0.66-0.87) 0.54 (0.46-0.65)
0.917 ,0.001 ,0.001
Similarities 1 1.09 (0.96-1.27) 0.57 (0.46-0.70) 0.39 (0.28-0.54)
0.187 ,0.001 ,0.001
Rey figure 1 0.93 (0.79-1.08) 0.73 (0.59-0.91) 0.49 (0.37-0.65)
0.353 0.005 ,0.001
control group controlling for the influence of gender, age, and education, the difference for attention performance (Digit forward) also was no longer statistically significant.
We further calculated the ratio of means adjusted for age, education, and gender using the MD group as the reference (Table 4). After the adjustment, the AD and depression in AD groups showed the same results observed in Table 2.
DISCUSSION
According to our initial hypothesis, the cognitive per-formance of the groups showed a decreasing gradient, from the control group as the most preserved one to the depres-sion in AD group as the most affected one. The overall cog-nitive status as measured by the MMSE was the domain
which obtained a statistically significant result among all groups. Furthermore, the MD group showed intermediate performance between the controls and the AD group in the overall cognitive state, as measured by verbal fluency and abstract reasoning. The patients with AD and MD showed no difference in attention and visuospatial ability and planning, i.e., an aspect of executive function.
Some studies have shown that there are significant differ-ences between healthy elderly and MD patients24,25as well as
between healthy elderly and AD patients26. Similar to our
findings, other studies have found that MD elderly patients showed deficits in attention and in the executive function when compared to healthy elderly27. Additionally, AD
patients showed impairment in different cognitive functions when compared to healthy elderly, including test perform-ance of verbal fluency28, abstract reasoning and memory29.
Table 4.Ratio of means after the adjustment for age, gender and education (Reference: MD group).
MD (reference) AD RR (CI) Depression in AD RR (CI)
p-value p-value
MMSE (score) 1 0.68 (0.60-0.76) 0.53 (0.47-0.59)
,0.001 ,0.001
Verbal fluency 1 0.63 (0.52-0.76) 0.46 (0.37-0.57)
,0.001 ,0.001
Digit total (score) 1 0.90 (0.77-1.05) 0.74 (0.62-0.87)
0.175 ,0.001
Digit forward (score) 1 1,00 (0.82-1.21) 0.89 (0.72-1.10)
0.991 0.300
Digit backward (score) 1 0.78 (0.63-0.98) 0.57 (0.44-0.73)
0.033 ,0.001
Stroop points (sec) 1 1.15 (0.94-1.42) 1.84 (1.49-2.27)
0.179 ,0.001
Erros-stroop points 1 1.74 (0.46-6.51) 44.14 (12.29-158.56)
0.411 ,0.001
Stroop words (sec) 1 1.34 (1.09-1.65) 1.96 (1.59-2.41)
0.005 ,0.001
Errors-stroop words 1 12.34 (4.16-36.64) 22.41 (8.17-61.42)
,0.001 ,0.001
Stroop colors (sec) 1 1.09 (0.89-1.35) 1.55 (1.25-1.92)
0.401 ,0.001
Errors-stroop colors 1 4.66 (2.74-7.91) 7.96 (4.69-13.49)
,0.001 ,0.001
RAVLT (list A1-A5) 1 0.55 (0.44-0.69) 0.39 (0.31-0.50)
,0.001 ,0.001
RAVLT B 1 0.49 (0.38-0.62) 0.37 (0.28-0.49)
,0.001 ,0.001
RAVLT A6 1 0.25 (0.18-0.34) 0.12 (0.08-0.17)
,0.001 ,0.001
RAVLT A7 1 0.13 (0.087-0.20) 0.02 (0.01-0.06)
,0.001 ,0.001
RAVLT LR 1 0.77 (0.66-0.91) 0.55 (0.45-0.68)
0.002 ,0.001
Similarities 1 0.50 (0.39-0.64) 0.34 (0.24-0.49)
,0.001 ,0.001
Rey figure 1 0.78 (0.58-1.05) 0.53 (0.37-0.76)
0.105 0.001
The elderly with MD showed significant better results compared to the AD group in tasks that assessed memory function. Likewise, the AD group showed significantly higher result compared to the depression in AD group in overall cognitive status assessed by the MMSE. This is in line with several other studies which demonstrated that MD elderly have a better performance than AD patients, especially in tasks that assess information retention and recall5, even
though both groups have similar attentional deficits5.
Studies which compared patients with depression in AD with healthy and MD elderly also observed an extensive cog-nitive impairment involving several functions including attention, executive function, and memory in the patients with both disorders compared with the healthy elderly and those with depression alone30,31. Also in line with our results,
other studies have not found differences between patients with AD and depression in AD in specific cognitive functions such as verbal fluency, attention, executive functions and memory10.
However, in the present study the AD group showed signific-antly better results compared to the depression in AD group in overall cognitive status assessed by the MMSE. A similar finding have also been reported by Rapp8et al.
To the best of our knowledge, only one other study32has
compared all these groups of patients as we have done. However, their objective was to evaluate the usefulness of standardized neuropsychological tests in the psychometric differentiation of patients32.
The present study has some limitations that should be acknowledged. First, the MD group was composed of elderly people with geriatric depression and recurrent depression. From previous research we know that patients with recur-rent depression have atrophy of hippocampus and they have a higher risk of developing dementia. There is a strong link between geriatric depression and cerebrovascular changes,
which in turn could lead to vascular dementia. Some of the patients in the depressed group could have a subclinical dementia, either AD or vascular dementia. Moreover, we did not control for severity of dementia in the AD and depres-sion in AD groups, including mild, moderate, and severe dementia, which may have influenced the cognitive per-formance. Also, the severity of depression in the MD and depression in AD groups was not controlled for. Finally, the cross-sectional design does not allow us to make any conclusion that there is a worsening along the spectrum which goes from healthy to Depression in AD groups. Longitudinal studies may come to a better understanding of this problem.
The severity gradient observed in some cognitive func-tions in this study may serve for further research using pro-spective designs. Also there is a clinical relevance in showing that cognitive functions may be further affected by depres-sion in the presence of AD, meaning that treating depresdepres-sion in those cases is important to relieve some of the handicaps. As the group of patients with both depression and AD had the worst performance in cognition this could indicate that these patients have the worst prognosis, or maybe also a faster progression of dementia than those suffering from AD without depression. Previous studies have shown that the conversion rate from MCI to dementia is higher among those with MCI with comorbid depression33and one
clinic-pathological study also showed that AD patients with a his-tory of depression in life had more plaques and tangles com-pared to AD patients with no history of depression in life12.
Suggestions have been put forward that common low grade inflammation seen in depression and AD could explain this faster progression in patients with both disorders. Future longitudinal observational studies and treatment trials should examine this hypothesis.
References
1. Korczyn AD, Halperin I. Depression and dementia. J Neurol Sci 2009;283:139-142.
2. Kessing LV, Andersen PK. Does the risk of developing dementia increase with the number of episodes in patients with depressive disorder and in patients with bipolar disorder? J Neurol Neurosurg Psychiatr 2004;75:1662-1666.
3. Verkaik R, Nuyen J, Schellevis F, Francke A. The relationship between severity of Alzheimer’s disease and prevalence of comorbid depress-ive symptoms and depression: a systematic review. Int J Geriatr Psychiatry 2007;22:1063-1086.
4. Weisenbach SL, Boore LA, Kales HC. Depression and cognitive impairment in older adults. Curr Psychiatry Rep 2012;14:280-288.
5. Wright SL, Persad C. Distinguishing between depression and
dementia in older persons: neuropsychological and neuropathologi-cal correlates. J Geriatr Psychiatry Neurol 2007;20:189-198.
6. Ashendorf L, Jefferson AL, O’Connor MK, Chaisson C, Green RC, Stern RA. Trail Making Test errors in normal aging, mild cognitive impairment, and dementia. Arch Clin Neuropsychol 2008;23:129-137.
7. Sierksma AS, van den Hove DL, Steinbusch HW, Prickaerts J. Major depression, cognitive dysfunction and Alzheimer’s disease: is there a link? Eur J Pharmacol 2010;626:72-82.
8. Rapp MA, Schnaider-Beeri M, Wysocki M, et al. Cognitive decline in patients with dementia as a function of depression. Am J Geriatr Psychiatry 2011;19:357-363.
9. Spalletta G, Caltagirone C, Girardi P, Gianni W, Casini AR, Palmer K. The role of persistent and incident major depression on rate of cognitive deterioration in newly diagnosed Alzheimer’s disease patients. Psychiatry Res 2012;198:263-268.
10. Powlishta KK, Storandt M, Mandernach TA, Hogan E, Grant EA, Morris JC. Absence of effect of depression on cognitive performance in early-stage Alzheimer disease. Arch Neurol 2004;61:1265-1268.
11. Berger AK, Fratiglioni L, Winblad B, Bäckman L. Alzheimer’s disease and depression: preclinical comorbidity effects on cognitive func-tioning. Cortex 2005;41:603-612.
13. APA. Manual diagnóstico e estatístico de transtornos mentais. 4thed. Porto Alegre: Artes Médicas; 1995.
14. McKhann G, Drachman D, Folstein M, R Katzman, Preço D, Stadlan EM. Clinical diagnosis of Alzheimer’s disease: report of the NINCDSADRDA. Work Group under the auspices of Department of Health and Human Services Task Force on Alzheimer’s Disease. Neurology 1984;34:939-944.
15. Moreno RA, Moreno DH. Escalas de depressão de Montgomery & Asberg (MADRS) e de Hamilton (HAM-D). Rev Psiquiatr Clín 1998;25:262-272.
16. Carthery-Goulart MT, Areza-Fegyveres R, Schultz RR, et al. Versão brasileira da Escala Cornell de Depressão em Demência (Cornell Depression Scale in Dementia). Arq Neuropsiquiatr 2007;65:912-915.
17. Chaves MLF, Camozzato AL, Godinho C, et al. Validity of the Clinical Dementia Rating Scale for the detection and staging of dementia in brazilian patients. Alzheimer Dis Assoc Disor 2007;21:210-217.
18. Bertolucci PHF, Brucki SMD, Campacci SR, Juliano Y. O Mini-Exame do Estado Mental em uma população geral: impacto da escolaridade. Arq Neuro Psiquiatr 1994;52:1-7.
19. Brucki SM, Rocha MS. Category fluency test: effects of age, gender and education on total scores, clustering and switching in Brazilian Portuguese-speaking subjects. Braz J Med Biol 2004;37:1771-1777.
20. Wechsler D. Wechsler Adult Intelligence Scale – Revised manual
(WAIS-R). New York: The Psychological Corporation; 1981.
21. Spreen O, Strauss E. Compendium of Neuropsychological Tests: Administration, Norms, and Commentary. New York: Oxford University Press; 1998.
22. Malloy-Diniz LFM, Cruz MF, Torres VM, Cosenza RM. O teste de aprendizagem auditivo-verbal de Rey: normas para uma população brasileira. Rev Bras Neurol 2000;36:79-83.
23. Oliveira MS, Rigoni MS. Figuras Complexas de Rey: teste de cópia e de reprodução de memória de figuras geométricas complexas. São Paulo: Casa do Psicólogo; 2010.
24. Baudic S, Tzortzis C, Barba GD, Traykov L. Executive deficits in elderly patients with major unipolar depression. J Geriatr Psychiatry Neurol 2004;17:195-201.
25. Naismith SL, Longley WA, Scott EM, Hickie IB. Disability in major depression related to self-rated and objectively-measured cognitive deficits: a preliminary study. BMC Psychiatry 2007;7:1-7.
26. Estévez-González A, Kulisevsky J, Boltes A, Otermín P, García-Sánchez C. Rey verbal learning test is a useful tool for differential diagnosis in the preclinical phase of Alzheimer’s disease: comparison with mild cognitive impairment and normal aging. Int J Geriat Psychiatry 2003;18:1021-1028.
27. Elderkin-Thompson V, Mintz J, Haroon E, Lavretsky H, Kumar A. Executive dysfunction and memory in older patients with major and minor depression. Arch Clin Neuropsychol 2006;21:669-676.
28. Gomez RG, White DA. Using verbal fluency to detect very mild dementia of the Alzheimer type. Arch Clin Neuropsychol 2006;21:771-775.
29. Rabin LA, Wang C, Katz MJ, Derby CA, Buschke H, Lipton RB. Predicting Alzheimer’s disease: neuropsychological tests, self-reports, and informant reports of cognitive difficulties. J Am Geriatr Soc 2012;60:1128-1134.
30. Visser PJ, Verhey FR, Ponds RW, Kester A, Jolles J. Distinction between preclinical Alzheimer’s disease and depression. J Am Geriatr Soc 2000;48:479-484.
31. Hall JR, O’Bryant SE, Johnson LA, Barber RC. Depressive Symptom Clusters and Neuropsychological Performance in Mild Alzheimer’s and Cognitively Normal Elderly. Depress Res Treat 2011;1-6.
32. desRosiers G, Hodges JR, Berrios G. The neuropsychological differentiation of patients with very mild Alzheimer’s disease and/ or major depression. J Am Geriatr Soc 1995;43:1256-1263.