Factors Associated with Increased Radial Augmentation Index in
Hypertensive Individuals
Renan Oliveira Vaz-de-Melo
1, Adriana Giubilei Pimenta
1, Luiz Tadeu Giollo Júnior
1, Débora Dada Martinelli
1,
Carolina Neves Cosenso Sacomani
1, Juan Carlos Yugar-Toledo
1, José Paulo Cipullo
1, Marco Antônio Mota Gomes
3,
Heitor Moreno Júnior
2, José Fernando Vilela Martin
1Clínica de Hipertensão - Departamento de Medicina Interna, Faculdade de Medicina de São José do Rio Preto - FAMERP1, São Paulo SP; Laboratório de Farmacologia Cardiovascular – Faculdade de Ciências Médicas - Universidade Estadual de Campinas – UNICAMP2, Campinas, SP; Universidade Estadual de Ciências da Saúde de Alagoas – UNCISAL3, Maceió, AL, Brazil
Abstract
Background: Arterial stiffness is a variable predictor of morbidity and mortality and a possible marker of vascular injury. Its non-invasive assessment by radial tonometry and analysis of the augmentation index (r-AI) allows identifying patients exposed to higher cardiovascular risk.
Objective: To analyze the influence of r-AI on clinical-biochemical variables and its influence on the prevalence of target-organ damage in hypertensive patients.
Methods: 140 consecutive hypertensive patients, followed-up in an outpatient clinic, were analyzed in a cross-sectional study. Blood pressure (BP) levels and r-AI were obtained by applanation tonometry of the radial artery (HEM-9000AI, Onrom). The patients were allocated into r-AI tertiles (r-AI ≤ 85%; 85 < r-AI ≤ 97%; r-AI > 97%).
Results: The sample was predominantly composed of women (56.4%), mean age of 61.7 ± 11.7 years and body mass
index 29.6 ± 6.1 Kg/m2. The highest tertile showed higher proportion of women (p = 0.001), higher systolic BP (p = 0.001)
and pulse pressure (p = 0.014), and lower weight (p = 0.044), height (p < 0.001) and heart rate (p < 0.001). Multivariate analysis demonstrated that weight (β = -0.001, p = 0.017), heart rate (β = -0.001, p = 0.007) and central pressure (β= 0.015, p < 0.001) correlated independently with r-AI. In logistic regression analyses, the 3rd r-AI tertile was associated to lower levels of diabetes (DM) (OR = 0.41; 95% CI 0.17-0.97; p = 0.042).
Conclusions: This study demonstrated that weight. heart rate and central BP were independently related to r-AI. (Arq Bras Cardiol 2011; 97(3) : 241-248)
Keywords: Arteries / physiopathology; blood pressure; elasticity; hypertension; coronary artery disease.
Mailing Address: Renan Oliveira Vaz-de-Melo •
Rua Professor Enjolrras Vampré. 201 Apt. 44 Bl. 3 - Vila Santa Cândida - 15091-290 - São José do Rio Preto, SP, Brazil
E-mail: [email protected]
Manuscript received September 13, 2010, revised manuscript received January 27, 2011, accepted March 15. 2011.
Introduction
Since the publication of the Conduit Artery Function Evaluation (CAFE) study1, the importance of assessment
of arterial function and central blood pressure increased substantially. Despite the fact that brachial blood pressure is a powerful predictor of cardiovascular morbidity and mortality2, these measurements do not reflect the pressure in
the central circulation. Recent evidence showed that central blood pressure is more relevant to cardiovascular outcomes than pressures in the brachial artery1,3,4.
It is well recognized that arterial stiffness parameters predict clinical outcomes, such as coronary artery disease5,6, stroke6,
urinary albumin excretion7,8, progression of chronic kidney
disease9, survival in end-stage renal disease10 and general
cardiovascular risk11. The current standard for assessing this
condition involves the measurement of several variables by noninvasive applanation tonometry, including the radial augmentation index (r-AI)12. r-AI, which is defined as an
increase in pressure from the first systolic shoulder to the peak pressure of the aortic pressure waveform expressed as a percentage of peak pressure, has been correlated with left ventricular hypertrophy (LVH)13, coronary artery disease5,
urinary albumin excretion14, cardiovascular events15,16 and
all-cause mortality16, representing an easier and quicker method to access the central pressure17,18.
Despite the fact that some variables such as age19,20,
height11,18,20, heart rate11,19,21-24, gender11,18,19,21, systolic
(SBP)20 and diastolic blood pressure (DBP)11,19,20 have been
Methods
Subjects
A total of 140 consecutive hypertensive patients, aged
≥ 18 years, followed-up in an outpatient clinic from
August/2009 to January/2010, were analyzed in a cross-sectional study. The study was previously approved by the Research Ethics Committee of the institution and all participants signed an informed consent. Individuals were allocated to three groups according r-AI tertiles: Group 1
(r-AI ≤ 85%) – 44 patients; Group 2 (85 < r-AI ≤ 97%) – 47 patients; Group 3 (r-AI > 97%) – 49 patients. The exclusion
criteria were: history of atrial fibrillation or frequent supra- or ventricular premature beats for which accurate radial
waveforms could not be obtained by the system, age ≥ 70
years and secondary hypertension.
Biochemical analysis, demographic data and target-organ damage
Peripheral blood was drawn in fasting for biochemical analysis of serum creatinine, total cholesterol, HDL-cholesterol, triglycerides and glucose. LDL-cholesterol was calculated by the Friedewald formula. Urinary albumin excretion (UAE) was determined by 24-h urine sample, considering
normoalbuminuria as UAE < 20 µg/min, microalbuminuria as UAE between 20 and 200 µg/min and macroalbuminuria as UAE ≥ 200 µg/min.
For the assessment of comorbidities, data regarding the presence of diabetes mellitus, medications in usage, body mass index [BMI = weight (kg) / height (cm)2], gender and
other risk factors or necessary information were obtained from the medical record. Patients with diabetes mellitus (DM) were considered to be those who had been previously on
hypoglycemic treatment or having fasting glucose levels ≥
126 mg/dL on at least two occasions.
The estimated glomerular filtration rate (eGFR) was calculated using the abbreviated MDRD (Modification on Diet in Renal Disease) formula. Renal failure was
defined as eGFR ≤ 60 mL/min. LVH was determined by
echocardiography, the normal left ventricular mass index
(LVMI) for men was < 103 g/m2 and for women < 89 g/m2,
as suggested by the American Society of Echocardiography25.
Pulse wave and blood pressure analysis
Arterial pulse waveforms of the left radial artery were measured non-invasively by an automated tonometric
system (HEM-9000AI; Omron Healthcare Co., Ltd.,
Kyoto, Japan) after 10 min of rest in a sitting position12.
Pulse wave analyses were performed at least three times and the mean of measurements was analyzed. Radial arterial waveforms from this device, the first (P1) and late (second) systolic peaks (P2) were automatically identified using the fourth derivative wave as the second and third zero crossing points, respectively. Augmentation index (AI) was defined as the ratio of the height of P2 to that of P1. Brachial blood pressure (BP) and heart rate were measured simultaneously in the right brachium with an oscillometric
device incorporated into the HEM-9000 AI. Late systolic BP in the radial artery (rSBP2), as an index of central BP26,
was calculated by the following equation: rSBP2 = r-AI ×
(SBP−DBP) + DBP, in which SBP and DBP are brachial
systolic and diastolic BP, respectively. All measurements were performed after at least 8-h fasting.
Statistical analysis
The calculated size of the sample, admitting a deviation
of 1% to reject the hypothesis of nullity, was 122 patients.
Previous studies exploring similar issues7,21 analyzed a sample
size similar to this study. Descriptive analysis was performed for qualitative variables and quantitative results are presented as mean ± standard deviations. To compare the characteristics
of patients ANOVA for quantitative and χ2 for qualitative
variables were used. Univariate and multivariate analyses were performed to assess the determinants of r-AI using various clinical variables. The variables that were statistically significant
(p < 0.05) in the univariate analysis were then evaluated in
the multivariate analysis. All statistical analyses were performed using the Minitab 16.0 statistical software. For all tests, a p
value < 0.05 was considered significant.
Results
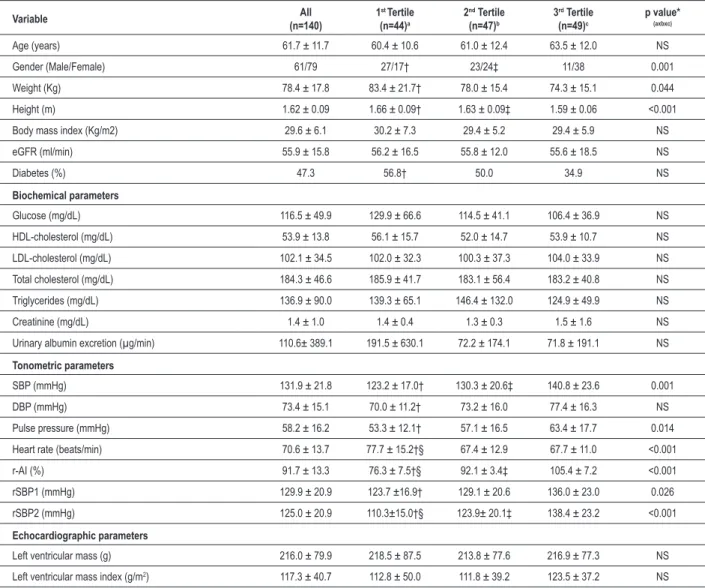
Table 1 shows the clinical and biochemical characteristics of the patients according to the tertiles of r-AI. There was an increase in the proportion of women into the highest tertile, with increasing levels of SBP and pulse pressure. In contrast, there was a progressive reduction in weight, height and heart rate with increasing r-AI, with no significant differences for biochemical and echocardiographic parameters. There were no differences in the history of diabetes, renal failure, LVH or alterations in urinary albumin excretion among tertiles (Table 2), with the exception of a higher prevalence of LVH in the 3rd tertile of r-AI in relation
to the 2nd tertile (p = 0.026).
Using logistic regression analyses (Table 3), the third tertile of
r-AI were associated with lower risk of diabetes mellitus (OR = 0.41; 95% CI 0.17-0.97; p = 0.042). There was no statistical significance (p > 0.05) for LVH and renal failure in the logistic
regression.
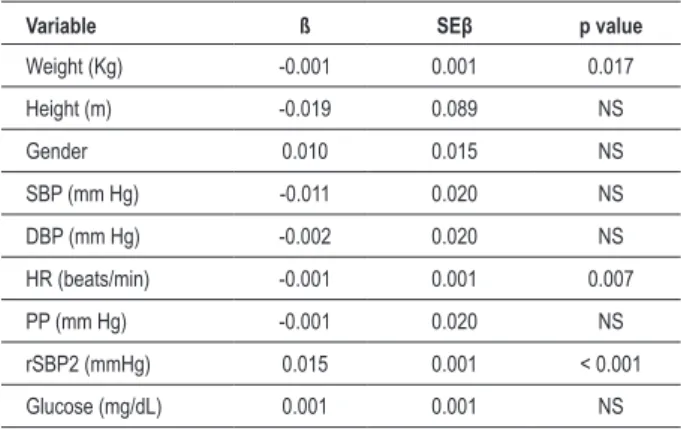
Univariate (Table 4) and multivariate (Table 5) analyses were performed to assess factors determining r-AI. Univariate analysis showed that weight, height, gender, SBP, DBP, heart rate, pulse pressure, rSBP2 and glucose significantly correlated with r-AI. However, multivariate analysis demonstrated that only weight, heart rate and rSBP2 remained independently correlated with r-AI. Figures 1 and 2 show the relationship between r-AI with the variables that showed significance in the univariate analysis.
Discussion
In this study, we analyzed factors related to r-AI in a sample of hypertensive patients. The measure of arterial compliance through radial artery tonometry is a simple and easier method to assess arterial stiffness17,18. AI is strongly correlated with a
previously validated estimate of arterial stiffness, pulse wave velocity (PWV)12,18. Its use to assess cardiovascular risk and
gives additional data for the stratification of cardiovascular risk and allows clinicians to customize antihypertensive therapies specifically to a single patient1,2,17.
Recent reports show that AI is closely related with cardiovascular risk11,16. London et al16 found that the risk ratio for each 10%
increase in AI was 1.51 (95% CI 1.23-1.86) for all-cause mortality and 1.48 (95% CI 1.16-1.90) for cardiovascular mortality in a
sample of end-stage renal failure patients. Nürnberger et al11,
on the other hand, found that AI significantly increased with increasing risk scores for cardiovascular disease.
Some studies have shown values that could be considered
normal for AI using limits of normality based on the 95%
confidence interval. Wojciechowska et al26 in a European sample,
proposed the value for peripheral AI of 90% for men and 100%
for women. Shiburi et al27 in a study which included black South
Africans, proposed the thresholds to diagnose increased arterial
stiffness the value at age 30 years of 100% for peripheral AI, with adjustment by 10% for each decade that age differs from
30 years. Li et al28 in a sample of 924 Chinese patients without
cardiovascular disease demonstrated the approximate values for
normal peripheral AI of 105% in a 40-year-old patient. Finally,
Chung et al29 demonstrated in a Korean sample that peripheral
AI of 100% may be the preliminary reference values. Despite
these data, the estimation of reference values for peripheral AI in this Brazilian sample was not possible due to be a hypertensive sample with multiple comorbidities, which would prevent the validation of such data.
According to previous studies, r-AI was significantly related to weight, height11,18, gender11,18,19,21,28-30, heart
rate11,19,21-23, SBP23,30 and DBP11,19, pulse pressure and glucose
levels in univariate analyses. In this study, this association remained significant only for weight, height and heart rate in multivariate analyses. Body composition affects the timing of
Table 1 – Comparison between clinical and biochemical variables among the tertiles of augmentation index
Variable All
(n=140)
1st Tertile
(n=44)a
2nd Tertile
(n=47)b
3rd Tertile
(n=49)c
p value*
(axbxc)
Age (years) 61.7 ± 11.7 60.4 ± 10.6 61.0 ± 12.4 63.5 ± 12.0 NS
Gender (Male/Female) 61/79 27/17† 23/24‡ 11/38 0.001
Weight (Kg) 78.4 ± 17.8 83.4 ± 21.7† 78.0 ± 15.4 74.3 ± 15.1 0.044
Height (m) 1.62 ± 0.09 1.66 ± 0.09† 1.63 ± 0.09‡ 1.59 ± 0.06 <0.001
Body mass index (Kg/m2) 29.6 ± 6.1 30.2 ± 7.3 29.4 ± 5.2 29.4 ± 5.9 NS
eGFR (ml/min) 55.9 ± 15.8 56.2 ± 16.5 55.8 ± 12.0 55.6 ± 18.5 NS
Diabetes (%) 47.3 56.8† 50.0 34.9 NS
Biochemical parameters
Glucose (mg/dL) 116.5 ± 49.9 129.9 ± 66.6 114.5 ± 41.1 106.4 ± 36.9 NS
HDL-cholesterol (mg/dL) 53.9 ± 13.8 56.1 ± 15.7 52.0 ± 14.7 53.9 ± 10.7 NS
LDL-cholesterol (mg/dL) 102.1 ± 34.5 102.0 ± 32.3 100.3 ± 37.3 104.0 ± 33.9 NS
Total cholesterol (mg/dL) 184.3 ± 46.6 185.9 ± 41.7 183.1 ± 56.4 183.2 ± 40.8 NS
Triglycerides (mg/dL) 136.9 ± 90.0 139.3 ± 65.1 146.4 ± 132.0 124.9 ± 49.9 NS
Creatinine (mg/dL) 1.4 ± 1.0 1.4 ± 0.4 1.3 ± 0.3 1.5 ± 1.6 NS
Urinary albumin excretion (µg/min) 110.6± 389.1 191.5 ± 630.1 72.2 ± 174.1 71.8 ± 191.1 NS
Tonometric parameters
SBP (mmHg) 131.9 ± 21.8 123.2 ± 17.0† 130.3 ± 20.6‡ 140.8 ± 23.6 0.001
DBP (mmHg) 73.4 ± 15.1 70.0 ± 11.2† 73.2 ± 16.0 77.4 ± 16.3 NS
Pulse pressure (mmHg) 58.2 ± 16.2 53.3 ± 12.1† 57.1 ± 16.5 63.4 ± 17.7 0.014
Heart rate (beats/min) 70.6 ± 13.7 77.7 ± 15.2†§ 67.4 ± 12.9 67.7 ± 11.0 <0.001
r-AI (%) 91.7 ± 13.3 76.3 ± 7.5†§ 92.1 ± 3.4‡ 105.4 ± 7.2 <0.001
rSBP1 (mmHg) 129.9 ± 20.9 123.7 ±16.9† 129.1 ± 20.6 136.0 ± 23.0 0.026
rSBP2 (mmHg) 125.0 ± 20.9 110.3±15.0†§ 123.9± 20.1‡ 138.4 ± 23.2 <0.001
Echocardiographic parameters
Left ventricular mass (g) 216.0 ± 79.9 218.5 ± 87.5 213.8 ± 77.6 216.9 ± 77.3 NS
Left ventricular mass index (g/m2) 117.3 ± 40.7 112.8 ± 50.0 111.8 ± 39.2 123.5 ± 37.2 NS
arterial wave reflection, explaining the correlation between r-AI and weight and height31. Gatzka et al32 studied pairs of
older men and women matched by age, BMI, and BP levels, and found that women had stiffer elastic arteries, suggesting an effect of female hormonal status in this relationship31.
Other factors previously related to AI levels, such as
age19,29,30, BMI30, creatinine clearance30, hiperlipidemia29,30
and LVMI21 were not associated with r-AI levels in this
sample. Aging is associated with histological changes in walls of systemic arteries, mainly in the intima and the in the media. These structural changes in the elastic arteries cause
an increase in both stiffness and resistance31, explaining the
relationship between AI and age.
There was no association between tertiles of r-AI and prevalence of the target-organ damage analyzed (renal failure, LVH and micro/macroalbuminuria). Despite this, there are reports that AI was associated with coronary artery disease5, urinary albumin excretion14 and LVH13, suggesting
a relationship between AI and target-organ damage. In relation to LVH, we found a high prevalence in this sample possibly due to the cutoff point adopted by the American Society of Echocardiography for its diagnosis25. The attenuation of the
Figure 1 –Relationship between radial augmentation index with height. weight. systolic and diastolic blood pressure.
Table 2 – Prevalence of target-organ damage according to tertiles of augmentation index
Variable 1
st Tertile
(n=44)a
2nd Tertile
(n=47)b
3rd Tertile
(n=49)c
p value*
(axbxc)
Renal dysfunction (%) 57.1 64.4 57.8 NS
Left ventricular hypertrophy (%) 69.7 66.7† 87.8† NS
Urinary albumin excretion
Normoalbuminuria (%) 42.9 61.9 56.8
NS
Microalbuminuria (%) 40.5 26.2 36.4
Macroalbuminuria (%) 16.7 11.9 6.8
cushioning of elastic arteries amplifies the pressure pulsatility and increases the transmission of pulsatile energy to the peripheral microcirculation33. This occurs particularly in high-blood flow
organs, such as brain and kidney, where pressure pulsatility penetrates further into the microcirculation, causing damage to these organs33,34.
Table 3 – Logistic regression analyses for diabetes and target-organ damages and tertiles of augmentation index
Variable β SE Odds ratio (95% CI) Valor p
Diabetes mellitus
1st Tertile - - 1.00
-2nd Tertile -0.274 0.428 0.76 (0.33-1.76) NS
3rd Tertile -0.898 0.441 0.41 (0.17-0.97) 0.042
Left ventricular hypertrophy
1st Tertile - - 1.00
-2nd Tertile -0.139 0.518 0.87 (0.31-2.40) NS
3rd Tertile 1.411 0.609 3.13 (0.95-10.33) NS
Renal dysfunction
1st Tertile - - 1.00
-2nd Tertile 0.307 0.440 1.36 (0.57-3.22) NS
3rd Tertile 0.025 0.433 1.03 (0.44-2.40) NS
NS – Not signiicant (p > 0.05).
In relation to glucose metabolism status, we found an inverse relation between glucose levels and r-AI in the univariate analysis. However, when multivariate analyses are performed, this relationship is not present. Further, in the logistic regression, the 3rd tertile of r-AI was associated with lower prevalence of
DM (OR = 0.41, 95% CI 0.17-0.97, p = 0.042). Studies of
the association between type 2 DM and AI are inconclusive. Similarly to our results, Tomita et al35 found in a sample of type
2 diabetic patients a negative association of r-AI to plasma glucose and HbA1c. Lacy et al36 in a multiple regression analysis
revealed that DM is a significant determinant of PWV, but not of AI. Guiadoni et al37 also did not found any difference for AI
between normotensive patients with and without metabolic syndrome. This same trend was observed by Wilhelm et al in a comparison between type 2 DM and controls38. On the other
hand, Wilkinson et al39 showed that AI was significantly high in
diabetic patients compared with controls matched by sex, age, weight and height. Despite the fact that there was no difference
for AI between patients with impaired glucose metabolism and normoglicemic controls, Schram et al40 found a higher aortic AI in
patients with DM compared to normoglicemic controls. However, our study cannot provide evidence for these mechanisms. The relationship between r-AI and lower prevalence of DM may have simply coexisted.
This study has some limitations that deserve to be mentioned. Firstly, its cross-sectional design and relative small number of patients does not allow the investigation of the relationship between AI and primary outcomes (stroke and myocardial infarction). Secondly, the AI could have been influenced by heart rate. Therefore, although we did not adjust AI for heart rate, we measured it after 10 minutes of rest. Thirdly, due the fact of our service is a specialized outpatient clinic, we could not assess patients with newly diagnosed hypertension and without antihypertensive treatment for this study.
In conclusion, in our country, this is one of the pioneering studies evaluating the importance of central BP and markers of arterial stiffness (r-AI) in Brazilian hypertensive individuals. In this sample, weight, heart rate and central BP were independently related to r-AI.
Potential Conflict of Interest
No potential conflict of interest relevant to this article was reported.
Sources of Funding
This study was funded by CAPES, CNPq, FAPESP and Faculdade de Medicina de São José do Rio Preto/Hospital de Base - FUNFARME.
Study Association
This study is not associated with any post-graduation program.
Table 4 – Correlation coeficients of augmentation index with
clinical-biochemical variables
Variable r p value
Age (years) 0.116 NS
Weight (Kg) -0.325 < 0.001
Height (m) -0.389 < 0.001
Gender (female) 0.343 < 0.001
Body mass index (Kg/m2) -0.143 NS
SBP (mm Hg) 0.275 0.002
DBP (mm Hg) 0.187 0.036
HR (beats/min) -0.298 0.001
rSBP2 (mmHg) 0.477 < 0.001
PP (mm Hg) 0.197 0.027
Total cholesterol (mg/dL) -0.020 NS
LDL-cholesterol (mg/dL) -0.020 NS
HDL-cholesterol (mg/dL) -0.011 NS
Triglycerides (mg/dL) -0.033 NS
Creatinine (mg/dL) 0.041 NS
Glucose (mg/dL) -0.203 0.020
Urinary albumin excretion (µg/min) -0.154 NS
Creatinine clearance (ml/min) -0.022 NS
Left ventricular mass (g) -0.008 NS
Left ventricular mass index (g/m2) 0.130 NS
SBP – systolic blood pressure; DBP – diastolic blood pressure; HR – Heart rate; rSBP2 – Late systolic BP in the radial artery (central pressure); PP – Pulse pressure; NS – Not signiicant (p > 0.05).
Table 5 – Multivariate relation between augmentation index and clinical-biochemical variables
Variable ß SEβ p value
Weight (Kg) -0.001 0.001 0.017
Height (m) -0.019 0.089 NS
Gender 0.010 0.015 NS
SBP (mm Hg) -0.011 0.020 NS
DBP (mm Hg) -0.002 0.020 NS
HR (beats/min) -0.001 0.001 0.007
PP (mm Hg) -0.001 0.020 NS
rSBP2 (mmHg) 0.015 0.001 < 0.001
Glucose (mg/dL) 0.001 0.001 NS
References
1. Williams B, Lacy PS, Thom SM, Cruickshank K, Stanton A, Collier D, et al. Differential impact of blood pressure-lowering drugs on central aortic pressure and clinical outcomes: principal results of the Conduit Artery Function
Evaluation (CAFE) study. Circulation. 2006;113(9):1213-25.
2. Protogerou AD, Papaioannou TG, Blacher J, Papamichael CM, Lekakis JP, Safar ME. Central blood pressures: do we need them in the management of cardiovascular disease? Is it a feasible therapeutic target? J Hypertens.
2007;25(2):265-72.
3. Roman MJ, Devereux RB, Kizer JR, Lee ET, Galloway JM, Ali T, et al. Central pressure more strongly relates to vascular disease and outcome than does
brachial pressure: the Strong Heart Study. Hypertension.
2007;50(1):197-203.
4. Safar ME, Blacher J, Pannier B, Guerin AP, Marchais SJ, Guvonvarc’h PM, et al. Central pulse pressure and mortality in end-stage renal disease. Hypertension.
2002;39(3):735-8.
5. Weber T, Auer J, O’Rourke MF, Kvas E, Lassnig E, Berent R, et al. Arterial
stiffness, wave reflections, and the risk of coronary artery disease. Circulation.
2004;109(2):184-9.
6. Mattace-Raso FU, van der Cammen TJ, Hofman A, van Popele NM, Bos ML, Schalekamp MA, et al. Arterial stiffness and risk of coronary heart disease and
stroke: the Rotterdam Study. Circulation. 2006;113(5):657-63.
7. Mulè G, Cottone S, Cusimano P, Riccobene R, Palermo A, Geraci C, et al. The association of microalbuminuria with aortic stiffness is independent of c-reactive protein in essential hypertension. Am J Hypertens.
2009;22(10):1041-7.
8. Hermans MM, Henry R, Dekker JM, Kooman JP, Kostense PJ, Nijpels G, et al. Estimated glomerular filtration rate and urinary albumin excretion are independently associated with greater arterial stiffness: The Hoorn study. J
Am Soc Nephrol. 2007;18(6):1942-52.
9. Takenaka T, Mimura T, Kanno Y, Suzuki H. Qualification of arterial stiffness as a risk factor to the progression of chronic kidney disease. Am J Nephrol.
2005;25(5):417-24.
10. Blacher J, Guerin AP, Pannier B, Marchais SJ, Safar ME, London GM. Impact of aortic stiffness on survival in end-stage renal disease. Circulation.
1999;99(18):2434-9.
11. Nürnberger J, Keflioglu-Scheiber A, Opazo Saez AM, Wenzel RR, Philipp
T, Schäfers RF. Augmentation index is associated with cardiovascular risk. J
Hypertens. 2002;20(12):2407-14.
12. DeLoach SS, Townsend RR. Vascular stiffness: its measurements and significance for epidemiologic and outcome studies. Clin J Am Soc Nephrol.
2008;3(1):184-92.
13. Hashimoto J, Watabe D, Hatanaka R, Hanasawa T, Metoki H, Asayyama K, et al. Enhanced radial late systolic pressure augmentation in hypertensive patients with left ventricular hypertrophy. Am J Hypertens.
2006;19(1):27-32.
14. Tsioufis C, Tzioumis C, Marinakis N, Toutouzas K, Tousoulis D, Kallikazaros I, et al. Microalbuminuria is closely related to impaired arterial elasticity in untreated patients with essential hypertension. Nephron Clin Pract.
2003;93(3):c106-11.
15. Weber T, O’rourke MF, Lassnig E, Parodko M, Ammer M, Rammer M, et al.
Pulse waveform characteristics predict cardiovascular events and mortality
in patients urdergoing coronary angiography. J Hypertens.
2010;28(4):797-805.
16. London GM, Blacher J, Pannier B, Guérin AP, Marchais SJ, Safar ME. Arterial wave reflections and survival in end-stage renal failure. Hypertension.
2001;38(3):434-8.
17. Melenovsky V, Borlaug BA, Fetics B, Kessler K, Shively L, Kass DA. Estimation of central pressure augmentation using automated radial artery tonometry. J
Hypertens. 2007;25(7):1403-9.
18. Yasmin, Brown MJ. Similarities and differences between augmentation index and pulse wave velocity in the assessment of arterial stiffness. QJM.
1999;92(10):595-600.
19. Kohara K, Tabara Y, Oshiumi A, Miyawaki Y, Kobayashi T, Miki T. Radial
augmentation index: a useful and easily obtainable parameter for vascular
aging. Am J Hypertens. 2005;18(1 Pt 2):11S-14S.
20. Kelly RP, Millasseau SC, Ritter JM, Chowienczyk PJ. Vasoactive drugs influence aortic augmentation index independently of pulse-wave velocity in healthy
men. Hypertension. 2001;37(6):1429-33.
21. Sakuragi S, Maruo T, Taniguchi M, Nagase S, Nakamura K, Kusano KF, et al. Radial augmentation index associated with increase in B-type natriuretic
peptide in patients with hypertension. Int J Cardiol. 2008;130(3):414-9.
22. Wilkinson IB, MacCallum H, Flint L, Cockcroft JR, Newby DE, Webb DJ. The influence of heart rate on augmentation index and central arterial pressure in
humans. J Physiol. 2000;525 Pt 1:263-70.
23. Nakae I, Matsuo S, Matsumoto T, Mitsunami K, Horie M. Augmentation index and pulse wave velocity as indicators of cardiovascular stiffness. Angiology.
2008;59(4):421-6.
24. Williams B, Lacy PS; CAFE and the ASCOT (Anglo-Scandinavian Cardiac Outcomes Trial) Investigators. Impact of heart rate on central aortic pressures
and hemodynamics: analysis from the CAFE (Conduit Artery Function
Evaluation) study: CAFE-Heart Rate. J Am Coll Cardiol. 2009;54(8):705-13.
25. Lang RM, Bierig M, Devereux RB, Flachskampf FA, Foster E, Pellikka PA, et al. Recommendations for chamber quantification: a report from the American Society of Echocardiography’s Guidelines and Standards Committee and the Chamber Quantification Writing Group, developed in conjunction with the European Association of Echocardiography, a branch of the European Society of Cardiology. J Am Soc Echocardiogr.
2005;18(12):1440-63.
26. Wojciechowska W, Staessen JA, Nawrot T, Cwynar M, Seidlerová J, Storlarz K, et al. Reference values in white Europeans for the arterial pulse wave record
by means of the SphymoCor device. Hypertens Res. 2006;29(7):475-83.
27. Shiburi CP, Staessen JA, Maseko M, Wojciechowska W, Thijs L, Van Bortel LM, et al. Reference values for SphygmoCor measurements in South Africans of
African ancestry. Am J Hypertens. 2006;19(1):40-6.
28. Li Y, Staessen JA, Li LH, Huang QF, Lu L, Wang JG. Reference values for the
arterial pulse wave in Chinese. Am J Hypertens. 2008;21(6):668-73.
29. Chung JW, Lee YS, Kim JH, Seong MJ, Kim SY, Lee JB, et al. Reference values for the augmentation index and pulse pressure in apparently healthy korean
subjects. Korean Circ J. 2010;40(4):165-71.
30. Weber T, Auer J, O’rourke MF, Kvas E, Lassnig E, Lamm G, et al. Increased arterial
wave reflections predict severe cardiovascular events in patients undergoing
percutaneous coronary interventions. Eur Heart J. 2005;26(24):2657-63.
31. Nichols WW, Singh BM. Augmentation index as a measure of peripheral
vascular disease state. Curr Opin Cardiol. 2002;17(5):543-51.
32. Gatzka CD, Kingwell BA, Cameron JD, Berry KL, Liang YL, Dewar EM, et al.
Australian Comparative Outcome Trial of Angiotensin-Converting Enzyme
Inhibitor and Diuretic-Based Treatment of Hypertension in the Elderly. J
Hypertens. 2001;19(12):2197-203.
33. Tomiyama H, Yamashina A. Non-invasive vascular function tests: their pathophysiological background and clinical application. Circ J.
2010;74(1):24-33.
34. Mitchell GF. Effects of central arterial aging on the structure and function of the peripheral vasculature: implications for end-organ damage. J Appl Physiol.
2008;105(5):1652-60.
35. Tomita H, Kawamoto R, Tabara Y, Miki T, Kohara K. Blood pressure is the main determinant of the reflection wave in patients with type 2 diabetes. Hypertens
36. Lacy PS, O’Brien DG, Stanley AG, Dewar MM, Swales PP, Williams B.
Increased pulse wave velocity is not associated with elevated augmentation
index in patients with diabetes. J Hypertens. 2004;122(10):1937-44.
37. Ghiadoni L, Penno G, Giannarelli C, Plantinga Y, Bernardini M, Pucci L, et al. Metabolic syndrome and vasculature alterations in normotensive subjects at
risk of diabetes mellitus. Hypertension. 2008;51(2):440-5.
38. Wilhelm B, Klein J, Friedrich C, Forst S, Pfützner A, Kann PH, et al. Increased arterial augmentation and augmentation index as surrogate parameters for
arteriosclerosis in subjects with diabetes mellitus and nondiabetic subjects
with cardiovascular disease. J Diabetes Sci Technol. 2007;1(2):260-3.
39. Wilkinson IB, MacCallum H, Rooijmans DF, Murray GD, Cockcroft JR, McKnight JA, et al. Increased augmentation index and systolic stress in type 1
diabetes mellitus. QJM. 2000;93(7):441-8.
40. Schram MT, Henry RM, van Dijk RA, Kostense PJ, Dekker JM, Nijpels G, et al. Increased central artery stiffness in impaired glucose metabolism and type 2