Facial harmony in orthodontic diagnosis
and planning
Abstract: Facial Harmony is one of the main goals of orthodontic treat-ment, and it is not always correlated with the attainment of cephalomet-ric objectives. The purpose of this study was to evaluate two groups of subjects presenting a clinically balanced soft tissue proile using cepha-lometric radiographs. Thirty lateral cephacepha-lometric radiographs of white females, divided in two groups, one with excellent facial proile (Group 1), and the other with good facial proile (Group 2) were used. Student’s t-test (P < .05) was used to compare the cephalometric parameters of the 2 groups. Linear regression analysis was also performed between 1.NB and SnV-Pog and between AB horizontal and SnV-Pog’. Group 2 showed higher mean values than group 1 for ANB (p = 0.002), AB horizon-tal (p < 0.001), 1.NB (p < 0.001), and a lower mean value for SnV-Pog (p = 0.003). The higher the SnV-Pog value, the lower the 1.NB value, no matter what group was evaluated. For each 1 mm increase in SnV-Pog, a 0.61º decrease could be expected in 1.NB (p = 0.003). The higher the SnV-Pog value, the lower the AB horizontal value, although group 2 pre-sented greater AB horizontal values. For each 1 mm increase in SnV-Pog, a 0.24 mm decrease could be expected in AB horizontal (p = 0.019). We concluded that women with good facial proile do not necessarily present the same cephalometric values, and facial analysis should be the main reference in planning orthodontic treatments and should be considered together with cephalometric analysis in an individualized way.
Descriptors: Orthodontics; Diagnosis; Cephalometry. João Batista de Paiva(a)
Miguel Ferragut Attizzani(b) Hiroshi Miasiro Júnior(b) José Rino Neto(a)
(a) Associate Professor; (b)MSc Student
– Department of Orthodontics, School of Dentistry, University of São Paulo, São Paulo, SP, Brazil.
Corresponding author:
João Batista de Paiva
Departamento de Ortodontia da Faculdade de Odontologia da USP
Av. Professor Lineu Prestes, 2227 - Cidade Universitária
São Paulo - SP - Brazil CEP: 05508-000 E-mail: [email protected]
Received for publication on Dec 05, 2008 Accepted for publication on May 13, 2009
Introduction
The attainment of facial esthetics and harmony is one of the main goals of orthodontic treatment. Orthodontically treated patients expect the treatment to improve their dental and facial esthetics.1 Diagnostic methodology is thus placing more emphasis on soft tissues evaluation.2
Many cephalometric analyses have been proposed to study soft-tissue proportionality.3,4,5 Many, however, are based upon dentoskeletal land-marks which are not necessarily consistent with good facial esthetics. Besides, in some cases, heterogeneous samples were used, including teen-agers5,6 and individuals with dentofacial deformities.3,7
establishing normal values and pursuing treatment goals among some authors,12,13 but what should be considered ideal and what is in the range of accept-ability when characterizing a well-balanced face?
Trying to attain ideal aesthetic goals without taking into consideration morphological variations among subjects and a range of acceptability for facial characteristics to be considered normal can lead to excessive surgical indications, professional dissatisfaction and a search for something unattain-able.
The purpose of the present study was to evalu-ate two groups of subjects presenting different facial traits with a clinically balanced soft tissue proile using cephalometric radiographs.
Materials and Methods
After a visual analysis of 720 undergraduate and graduate students from a School of Dentistry, 43 were invited to participate in a study about fa-cial proile. Subjects received information about the study, and of those who agreed to participate, a digital picture of the face proile was taken using a Sony Cyber-shot DSC-W1 (Sony Corporation, Mi-nato, Tokyo, Japan). The photographs were taken with the subjects standing, in oriented natural head position, with teeth occluded and lips relaxed. The photographs were then transferred to the Windows Picture and Fax Viewer of Microsoft Windows XP (Microsoft Corporation, Mountain View, CA, USA) and converted to a 20 x 15 cm size to standardize the selection procedure.
The selection of subjects was made by four ex-perienced orthodontists based on the following cri-teria:
A well-balanced orthognathic proile (superior lip anteriorly placed in relation to the inferior lip, which was anteriorly placed in relation to the po-gonion;
A closed lip posture (lip sealing);
No history of trauma, plastic or orthognathic surgery.
Thirty photographs were selected when there was agreement in all criteria between the evaluators. After the selection, subjects were asked to read and sign an informed consent form, and to take another
1.
2. 3.
set of photographs and a cephalometric radiograph. The rights of the human subjects were protected and approval was obtained from the local Ethical Re-search Committee.
Thirty lateral cephalometric radiographs taken using the same equipment were used. The sample consisted of white females, with ages varying from 19 years and 4 months to 31 years and 6 months, and was divided in two groups: one with excellent facial proile (Group 1, n = 15), and the other with good facial proile (Group 2, n = 15). Malocclusion classiication was not taken into consideration.
Photographic method
Frontal and right proile photographs were ob-tained with subjects standing, in oriented natural head position, with their teeth in contact and lips relaxed.
A Canon Rebel Assault 2000 (Canon, Tokyo, Ja-pan) camera was used. The photographic ilm was the Kodak® Gold 100 (Eastman Kodak Company, Rochester, NY, USA).
Cephalometric radiographs
Radiographs were taken in a Panoura 10 – CSU, PA 810 (Yoshida Dental, MFG Co. Ltda., Tokyo, Japan), with 85 kVp and 10 mA, exposure time of 1.2 seconds. Subjects were asked to assume an ori-ented head position with teeth in contact and lips relaxed.
A vertical line was ixed to the X-ray equip-ment following the criteria described by Lundström, Lundström14 (1995) and Rino Neto et al.15 (2003). The distance between the X-ray source and the ilm was 1.52 m.
Kodak® (Eastman Kodak Company, Rochester,
NY, USA) dental ilms with 18 x 24 cm were used, and they were processed in an A/T 2000 automatic processor from Air Techniques® (Air Techniques In-corporation, Melville, NY, USA).
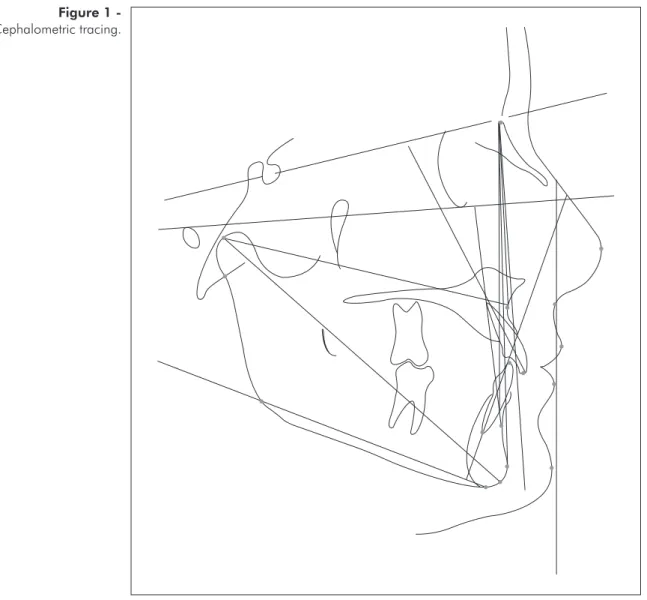
Cephalometric tracing
(Radiomem-ory®, Belo Horizonte, MG, Brazil) (Figure 1).
Statistical analysis
Student’s t-test was performed to compare the measurements of the 2 groups. Results were regard-ed as signiicant for P < .05. Linear regression anal-ysis was also performed between 1.NB and SnV-Pog and between AB horizontal and SnV-Pog.
Error of method
Ten randomly selected cephalometric radio-graphs had their cephalometric landmarks remarked by the same operator within a 60 days interval. The data was then compared with that obtained previ-ously using Student’s t test. No signiicant differ-ences were found.
Results
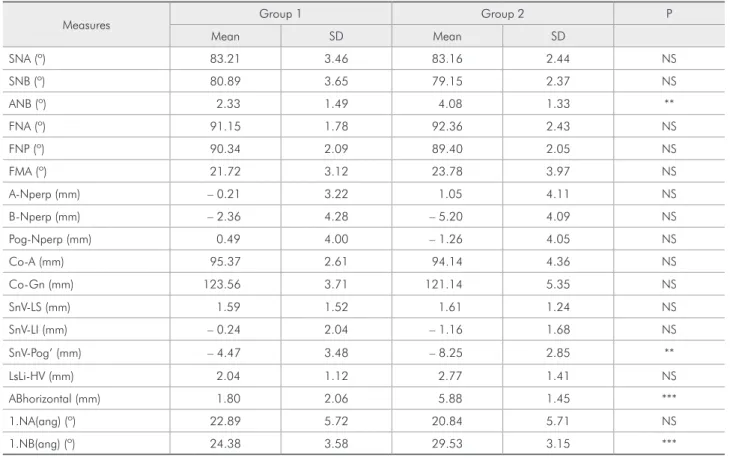
Table 1 presents a comparison between Groups 1 and 2.
It was observed that group 2 showed higher mean values than group 1 for ANB (p = 0.002), AB horizontal (p < 0.001), 1.NB (p < 0.001), and a low-er mean value for SnV-Pog (p = 0.003).
Table 2 presents the results for the relation be-tween 1.NB and SnV-Pog, and Table 3 presents the results for the correlation between them.
Table 2 shows that the relation between 1.NB and SnV-Pog was statistically the same in both groups. Table 3 shows that for each 1 mm increase in SnV-Pog, a 0.61º decrease could be expected in 1.NB (p = 0.003).
Table 4 presents the results for the relation beFigure 1
tween AB horizontal and SnV-Pog’, and Table 5 pres-ents the results for the correlation between them.
Table 4 shows that the relation between AB horizontal and SnV-Pog’ was statistically the same
in both groups. Table 5 shows that for each 1 mm increase in SnV-Pog’, a 0.24 mm decrease could be expected in AB horizontal (p = 0.019).
Table 2 - Relation between 1.NB and SnV-Pog’.
Factor F value p Group 3.88 0.060 SnV-Pog’ 2.24 0.147 SnV-Pog’ Group 0.59 0.450
*P < .05; **P < .01; ***P < .001.
Table 3 - Correlation between 1.NB and SnV-Pog’.
Parameter Estimation SE T value p Intercept 23.06 1.35 17.1 < 0.001*** SnV-Pog’ – 0.61 0.18 – 3.32 0.003**
*P < .05; **P < .01; ***P < .001. Table 1 - Cephalometric variables of group 1 (n = 15) and group 2 (n = 15) (t-Test).
Measures Group 1 Group 2 P
Mean SD Mean SD
SNA (º) 83.21 3.46 83.16 2.44 NS
SNB (º) 80.89 3.65 79.15 2.37 NS
ANB (º) 2.33 1.49 4.08 1.33 **
FNA (º) 91.15 1.78 92.36 2.43 NS
FNP (º) 90.34 2.09 89.40 2.05 NS
FMA (º) 21.72 3.12 23.78 3.97 NS
A-Nperp (mm) – 0.21 3.22 1.05 4.11 NS
B-Nperp (mm) – 2.36 4.28 – 5.20 4.09 NS
Pog-Nperp (mm) 0.49 4.00 – 1.26 4.05 NS
Co-A (mm) 95.37 2.61 94.14 4.36 NS
Co-Gn (mm) 123.56 3.71 121.14 5.35 NS
SnV-LS (mm) 1.59 1.52 1.61 1.24 NS
SnV-LI (mm) – 0.24 2.04 – 1.16 1.68 NS
SnV-Pog’ (mm) – 4.47 3.48 – 8.25 2.85 **
LsLi-HV (mm) 2.04 1.12 2.77 1.41 NS
ABhorizontal (mm) 1.80 2.06 5.88 1.45 ***
1.NA(ang) (º) 22.89 5.72 20.84 5.71 NS
1.NB(ang) (º) 24.38 3.58 29.53 3.15 ***
n: number of patients; SD: standard deviation. *P < .05; **P < .01; ***P < .001. NS: non-significant.
Table 4 - Relation between AB horizontal and SnV-Pog’.
Factor F value p Group 10.71 0.003** SnV-Pog’ 4.9 0.036* SnV-Pog’ Group 1.7 0.204
*P < .05; **P < .01; ***P < .001.
Table 5 - Correlation between AB horizontal and SnV-Pog’.
Parameter Estimation SE T value p Intercept 3.88 0.91 4.27 < 0.001*** Excellent profile –3.16 0.70 –4.5 < 0.001*** SnV-Pog’ –0.24 0.10 –2.49 0.019*
Discussion
A change in the approach to the diagnosis and objectives of orthodontic treatment has led ortho-dontists to deal primarily with facial esthetics. In order to achieve a harmonic soft tissue proile, it is important to know how teeth and skeletal structures are related with it.
The existence of signiicant differences in the re-lationship between the maxilla and the mandible as determined by the ANB angle and by the linear pro-jection of points A and B in a true horizontal line has been observed. Scheideman et al.16 (1980) found a mean of 2.5° (± 1.8°) for the ANB angle in his fe-male group, while Tukasan et al.17 (2005) found an upper limit of tolerance of 2.78° for the ANB angle in their control group with excellent occlusion. In the present study, it was found that the group with an excellent proile (group 1) presented a value close to the values cited above (2.33°± 1.49°), while the group with a good proile presented a higher value (4.08°± 1.33°), which was close to that observed by Tukasan et al.17 (2005) in their Class II group (5.56°). This is a very important aspect of the pres-ent study, and it differs from others3,4,5 because it suggests that the main reference to be taken into consideration during orthodontic treatment is the face, and that it should be recognized that even if a subject does not present an ideal cephalometric mea-sure, that does not mean that its face is not harmon-ic. Furthermore, in this kind of patient, one should not attempt to attain what is considered to be an ideal cephalometric goal, but rather try to maintain or improve facial balance by addressing what must be done to achieve it.
While evaluating chin projection and also us-ing a white-Brazilian sample and facial balance as a selection criteria, Scavone Jr. et al.18 (2008) found a –6.4 mm (± 5.2 mm) distance from Pog’ to a true vertical line passing through subnasale. Their mean value was lower than that found in the present study for group 1 (–4.47 mm ± 3.48) and higher than that found for group 2 (–8.25 mm ± 2.85), although they used facial photographs instead of cephalo-metric radiographs in their research. Scheideman et
al.16 (1980), also studying a sample of students with-out attempting to select subjects with ideal faces, found values (–4.2 mm ± 3.9) close to those found for group 1 in our study. Arnett et al.5 (1999) found higher values (–2.6 mm ± 1.9), than those observed in our study, indicating a more orthognathic pro-ile, but they studied a White American population, and their sample comprised models, which probably meant a high standard of facial beauty. In the pres-ent paper, a range of harmonic faces was studied, and the results for group 2 indicated that for all 4 examiners, a smaller projection of the chin for Bra-zilian women was accepted as harmonic.
It was also found that group 2 (29.53°± 3.15) had lower incisors more labially tipped than group 1 (24.38°± 3.58). Steiner4 (1953) set a standard of 25° for the lower incisors inclination in relation to line NB, which is close to the results observed in our study for group 1. Tukasan et al.17 (2005) found that Class II division 1 subjects showed lower incisors more labially tipped than subjects with excellent occlusion. In the correlation analysis, it was found that when the SnV-Pog’ increased, the ABhorizon-tal and the 1.NB values decreased in both groups. As group 2 also presented signiicant differences in the relationship between the apical bases (ANB and ABhorizontal), the lower incisors were also more la-bially tipped to compensate the observed anteropos-terior skeletal discrepancy.
Another interesting inding of the present study was that if the method of using cephalometric radio-graphs had been used instead of the method of using proile pictures to evaluate facial harmony, some of the subjects would have been excluded. It appears that facial balance acceptance was higher in facial photographs than in cephalometric radiographs.
Conclusions
References
1. Kiekens RMA, Maltha JC, van’t Hof MA, Kuijpers-Jagtman AM. Objective Measures as Indicators for Facial Esthetics in White Adolescents. Angle Orthod. 2006;76(4):551-6. 2. Halazonetis DJ. Morphometric evaluation of soft-tissue profile
shape. Am J Orthod Dentofacial Orthop. 2007;131(4):481-9. 3. Ricketts RM. A foundation for cephalometric communication.
Am J Orthod. 1960;46(5):330-57.
4. Steiner CC. Cephalometrics for you and me. Am J Orthod. 1953;39(10):729-55.
5. Arnett GW, Jelic JS, Kim J, Cummings DR, Beress A, Worley CM Jr et al. Soft tissue cephalometric analysis: diagnosis and treatment planning of dentofacial deformity. Am J Orthod Dentofacial Orthop. 1999;116(3):239-53.
6. Burstone CJ, James RB, Legan HL, Murphy GA, Norton LA. Cephalometrics for orthognathic surgery. J Oral Surg. 1978;36(4):269-77.
7. Solow B, Tallgren A. Natural head position in standing sub-jects. Acta Odontol Scand. 1971;29(5):591-607.
8. Bishara SE, Jakobsen JR, Hession TJ, Treder JE. Soft tis-sue profile changes from 5 to 45 years of age. Am J Orthod. 1980;114(6):698-706.
9. Ferrario VF, Sforza C, Schmitz JH, Ciusa V, Colombo A. Normal growth and development of the lips: a 3-dimensional study from 6 years to adulthood using a geometric model. J Anat. 2000;196(Pt 3):415-23.
10. Nanda RS, Meng H, Kapila S, Goorhuis J. Growth changes in the soft tissue facial profile. Angle Orthod. 1990;60(3):177-90.
11. Prahl-Andersen B, Ligthelm-Bakker AS, Wattel E, Nanda R. Adolescent growth changes in soft tissue profile. Am J Orthod Dentofacial Orthop. 1995;107(5):476-83.
12. Fernández-Riveiro P, Suárez-Quintanilla D, Smyth-Chamosa E, Suárez-Cunqueiro M. Linear photogrammetric analysis of the soft tissue facial profile. Am J Orthod Dentofacial Orthop. 2002;122(1):59-66.
13. Ferrario VF, Sforza C, Dellavia C, Schmitz JH. Harmonic analysis of facial profiles: a 10-year evaluation. Int J Adult Orthodon Orthognath Surg. 2001;16(1):54-60.
14. Lundström A, Lundström F. The Frankfort horizontal as a basis for cephalometric analysis. Am J Orthod Dentofacial Orthop. 1995;107(5):537-40.
15. Rino Neto J, Freire-Maia BA, Paiva JB. Método de registro da posição natural da cabeça para obtenção da radiografia cefalométrica lateral – Considerações e importância do método no diagnóstico ortodôntico-cirúrgico. Rev Dent Press Ortodon Ortop Facial. 2003;8(3):61-71.
16. Scheideman GB, Bell WH, Legan HL, Finn RA, Reisch JS. Cephalometric analysis of dentofacial normals. Am J Orthod. 1980;78(4):404-20.
17. Tukasan PC, Magnani MBBA, Nouer DF, Nouer PRA, Neto JSP, Garbui IU. Craniofacial analysis of the Tweed Founda-tion in Angle Class II, division 1 malocclusion. Braz Oral Res. 2005;19(1):69-75.