*Correspondence: T. P. John Rojas. School of Pharmaceutical Chemistry, The University of Antioquia, Cll 65 # 53-108 Ofice 1-157, Medellin, Colombia. E-mail: [email protected]
Ar
Pharmaceutical Sciences vol. 47, n. 3, jul./sep., 2011
Formulation of a modiied release metformin.HCl matrix tablet:
inluence of some hydrophilic polymers on release rate and in-vitro
evaluation
John Rojas
*, Cesar González, Carolina Rico, Oswaldo Saez
School of Pharmaceutical Chemistry, The University of Antioquia
Metformin hydrochloride is an antidiabetic agent which improves glucose tolerance in patients with type 2 diabetes and reduces basal plasma levels of glucose. In this study, a simplex centroid experimental design with 69 runs was used to select the best combination of some hydrophilic polymers that rendered a 24 h in-vitro release proile of metformin.HCl. The Korsmeyer–Peppas model was used to model the dissolution proiles since it presented the best it to the experimental data. Further, a cubic model predicted the best formulation of metformin.HCl containing polyvinyl pyrrolidone, ethyl cellulose, hydroxypropyl methyl cellulose, carrageenan, sodium alginate, and gum arabic at 6.26, 68.7, 6.26, 6.26, 6.26 and 6.26 % levels, respectively. The validation runs conirmed the accuracy of the cubic model with six components for predicting the best set of components which rendered a once-a-day modiied release hydrophilic matrix tablet in compliance with the USP speciications.
Uniterms: Metformin/release proile. Metformin.HCl/modiied release/in-vitro evaluation. Hydrophilic polymers/inluence/drugs release. Korsmeyer-Peppas model/dissolution proiles.
O cloridrato de metformina é um agente antidiabético que melhora a tolerância à glicose em pacientes com diabetes tipo 2 e reduz os níveis plasmáticos basais de glicose. Neste estudo, um projeto experimental do tipo “centróide simplex” com 69 tomadas foi usado para selecionar a melhor combinação de alguns polímeros hidrofílicos que gerou um peril de liberação da metformina.HCl de 24 horas. O modelo Korsmeyer-Peppas foi usado para modelar os peris de dissolução, uma vez que apresentou os melhores ajustes aos dados experimentais. Além disso, um modelo cúbico previu a melhor formulação de metformina.HCl sendo aquela contendo polivinilpirrolidona, etilcelulose, hidroxipropilmetil celulose, carragena, alginato de sódio e goma arábica nos níveis 6.26, 68.7, 6.26, 6.26, 6.26 e 6.26 %, respectivamente. As corridas de validação conirmaram a precisão do modelo cúbico com os seis componentes para prever o melhor conjunto de componentes que originou uma libertação do tipo “uma vez ao dia” em conformidade com as especiicações da USP, a partir de comprimidos matriciais.
Unitermos: Metformina/peril de liberação. Cloridrato de metformina/liberação modiicada/in-vitro
evaluation. Polímeros hidrofílicos/inluência/liberação de fármacos. Modelo Korsmeyer-peppas/peril de dissolução.
INTRODUCTION
It is estimated that by 2025 around 300 million people will be diagnosed with diabetes (Ritu et al., 2009; Jain, Gupta, 2009). Metformin hydrochloride (MH) is
(0.5 g/mL) administered up to 2.5 g/day in three separate doses given with meals to minimize possible gastrointes-tinal side effects such as anorexia, abdominal discomfort, nausea, and diarrhea (Gouldson, Deasy, 1997). However, food also decreases the absorption of the drug (Hu et al., 2006). The presence of side effects and the need for three-times-a-day administration could reduce patient complian-ce and hinder succomplian-cessful treatment (Mandal et al., 2007).
MH does not produce lactic acidosis as seen in other biguanide drugs such as phenformin and buformin (Tucker et al., 1981). Further, MH does not bind to plasma proteins and the elimination of the unchanged drug mainly occurs by active tubular secretion through the kidneys. A single dose of 500 mg of an immediate and modiied release MH showed higher plasma concentrations for the latter in the steady-state (Karttunen et al., 1983). A single immediate release dose of MH exhibits a lip-lop model and a bio-availability of about 61%. The tmax and t1/2 of MH after a single immediate release oral dose of 500 mg was ~2 h and 2.6 h, respectively (Pentikainen et al., 1979). However, a 250 mg sustained-release MH pellet showed a tmax of 7.3 h and t1/2 of 8.3 h and a 165% increase in bioavailability in comparison to the immediate release formulation and thus, tmax depended on the dose. For instance, tmax was 2.2 h and 1.5 h for an immediate release dose of 0.5 and 1.5 g, respectively (Tucker, 1981). Further, ~20% of the single immediate release dose is recovered in faeces, indicating saturable absorption and low absorption in the terminal segment of the colon (Lian-Dong et al., 2006; Gusler et al., 2001; Pentikainen, 1986). This problem creates the need for a modiied release device to modulate the release and hence, the absorption of MH. Thus, a modiied release system allows for achieving an optimal therapy, improving patient compliance and safety, reducing dose dumping, plasma luctuations and the incidence of side effects. Corti and collaborators achieved a sustained-release MH matrix based on Eudragit L100-55, HPMC and β-cyclodextrin
which released up to 60% of the drug within 5 h (Corti et al., 2008).
Hydrophilic matrices are composed of hydrophilic polymers, an active ingredient and other excipients ho-mogeneously distributed in a three dimensional network. Several factors affect the drug release from a hydrophilic matrix (Conte et al., 1988; Colombo et al., 1999). These factors are the drug solubility, polymer swelling, polymer erosion, drug dissolution/diffusion characteristics, distri-bution of drug within the polymer matrix and proportion and geometry of the system (Wu, Zhou, 1998; Zhou, Wu, 1997; Adrover et al., 1996). The absorption of solvent, as well as the drug release, also depends on the viscoelastic properties of the polymer (Crank, 1975).
If the network of the matrix is seen as a mesh, large spaces can be deined as access points for the diffusion of drugs (Maulin, Ben-Avhraham, 1987). In non-porous matrices, swelling occurs irst, moving and expanding the dry glassy core portion of the swollen matrix (Crank, 1975; Colombo et al., 1999). However, for porous systems, drug release also depends on the porosity of the matrix and drug dissolution/diffusion through the pores. This behavior is prevalent in hydrophobic porous matrices (Barry et al., 1979; Colombo et al., 1999). Non-porous systems have no deined pores and the molecules diffuse through the mesh of the matrix (Robert et al., 1985). In the case of poorly soluble drugs, the diffusion front may appear be-tween the outside of the swollen matrix, where the drug is completely dissolved, and the inside, where the drug is still undissolved. Drug release in swellable matrices is controlled by the diffusion coeficient and the swelling process (Grassi, 2003).
In a swellable matrix, swelling of the polymer matrix and drug loading affect the drug release kinetics (Grassi et al., 2003). The swelling behavior depends largely on the number of intermolecular bonds per volume of polymer. For neutral polymers, the amount of solvent absorbed depends on the chemical afinity of the polymer for the solvent and on the elastic properties of the swollen poly-mer network. In the case of charged polypoly-mers, swelling depends on the ionic strength (Ricka, Tanaka, 1984; Okazaki et al., 1996). In fact, the chains of a cross-linked polyelectrolyte assume a modiied conformation in pure water, while this conformation is precluded in aqueous salt solutions, due to the electrostatic interactions between polymer charges and mobile ions present in the solution (Tanaka et al., 1986).
In the present study, formulations of hydrophilic matrixes composed of MH, ethylcellulose, HPMC, carra-geenan, sodium alginate, gum arabic and PVP were prepa-red by wet granulation followed by tableting to achieve a once-a-day controlled release preparation. This provides a lower but controlled drug concentration over an extended period of time (24 h). The resulting dissolution proiles and release kinetics of the matrices were also evaluated.
MATERIAL AND METHODS
Material
Midland, MI, USA). K-carrageenan (lot 217882), and gum Arabic (lot 104K0151) were purchased from Bell Chem Corp., Longwood, FL, USA. Sodium alginate (lot 990972) and PVP K-30 (lot 0911106) were purchased from Sigma-Aldrich, St. Louis, MO, USA. Monobasic potassium phosphate (lot 8N117059B) and NaOH (lot B0244398) were obtained from Carlo Erba, Milan, Italy and Merck, Darmstadt, Germany, respectively.
Methods
Preparation of Matrix Compacts
Powder mixtures of ~10 g were prepared in a mortar a pestle using a 70% ethanol solution as a wetting agent. The wet samples were then granulated on an oscillating granulator equipped with a size 40 mesh (Riddhi Pharma Machinery, Gulabnagar, India), followed by drying at room temperature for 14 h until reaching a moisture con-tent of less than 3%. The dry samples were then granulated on an oscillating granulator using a size 40 and 60 mesh, consecutively. Cylindrical compacts, each Weighing ~1750 mg were then made on a rotary tablet press (512-1, FJ Stokes Manufacturer Corporation, Philadelphia, PA, USA) equipped with a 13 mm diameter concave punches and die set. The compression force was controlled to give a compact porosity of ~ 0.3 (compact solid fraction of 0.7). The uniformity of the dose (Table I) was assessed on three compacts of each formulation by grinding 3 compacts from each formulation in a mortar, followed by dispersing the powder in distilled water and iltering through a 0.45 µm membrane. Dilutions of this solution were conducted to achieve a concentration of 8 µg/mL. The absorbance of this solution was measured at 232 nm and the resulting concentration was interpolated from a calibration curve. The United States Pharmacopoeia (USP34/NF29) speci-ication for uniformity of dose is from 90 to 100%.
In-vitro dissolution studies
Matrixes containing 750 mg of MH were agitated at 100 rpm in 1000 mL of phosphate buffer pH 6.8 at 37 °C
in a dissolution basket assembly (VARIAN dissolutor, VK7000, Palo Alto, CA, USA). Five milliliter aliquots were withdrawn periodically with immediate replace-ment of the dissolution medium and subsequent iltration through a 0.45 µm ilter. Samples were analyzed by UV spectroscopy (Shimadzu UV-1700, Kyoto, Japan) at 232 nm (USP34/NF29).
Simplex centroid mixture design
A “simplex centroid” experimental mixture design with 6 components (ethyl cellulose, HPMC, PVP,
carra-geenan, sodium alginate and gum arabic) and 69 runs was employed (Table I). The two dependent variables were release rate (k) and release order (n). The non-linear itting model was conducted by using the Statgraphics software (StatPoint, Inc. Warrenton, VA). The coeficients of the model estimate the variation in the experimental para-meters. The results were analyzed either as an analysis of the coeficients of the various polymers, or as an analysis of variance (ANOVA). Preliminary itting of the data to the zero order, irst order, Higuchi, Hixson-Crowell and Korsmeyer-Peppas (KP) determined the latter as the most suitable release model based on the comparison of the re-levant correlation coeficients and thus, only results from this model were included in this study.
Modeling of dissolution profiles
The Korsmeyer-Peppas model was employed (Rit-ger, Peppas, 1987):
M/M∞= k*tn (1)
where M∞ is the amount of drug released at ininite time,
k is the rate constant of drug release and n is the exponent that characterizes the process of release. If the diffusion process is Fickian, n is equal to 0.5, 0.45 and 0.43 for thin films, cylindrical and spherical matrices, respectively. When n exceeds these thresholds, the release is non-Fickian (Ritger, Peppas, 1987). The release mechanism is given once the polymer chains contact the solvent and the chains are reoriented to achieve a new equilibrium condi-tion (Siepman, Peppas, 2001). The time required for this reorganization is called polymer relaxation time (tr). If tr is much smaller than the diffusion time td required for the release, the process is then Fickian. When tr≅td, solvent ab-sorption is not Fickian or anomalous (Grassi et al., 1998).
Validation of optimization model
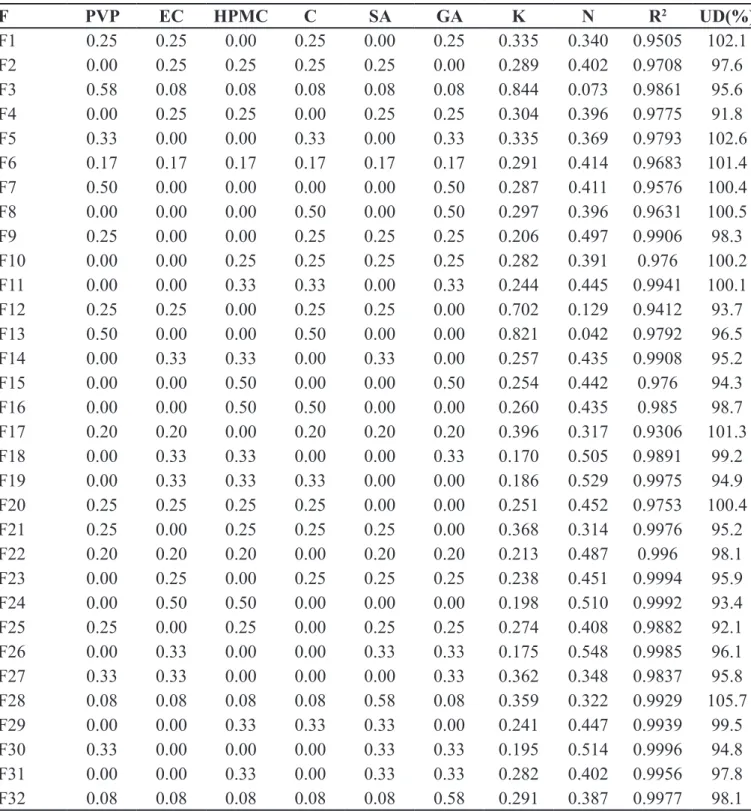
TABLE I - Simplex centroid matrix and responses obtained according to the Korsmeyer-Peppas (KP) model
F
PVP
EC
HPMC
C
SA
GA
K
N
R
2UD(%)
F1
0.25
0.25
0.00
0.25
0.00
0.25
0.335
0.340
0.9505
102.1
F2
0.00
0.25
0.25
0.25
0.25
0.00
0.289
0.402
0.9708
97.6
F3
0.58
0.08
0.08
0.08
0.08
0.08
0.844
0.073
0.9861
95.6
F4
0.00
0.25
0.25
0.00
0.25
0.25
0.304
0.396
0.9775
91.8
F5
0.33
0.00
0.00
0.33
0.00
0.33
0.335
0.369
0.9793
102.6
F6
0.17
0.17
0.17
0.17
0.17
0.17
0.291
0.414
0.9683
101.4
F7
0.50
0.00
0.00
0.00
0.00
0.50
0.287
0.411
0.9576
100.4
F8
0.00
0.00
0.00
0.50
0.00
0.50
0.297
0.396
0.9631
100.5
F9
0.25
0.00
0.00
0.25
0.25
0.25
0.206
0.497
0.9906
98.3
F10
0.00
0.00
0.25
0.25
0.25
0.25
0.282
0.391
0.976
100.2
F11
0.00
0.00
0.33
0.33
0.00
0.33
0.244
0.445
0.9941
100.1
F12
0.25
0.25
0.00
0.25
0.25
0.00
0.702
0.129
0.9412
93.7
F13
0.50
0.00
0.00
0.50
0.00
0.00
0.821
0.042
0.9792
96.5
F14
0.00
0.33
0.33
0.00
0.33
0.00
0.257
0.435
0.9908
95.2
F15
0.00
0.00
0.50
0.00
0.00
0.50
0.254
0.442
0.976
94.3
F16
0.00
0.00
0.50
0.50
0.00
0.00
0.260
0.435
0.985
98.7
F17
0.20
0.20
0.00
0.20
0.20
0.20
0.396
0.317
0.9306
101.3
F18
0.00
0.33
0.33
0.00
0.00
0.33
0.170
0.505
0.9891
99.2
F19
0.00
0.33
0.33
0.33
0.00
0.00
0.186
0.529
0.9975
94.9
F20
0.25
0.25
0.25
0.25
0.00
0.00
0.251
0.452
0.9753
100.4
F21
0.25
0.00
0.25
0.25
0.25
0.00
0.368
0.314
0.9976
95.2
F22
0.20
0.20
0.20
0.00
0.20
0.20
0.213
0.487
0.996
98.1
F23
0.00
0.25
0.00
0.25
0.25
0.25
0.238
0.451
0.9994
95.9
F24
0.00
0.50
0.50
0.00
0.00
0.00
0.198
0.510
0.9992
93.4
F25
0.25
0.00
0.25
0.00
0.25
0.25
0.274
0.408
0.9882
92.1
F26
0.00
0.33
0.00
0.00
0.33
0.33
0.175
0.548
0.9985
96.1
F27
0.33
0.33
0.00
0.00
0.00
0.33
0.362
0.348
0.9837
95.8
F28
0.08
0.08
0.08
0.08
0.58
0.08
0.359
0.322
0.9929
105.7
F29
0.00
0.00
0.33
0.33
0.33
0.00
0.241
0.447
0.9939
99.5
F30
0.33
0.00
0.00
0.00
0.33
0.33
0.195
0.514
0.9996
94.8
F31
0.00
0.00
0.33
0.00
0.33
0.33
0.282
0.402
0.9956
97.8
F32
0.08
0.08
0.08
0.08
0.08
0.58
0.291
0.387
0.9977
98.1
RESULTS AND DISCUSSION
In-vitro dissolution studies
Table I lists the composition of 69 trial formulations prepared with different combinations of polymers such as ethyl cellulose, HPMC, PVP, carrageenan, sodium alginate,
F
PVP
EC
HPMC
C
SA
GA
K
N
R
2UD(%)
F33
0.08
0.08
0.08
0.58
0.08
0.08
0.334
0.344
0.9842
100.4
F34
0.00
0.50
0.00
0.50
0.00
0.00
0.659
0.126
0.9919
103.1
F35
0.20
0.00
0.20
0.20
0.20
0.20
0.248
0.443
0.9948
102.3
F36
0.00
0.00
1.00
0.00
0.00
0.00
0.243
0.446
0.9904
105.2
F37
0.25
0.00
0.25
0.25
0.00
0.25
0.312
0.356
0.9823
97.3
F38
0.00
0.20
0.20
0.20
0.20
0.20
0.263
0.423
0.996
104.5
F39
0.20
0.20
0.20
0.20
0.20
0.00
0.277
0.391
0.993
99.2
F40
0.50
0.00
0.50
0.00
0.00
0.00
0.527
0.222
0.8753
106.8
F41
0.33
0.00
0.33
0.00
0.33
0.00
0.290
0.400
0.9919
100.1
F42
0.33
0.33
0.00
0.00
0.33
0.00
0.907
0.026
0.9656
105.2
F43
0.33
0.33
0.33
0.00
0.00
0.00
0.359
0.346
0.9441
102.1
F44
0.00
0.00
0.50
0.00
0.50
0.00
0.269
0.400
0.9936
104.3
F45
0.00
0.33
0.00
0.33
0.00
0.33
0.338
0.346
0.9965
101.6
F46
0.50
0.50
0.00
0.00
0.00
0.00
1.000
0.002
0.9998
101.2
F47
0.00
0.50
0.00
0.00
0.50
0.00
0.368
0.313
0.9732
99.5
F48
0.00
1.00
0.00
0.00
0.00
0.00
0.629
0.160
0.9389
103.8
F49
0.00
0.33
0.00
0.33
0.33
0.00
0.949
0.022
0.9924
102.2
F50
0.00
0.25
0.25
0.25
0.00
0.25
0.288
0.411
0.9841
106.5
F51
0.00
0.00
0.00
0.00
1.00
0.00
0.313
0.363
0.983
105.3
F52
0.25
0.25
0.25
0.00
0.00
0.25
0.294
0.388
0.997
103.1
F53
0.33
0.00
0.00
0.33
0.33
0.00
0.927
0.017
0.9989
104.8
F54
0.33
0.00
0.33
0.00
0.00
0.33
0.513
0.232
0.9563
98.2
F55
1.00
0.00
0.00
0.00
0.00
0.00
0.985
0.000
0.9976
106.1
F56
0.00
0.50
0.00
0.00
0.00
0.50
0.320
0.380
0.9727
104.2
F57
0.33
0.33
0.00
0.33
0.00
0.00
0.917
0.044
0.9882
104.9
F58
0.20
0.20
0.20
0.20
0.00
0.20
0.309
0.382
0.9858
103.5
F59
0.00
0.00
0.00
0.00
0.50
0.50
0.286
0.411
0.9851
94.9
F60
0.00
0.00
0.00
1.00
0.00
0.00
0.792
0.067
0.9821
102.5
F61
0.00
0.00
0.00
0.00
0.00
1.00
0.316
0.383
0.9837
106.1
F62
0.25
0.25
0.00
0.00
0.25
0.25
0.718
0.117
0.9746
104.1
F63
0.00
0.00
0.00
0.33
0.33
0.33
0.365
0.339
0.984
102.3
F64
0.00
0.00
0.00
0.50
0.50
0.00
0.524
0.206
0.9962
96.4
F65
0.08
0.58
0.08
0.08
0.08
0.08
0.313
0.380
0.9905
99.8
F66
0.33
0.00
0.33
0.33
0.00
0.00
0.891
0.036
0.9938
105.7
F67
0.50
0.00
0.00
0.00
0.50
0.00
0.733
0.107
0.9707
107.3
F68
0.25
0.25
0.25
0.00
0.25
0.00
0.433
0.290
0.9125
97.4
F69
0.08
0.08
0.58
0.08
0.08
0.08
0.285
0.398
0.9926
99.3
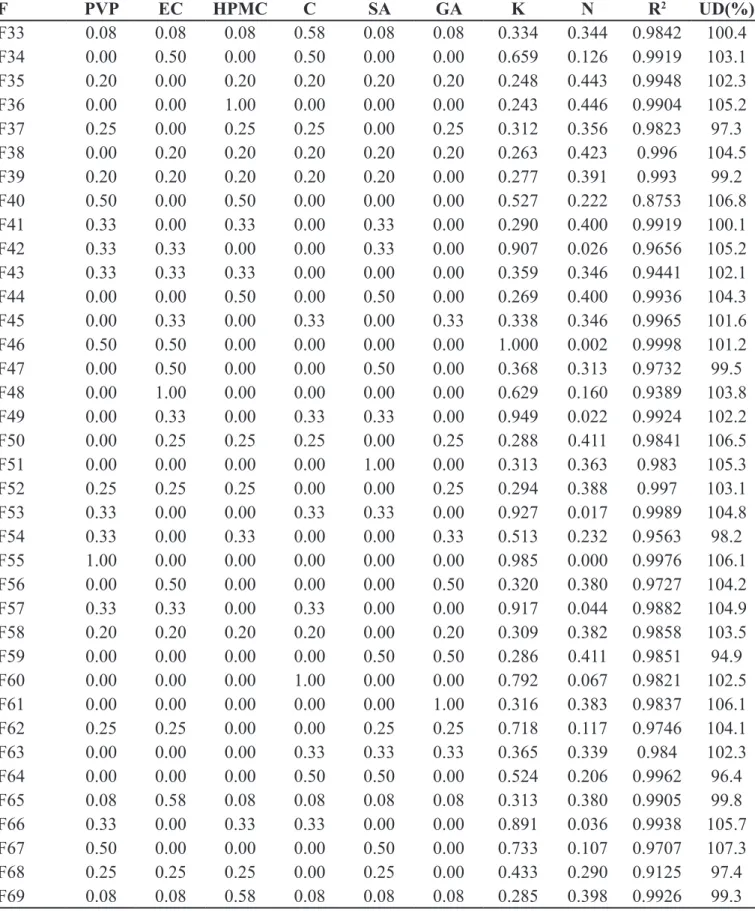
F = formulation; E = ethyl cellulose; SA = sodium alginate; GA = gum arabic; C = carrageenan; HPMC = hydroxypropyl methyl cellulose; PVP = Polyvinyl pyrrolidone; k = drug release constant; n = release type; UD = uniformity of the doseThe release proile of MH from the single polymers is shown in Figure 1. PVP caused the fastest release of MH and when this component was present at a high level, drug release was also fast. PVP is very soluble in water and wets easily when its matrixes come into contact with water, leading to quick dissolution and erosion of the matrix. By contrast, the HPMC matrix alone rendered the slowest drug release. The HPMC matrix hydrates rapidly on contact with water to form a gel on the surface of the tablet. Soluble drugs such as MH are released primarily by diffusion through the gel layer. The matrix compacts containing ethyl cellulose in combination with hydrophilic polymers presented the mechanism of swelling and ero-sion, whereas ethyl cellulose alone has a diffusion through the pores mechanism. The formulation containing MH and pure carrageenan formed a fast eroding gel which could have increased the medium viscosity.
The formulation containing MH and sodium algi-nate also formed a gel when placed in contact with the medium, but eroded slowly. The formulation containing only gum arabic also formed a gel, but it was less viscose than that produced by carrageenan and sodium alginate. For swelling and gelling polymers such as HPMC, the viscosity of the gel layer around the compact increases at higher hydrogel concentration, slowing the release of MH because the gel is formed by closely-packed swollen particles. In general, the release rate (k) of the pure poly-mers with the drug followed the trend:
PVP> Carrageenan> ethylcellulose>sodium alginate
≅gum arabic> HPMC. It is observed that formulations
con-taining sodium alginate (F51) and gum arabic (F61), which were the most gelling materials, had similar release rates (0.313 and 0.316, respectively). By contrast, the formu-lation containing only MH and HPMC (F36) yielded the
slowest release proile. The value of n of this formulation indicates that it follows a Fickian release (n = 0.45) which coincides with that expected for cylindrical matrices. This is the major reason why this polymer is widely used for modiied release of drugs. Conversely, most formulations had an anomalous release which comprises swelling, ero-sion and disintegration of the matrix.
Formulations such as F3, F12, F13, F42, F46, F53, F57, F62, F66, and F67 containing considerable levels of PVP or carrageenan and very low levels of highly gelling polymers such as HPMC, exhibited an initial burst of the matrix releasing the drug quickly as seen by the high k values. This is attributed to the dissolution of the drug present initially at the surface of the matrices followed by a fast penetration of dissolution media to the matrix causing a disruption of its structure. By contrast, sodium alginate and gum arabic (which gel and form a halo around the area of contact with the aqueous medium) release the drug more slowly and their proiles fall within the USP range.
For gum arabic, HPMC and ethylcellulose, the pre-sence of cross-links among polymer chains is responsible for the wetting of the polymer with the liquid, resulting in the expansion of the network resembling a sponge soaked in water. If cross-linking among the polymer chains have a covalent nature the network does not change with time. On the contrary, if the interactions are Van der Waals, dipole-dipole, hydrophobic or hydrogen bonding type, the polymer chains are not rigidly connected, resulting in polymer burst/erosion as occurred for PVP and carragee-nan (Barry, Meyer, 1979). Since the method of preparation of these matrices involves wet granulation and tableting, the resulting matrixes can be considered porous systems and MH which is a water soluble drug is more likely to diffuse through the pores, rather than through the mesh of the matrix.
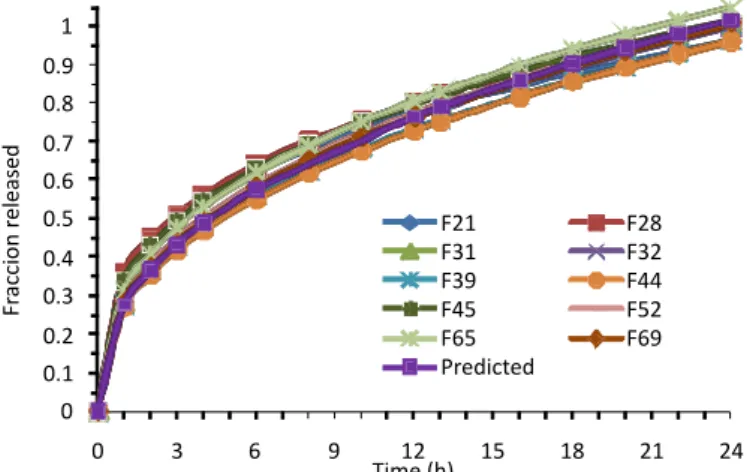
The USP gives the speciications for the range of percentage of MH released in a 24 h proile. This proile range is between 20-40%, 35-55%, 75-85%, and 85-100% at 1, 4 10 and 24 h, respectively. These values are relec-ted in a k value from 0.23 to 0.39 and n value from 0.3 to 0.43. For matrix tablets, an n value close to 0.5 indicates a diffusion control mechanism and n close to 1.0, erosion or relaxation control. The range for n values suggests that formulations with diffusion as the dominant mechanism of drug release is desirable. Formulations which rendered k and n parameters within the USP range and having the best it to the non-linear KP model (R2 > 0.9990) were selected as appropriate and shown in Figure 2. Since the USP gives a broad range of drug release, 10 formulations fulilled the speciications out of the 69 formulations studied. For
FIGURE 1 - Release proiles of metformin.HCl from the single
example, formulations 21, 28, 31, 32, 39, 44, 45, 52, 65 and 69 had low levels of highly hydrophilic polymers such as PVP and carrageenan and high levels of swelling and gelling polymers such as ethyl cellulose, sodium alginate, HPMC and gum arabic.
Mathematical modeling
Theleast squares method rendered a cubic model for the mixture design with the best it for k and n. Thus, the results of the model statistics show R2 values of 0.9645 and 0.9664 for both response models, which indicate a good correlation between the experimental and predicted responses (Table II). The ANOVA test conducted on the cubic regression models indicates that the mixture design developed for the two responses were significant and adequate.
The cubic model itting evaluates the effect of the polymers to obtain an estimate of the coeficients. These coeficients and their signiicance are shown in Table III. The cubic equations comprise the coeficients for irst or-der main effects and their interaction terms. The sign and
TABLE II - ANOVA table for k and n as result of cubic model
Response Source Sum of squares Degrees of
freedom Mean squares F-ratio p-value
k Cubic model 7.42915 55 0.135075 39.63 <0.01
Error total 0.27947 82 0.003408
Total (corregido) 7.70862 137 R2 0.9637
n Model 3.07841 55 0.055971 43.89 <0.01
Error total 0.10457 82 0.001275
Total (corregido) 3.18297 137 R2 0.9671
k= release rate constant; n= release order
FIGURE 2 - Release proiles of metformin.HCl for formulations
which fulilled USP34/NF29 speciications.
magnitude of the main effects signify the relative inluence of each factor on the response, i.e., average result of chan-ging one factor at a time from its low to high value. The interaction terms show how the response changed when two factors were simultaneously changed.
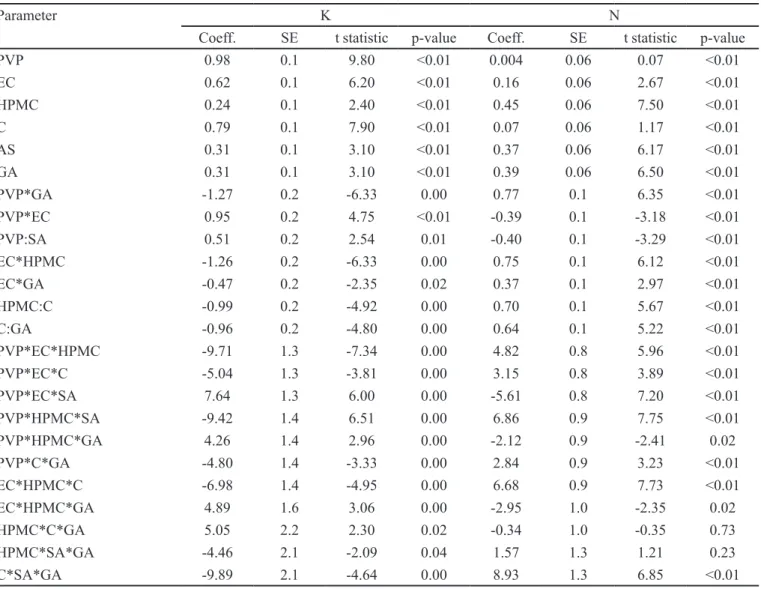
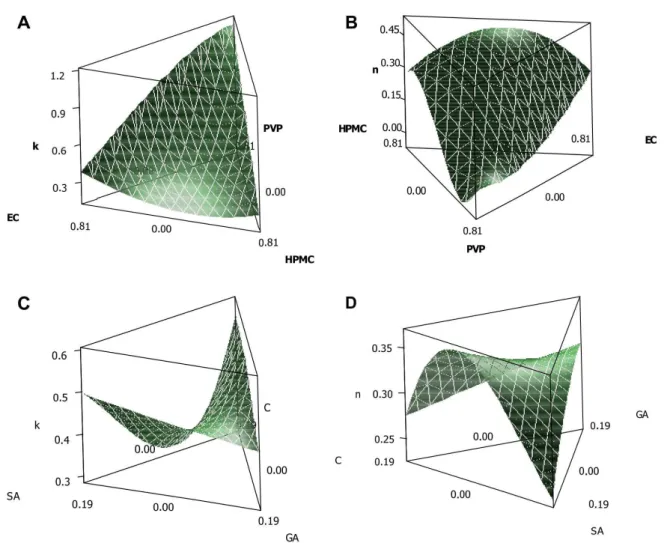
In the coeficients table a negative sign signiies an antagonistic effect, while a positive sign signiies a syner-gistic effect to the responses. It can be observed in Table III that the release rate increased greatly with increasing levels of PVP and carrageenan, whereas it decreased with increasing levels of sodium alginate, whereas gum arabic had a minor effect. Most of the second and third order interaction terms had a negative effect on release rate especially if PVP was present.
On the other hand, the release order (n) was found be positively influenced by increasing levels of the polymers studied, especially for HPMC. If this material is formulated alone with the drug a Fickian diffusion mechanism is expected. Conversely, if the matrix is mainly composed of PVP or carrageenan an anomalous release is expected.
TABLE III - Cubic model itting results for k and n
Parameter K N
Coeff. SE t statistic p-value Coeff. SE t statistic p-value
PVP 0.98 0.1 9.80 <0.01 0.004 0.06 0.07 <0.01
EC 0.62 0.1 6.20 <0.01 0.16 0.06 2.67 <0.01
HPMC 0.24 0.1 2.40 <0.01 0.45 0.06 7.50 <0.01
C 0.79 0.1 7.90 <0.01 0.07 0.06 1.17 <0.01
AS 0.31 0.1 3.10 <0.01 0.37 0.06 6.17 <0.01
GA 0.31 0.1 3.10 <0.01 0.39 0.06 6.50 <0.01
PVP*GA -1.27 0.2 -6.33 0.00 0.77 0.1 6.35 <0.01
PVP*EC 0.95 0.2 4.75 <0.01 -0.39 0.1 -3.18 <0.01
PVP:SA 0.51 0.2 2.54 0.01 -0.40 0.1 -3.29 <0.01
EC*HPMC -1.26 0.2 -6.33 0.00 0.75 0.1 6.12 <0.01
EC*GA -0.47 0.2 -2.35 0.02 0.37 0.1 2.97 <0.01
HPMC:C -0.99 0.2 -4.92 0.00 0.70 0.1 5.67 <0.01
C:GA -0.96 0.2 -4.80 0.00 0.64 0.1 5.22 <0.01
PVP*EC*HPMC -9.71 1.3 -7.34 0.00 4.82 0.8 5.96 <0.01
PVP*EC*C -5.04 1.3 -3.81 0.00 3.15 0.8 3.89 <0.01
PVP*EC*SA 7.64 1.3 6.00 0.00 -5.61 0.8 7.20 <0.01
PVP*HPMC*SA -9.42 1.4 6.51 0.00 6.86 0.9 7.75 <0.01
PVP*HPMC*GA 4.26 1.4 2.96 0.00 -2.12 0.9 -2.41 0.02
PVP*C*GA -4.80 1.4 -3.33 0.00 2.84 0.9 3.23 <0.01
EC*HPMC*C -6.98 1.4 -4.95 0.00 6.68 0.9 7.73 <0.01
EC*HPMC*GA 4.89 1.6 3.06 0.00 -2.95 1.0 -2.35 0.02
HPMC*C*GA 5.05 2.2 2.30 0.02 -0.34 1.0 -0.35 0.73
HPMC*SA*GA -4.46 2.1 -2.09 0.04 1.57 1.3 1.21 0.23
C*SA*GA -9.89 2.1 -4.64 0.00 8.93 1.3 6.85 <0.01
SE = standard error; Coeff. = Coeficient
Validation of the cubic model results
A numerical optimization technique using the desirability approach was employed to develop a new formulation with the desired responses. The optimization was done with the constraints for n of 0.36 and k of 0.31 as the goals to ind the optimum composition of polymers in the new formulation. Further, check points of the 10 formulations which fulilled the USP requirements were conducted. The experimental responses were compared to those predicted by the cubic models and the results are shown in Table IV. A high correlation was observed between the predicted and observed response variables (> 98%). The optimized formulation is composed of 68.7% ethylcellulose and ~6.3% of all other polymers, rendering k and n values of 0.28 and 0.41, respectively.
CONCLUSION
FIGURE 3 - Mixture surface plots for k and n. A. and B. SA, C and GA are held at 0.0626. C and D. PVP, HPMC and EC are held
at 0.0626, 0.0626 and 0.687, respectively.
TABLE IV – Validation runs for k and n
Formulation
Experimental values
Predicted values
R
2k
n
k
N
Target*
0.310
0.360
0.276
0.410
0.9826
F21
0.359
0.309
0.312
0.360
0.9954
F28
0.359
0.322
0.312
0.362
0.9973
F31
0.282
0.402
0.308
0.36
0.9977
F32
0.291
0.387
0.309
0.360
0.9990
F39
0.277
0.391
0.312
0.360
0.9987
F44
0.269
0.400
0.308
0.366
0.9985
F45
0.338
0.346
0.311
0.360
0.9994
F52
0.294
0.388
0.314
0.360
0.9989
F65
0.313
0.380
0.312
0.360
0.9995
F69
0.285
0.398
0.306
0.360
0.9981
ACKNOWLEDGMENTS
The authors would like to thank Professors Ana Giraldo and Constain Salamanca for their technical sup-port. The authors also thank the Pharmacy department for inancing this project.
REFERENCES
ADROVER, A.; GIONA, M.; GRASSI, M. Analysis of controlled release in disordered structures: a percolation model. J. Membrane Sci., v.113, p.21-30, 1996.
BARRY, B. W.; MEYER, M. C. The rheological properties of carbopol gels I. Continuous shear and creep properties of
carbopol gels. Int. J. Pharm., v.2, p.1-25,1979.
CHOULDHURY, P.K.; KAR, M; CHAUHAN, C.S. Cellulose acetate microspheres as a floating depot systems to increase gastric retention of antidiabetic drug: formulation, characterization and in vitro – in vivo evaluation. Drug Dev. Ind. Pharm. v.34, p.349-354. 2008.
CHOUDHURY, P.K.; KAR, M. Controlled release metformin hydrochloride microspheres of ethyl cellulose prepared by different methods and study on the polymer affected parameters. J. Microencapsul., v.26, p.46-53, 2009.
COLOMBO, P.; BETTINI, R.; CASTELLANI, P. L.; SANTI, P.; PEPPAS, N. A. Drug volume fraction proile in the gel phase and drug release kinetics in hydroxypropylmethyl cellulose matrices containing a soluble drug. Eur. J. Pharm. Sci., v.9, p.33-40, 1999.
COLOMBO, P.; BETTINI, R.; PEPPAS, N. A. Observation of swelling process and diffusion front position during swelling in hydroxypropyl methyl cellulose (HPMC) matrices containing a soluble drug. J. Control. Release,
v.61, p.83-91,1999.
CONTE, U.; COLOMBO, P.; GAZZANIGA, A.; SANGALLI, M. E.; LA MANNA, A. Swelling-activated drug delivery systems. J. Biomaterials, v.9, p.489-493, 1988.
CORTI, G.; CIRRI, M.; MAETRELLI, F.; MENNINI, N.; MURA, P. Sustained-release matrix tablets of metformin
hydrochloride in combination with triacethyl-β-cyclodextrin,
Eur. J. Pharm. Biopharm., v. 68, p.303-309. 2008.
CRANK, J. The mathematics of diffusion. 2.ed. Oxford: Clarendon Press, 1975. 414 p.
GOULDSON, M.P.; DEASY, P.B. Use of cellulose ether containing excipients with microcrystalline cellulose for the production of pellets containing metformin hydrochloride in the process of extrusion-spheronization. J. Microencapsul., v.14, p.137-153, 1997.
GRASSI, M.; LAPASIN, R.; PRICL, S. Modeling of drug release from a swellable matrix. Chem. Eng. Commun.,
v.169, p. 79-109,1998.
GRASSI, M.; VOINOVICH, D.; MONEGHINI, M.; FRANCESCHINIS, E.; PERISSUTTI, B.; FILIPOVIC-GRCIC, J. Theoretical and experimental study on theophylline release from stearic acid cylindrical delivery systems. J. Control. Release., v.92, p.275-289, 2003.
GRASSI, M.; VOINOVICH, D.; MONEGHINI, M.; FRANCESCHINIS, E.; PERISSUTTI, B.; FILIPOVIC-GRCIC, J. Preparation and evaluation of a melt pelletized paracetamol/stearic acid sustained release delivery system. J. Control. Release, v.88, p.381-391,2003.
GUSLER, G.; GORSLINE, J.; LEVY, G.; ZHANG, S.Z.; WESTON, I.E.; NARET, D.; BERNET, B. Pharmacokinetics of metformin gastric-retentive tablets in healthy volunteers. J. Clin. Pharmacol., v.41, p.655-661. 2001.
HAVLIN, S., BEN-AVRAHAM, D. Diffusion in Disordered
Media. Advanced Physics, v.36, p.695-798,1987.
HU, L.D.; LIU, Y.; TANG, X.; ZHANG, Q. E. Preparation and in vitro/in vivo evaluation of sustained release metformin hydrochloride pellets. J. Pharm. Biopharm., v.64 p.185-192, 2006.
JAIN, S.K.; GUPTA, A. Development of Gelucire 43/01 beads of metformin hydrochloride for loating delivery. AAPSPharmSciTech., v.10, p.1128-1136, 2009.
KARTTUNEN, P.; UUSITUPA, M.; LAMMINSIVU, U. The pharmacokinetic of metformin: a comparison of the properties of a rapid-release and sustained-release preparation. Int. J. Clin. Pharmacol. Ther. Toxicol, v.21, p.31-36, 1983.
LIAN-DONG, H.; LIU, Y.; TANG, X.; ZHANG, Q. Preparation and in vitro/in vivo evaluation of substained-release metformin hydrochloride pellets. Eur. J. Pharm. Biopharm., v.64, p.185-192, 2006.
MANDAL, U.; GOWDA, V; GHOSH, A.; SELVAN, S.; SALOMON, S.; PAL, T.K. Formulation and optimization of sustained release matrix tablet of metformin.HCl using response surface methodology. Yakugaky Zasshi., v.127, p.1281-1290, 2007.
OKAZAKI, Y.; ISHIZUKI, K.; KAWACHI, S.; KOMIYAMA, J. Ion-specific swelling and deswelling behaviors of ampholytic polymer gels. Macromolecules, v.29, p.8391-8399, 1996.
PENTIKAINEN, P.J. Bioavailability of metformin. Comparison of solution, rapidly dissolving tablet, and three sustained release products. Int. J. Clin. Pharmacol. Ther. Toxicol, v.24, p.213-220, 1986.
PENTIKAINEN, P.J., NEUVONEN, P.J., PENTILLA, A. Pharmacokinetics of metformin after intravenous oral administration to man. Eur. J. Clin. Pharmacol, v.16, p.195-202, 1979.
PHARMACOPOEIAL CONVENTION AND THE NATIONAL FORMULARY, “U.S. Pharmacopeia. The Standard of Quality,” USP34/NF29, United States Pharmacopeial Convention, New York, 2010.
RICKA, J.; TANAKA, T., Swelling of ionic gels: quantitative performance of the Donnan theory. Macromolecules, v.17,
p.2916-2926,1984.
RITGER, P.L.; PEPPAS, N. A. A simple equation for description of solute release II. Fickian and anomalous release from
swellable devices. J. Control. Release, v.5, p.37-42,1987.
RITU, B.; DIXIT, R.R.; GUPTA, H.V.; PATEL, P.S. Formulation and characterization of sustained release matrix tablet of metformin hydrochloride. Int. J. Pharm. Recent Res., v.1, p.49-53, 2009.
ROBERT, C. C. R.; BURI P. A.; PEPPAS N. A. Effect of degree of crosslinking on water transport in polymer microparticles. J. Applied Pol.Sci., v.30, p.301- 306, 1985.
SIEPMAN, J.; PEPPAS, N. A. Modeling of drug release from delivery systems based on hydroxypropylmethylcellulose (HPMC). Adv. Drug Rev., v.48, p.139-157, 2001.
STEPENSKY, D.; FRIEDMAN, M.; RAZ, I.; HOFFMAN, A. Pharmacokinetic-pharmacodynamic analysis of the glucose-lowering effect of metformin in diabetic rats reveals irst-pass pharmacodynamic effect. Drug. Metab. Dispos., v.30, p.861-868, 2002.
TANAKA, T.; FILLMORE, D.; SUN, S.; NISHIO, I.; SWISLOW, G.; SHAH, A., Phase-transitions in ionic gels. Phys. Rev. Lett., v.45, p.1636-1651,1980.
TUCKER, G.T.; CASEY, C.; PHILLIPS, P.J.; CONNOR, H.; WARD, J.D.; WOODS, H.F. Metformin kinetics in healthy subjects and in patients with diabetes mellitus. Br. J. Clin. Pharmac., v.12, p.235-246. 1981.
WU, X. Y.; ZHOU, Y. Finite element analysis of diffusional drug release from complex matrix systems. - II. Factors influencing release kinetics. J. Control. Release., v.51,
p.57-71,1998.
ZHOU, Y.; WU, X. Y. Finite element analysis of diffusional drug release from complex matrix systems. i. complex geometries and composite structures. J. Control. Release.,
v. 49, p.277-288,1997.
Received for publication on 22nd December 2010