*Correspondence: A. G. R. Solano. Universidade Federal de São João Del Rei, Campus Centro Oeste Dona Lindu. Rua Sebastião Gonçalves Coelho, 400, sala 201, bloco A, Chanadour - 35501-296 - Divinópolis - MG, Brasil. E-mail: [email protected]
A
rti
Pharmaceutical Sciences vol. 47, n. 3, jul./sep., 2011
Development of agar diffusion method for dosage of gramicidin
Ana Gabriela Reis Solano
1,2,*, Larissa de Melo Campos Sousa Pereira
2, Míriam de Fátima Vianna
Leonel
2, Elzíria de Aguiar Nunan
21Dona Lindu Mid-West Campus, Federal University of São João Del Rei, 2Department of pharmaceutical products, Faculty of
Pharmacy, Federal University of Minas Gerais
Gramicidin, an antimicrobial peptide active against Gram positive bacteria, is commonly used in pharmaceutical preparations for topical use. Considering that only the turbidimetric method has been described in the literature, the present study sought to develop and validate an agar diffusion method for the dosage of gramicidin. The method was developed and validated using the Kocuria rhizophila ATCC 9341 as a test microorganism. Two designs were used: a 3x3 parallel-line model, and a 5x1 standard curve. The validation demonstrated that the method follows the linear model (r2= 0.994), presenting a signiicant
regression between the zone diameter of growth inhibition and the logarithm of the concentration within the range of 5 to 25.3 μg/mL. The results obtained for both designs were precise, having a relative standard deviation (R.S.D.) for intra-day precision of 0.81 for the 3x3 assay and 1.90 for the 5x1 assay. For the inter-day precision, the R.S.D. was 1.35 for the 3x3 and 2.64 for the 5x1. The accuracy was veriied and results conirmed to be accurate, having a tolerance interval of 95%, which lay within permitted limits and appropriate trueness. In addition, the method was considered selective, with limit of detection and upper and lower limits of quantiication of 2.00, 5.00 and 25.3 μg/mL, respectively. No difference in precision between the designs used in the agar diffusion method was evident (p>0.05). The method proved to be appropriate for the microbiological dosage of the raw material gramicidin.
Uniterms: Gramicidin/microbiological assay. Microbiological assay/method validation. Agar diffusion. Cylinder-plate.
A gramicidina, um peptídeo antimicrobiano ativo contra bactérias Gram positivo, é utilizada em preparações farmacêuticas de uso tópico. Neste trabalho procurou-se desenvolver e validar outro método para o doseamento de gramicidina tendo em vista que somente o método turbidimétrico é descrito. O método de difusão em ágar foi desenvolvido e validado utilizando como microrganismo teste Kocuria rhizophila ATCC 9341. Foram utilizados dois delineamentos: retas paralelas 3x3 e curva padrão 5x1. A validação demonstrou que o método segue o modelo linear (r2= 0,994) havendo regressão signiicativa
entre o diâmetro dos halos de inibição e o logaritmo da concentração na faixa de 5,00 a 25,3 µg/mL. Os resultados obtidos por ambos os delineamentos foram precisos apresentando desvio padrão relativo (DPR) para precisão intra-dia de 0,81 para ensaio 3x3 e de 1,90 para ensaio 5x1. Para a precisão inter-dias o DPR foi de 1,35 para 3x3 e de 2,64 para 5x1. A exatidão foi veriicada e os resultados foram exatos apresentando intervalo de tolerância a 95% dentro dos limites permitidos e veracidade adequada. O método foi seletivo com limites de detecção e quantiicação inferior e superior iguais a 2,00, 5,00 e 25,3 µg/mL, respectivamente. Não foi observada diferença entre a precisão dos delineamentos empregados no método de difusão em ágar (p>0.05). O método se mostrou adequado para a dosagem microbiológica de gramicidina matéria-prima.
INTRODUCTION
Gramicidin is a neutral linear pentadecapeptide present in the antimicrobial mixture tyrothricin (grami-cidin + tyro(grami-cidine), produced by Bacillus brevis. Isolated gramicidin acts against Gram positive bacteria, forming canals speciically for monovalent metals and ammonium cations in cell membrane, thus increasing its permeability (Koo et al., 2001).
This material is used in pharmaceutical forms for isolated topical use, or in combination with other antibiot-ics for the treatment of bacterial infections (Bosscha et al., 2004; Zaias et al., 1981).
Previous studies in the literature have reported on the turbidimetric method for determining the ac-tivity of the raw material gramicidin (United States Pharmacopoeia, 2008; British Pharmacopoeia, 2007). However, in practice, this method has proven to be inef-fective and relatively susceptible to variations, thus lead-ing to non-repeatable results and to the need for several repetitions.
In 1958, Vuilleumier and Anker developed the agar diffusion method to determine the potency of tyrothricin, but this method called for a long period of pre-diffusion of approximately 8 hours, yet only small zone diameters could be obtained (Vuilleumier, Anker, 1958). This meth-od was mmeth-odiied by Viola and Canestrini in 1966 who, to obtain larger zone diameters, increased the pre-diffusion time even more (20 hours). These methods, used to deter-mine the proper potency of tyrothricin, proved to be un-suitable for normal laboratory routines, considering that they demanded an extensive time period for execution and were never validated because no such procedures were required at the time. After 1966, no other informa-tion regarding the dosage of tyrothricin or gramicidin can be found.
Against this background, the present study set out to develop an agar diffusion method for determining the dosage of the raw material gramicidin and to validate it by means of parameters of selectivity, accuracy, calibration curve, precision, robustness, and detection and quantii-cation limits (Hubert et al., 2007a,b; Rozet et al., 2007a; Brasil, 2003; FDA, 2001; ICH, 1996).
MATERIALS AND METHODS
Raw material and reference standard
Gramicidin – substance of reference (Sigma-Aldri-ch, potency 960 μg/mg) and raw material (Alpharma).
Reagents and solvents
Sodium Chloride (Synth), dibasic potassium phos-phate (Synth), monobasic potassium phosphos-phate (Synth), ethyl alcohol (Synth), methanol (Merck), polysorbate 80 (Synth), meat extract (Prodimol), yeast extract (Prodimol), tryptone (Oxoid), glucose (CRQ), lactalbumin (Difco), casamine (Difco), and agar (Difco).
Microorganisms and inoculums
The cultures of Kocuria rhizophila ATCC 9341,
Staphylococcus aureus ATCC 6538, Staphylococcus
epi-dermidis ATCC 12228, and Enterococcus hirae ATCC
10541 were supplied by the Brazilian National Health and Quality Control (INCQS, RJ, Brazil), cultivated in antibio-tic medium 1 and maintained in a refrigerator (4 ± 2 ºC). Twenty-four hours before the assay, a new pealing was performed to obtain the inoculum at 1.0 ± 0.1 of absor-bance, at 580 nm in a 0.9% sodium chloride solution. To select the test microorganism, 0.5 and 0.25 mL of this sus-pension were added to 100 mL of antibiotic medium 1 at 47 ± 2 ºC, which was used as an inoculated layer. For the dosage of gramicidin, the surface layer consisted of inocu-lated nutrient agar with K. rhizophila (inoculum at 0.1%).
Culture media and solutions used
Antibiotic medium 1 (Difco), nutrient agar (Prodi-mol – 5 g of gelatin peptone, 3 g of meat extract, 5 g of yeast extract, 5 g of glucose, 15 g of agar in 1000 mL of water), 7.0 pH buffer (13.6 g of dibasic potassium phos-phate and 4.0 g of monobasic potassium phosphos-phate in 1000 mL of water) were used.
Determination of assay conditions
a culture medium were also performed. Different ranges of gramicidin concentrations that lay within the 5.00 to 100 μg/ mL interval were also tested. The assessment of the assayed conditions was carried out by comparing the sharpness and the zone diameter of growth inhibition obtained.
Dosage of gramicidin using nutrient agar
Two layers of agar were used, with one non-inoculated layer containing 21 mL of nutrient agar (base medium) and the other containing 4 mL of inoculated nutrient agar at 0.1%. Six stainless steel cylinders, mea-suring 8 x 6 x 10 mm, were placed on the surface of the inoculated medium. For the 3x3 design, three alternating cylinders were illed with 200 μL of standard solutions (three concentrations), while the other three were illed with the sample solutions (three concentrations). Five assays were performed each using eight plates. For the 5x1 design, three cylinders were illed with 200 μL of the reference solution (concentration of11.3 μg/mL), while the other three were illed with either the standard solu-tion (concentrasolu-tions of 5.00, 7.50, 16.9, or 25.3 μg/mL) or the sample solution (11.3 μg/mL). In each assay, three plates per concentration were prepared, except for that of the reference solution. Five assays were also performed. All plates were left for 1 hour at room temperature and then incubated at 36.5 ºC for 18 hours.
Standard solution preparation
Exactly 25 mg of reference standard gramicidin was weighed and transferred to a volumetric lask of 25 mL and dissolved in ethyl alcohol at 95% (concentration of 1000 μg/mL). Aliquots of the solution were diluted in polysorbate 80 at 1% to obtain the concentrations of 5.00, 7.50, 11.3, 16.9, and 25.3 μg/mL used in the 5x1 design, whereas 5.00, 10.0, and 20.0 μg/mL were used in the 3x3 design.
Sample preparation
The raw material sample was prepared by the same procedure used for the reference standard.
Method validation
The method was validated by determining the pa-rameters of calibration curve, precision, accuracy, robus-tness, selectivity, and detection and quantiication limits (Hubert et al., 2007a,b; Rozet et al., 2007a; Brasil, 2003; FDA, 2001; ICH, 1996).
Calibration curve
The calibration curve was obtained using ive re-ference standard concentrations (5.00, 7.50, 11.3, 16.9, and 25.3 μg/mL), whose assays were performed on four different days.
Precision
Precision of the method was determined by repe-atability (intra-assay) and intermediate precision (inter-assay). Repeatability was assessed, in triplicate, through the assay of solutions at concentrations of 2.50, 5.00, and 10.0 μg/mL (50%); 5.00, 10.0, and 20.0 μg/mL (100%); and 7.50, 15.0, and 30.0 μg/mL (150%) for the 3x3 design and in quintuplicate of solutions at concentrations of 5.00, 11.3, and 25.3 μg/mL for the 5x1 design, all on the same day. Intermediate precision was veriied by evaluating the results on two different days.
Accuracy
Accuracy was determined by means of microbio-logical assay, in quintuplicate, of the reference standard solutions at concentrations of 5.00, 11.3, and 25.3 μg/mL for the 5x1 design. For the 3x3 design, reference standard solutions at concentrations of 2.50, 5.00, and 10.0 μg/mL (50%); 5.00, 10.0, and 20.0 μg/mL (100%); and 7.50, 15.0, and 30.0 μg/mL (150%) were assayed in triplicate. The assays were performed on two different days.
Selectivity
Limits of Detection and Quantification
To determine the detection and lower quantiication limits, reference standard solutions at concentrations 1.00, 2.00, 3.00, and 4.00 μg/mL and the diluent were assayed by the 5x1 design. The upper quantification limit was determined using the 5x1 design with reference standard solutions at concentrations of 28.0, 30.0, and 32.0 μg/mL. The assays were carried out on two different days.
Robustness
To evaluate robustness, reference standard solutions at concentrations 5.00, 7.50, 11.3, 16.9, and 25.3 μg/mL were assayed in nutrient agar with a pH adjusted to 6 and 8, and on plates with a base layer consisting of either an-tibiotic medium 1 or a culture medium of the same com-position as nutrient agar substituting the gelatin peptone for tryptone, casamine, or lactalbumin.
Statistical analysis
The analysis of variance (ANOVA) was used to compare the results obtained under the different conditions tested, such as the selection of the test microorganism, concentration of the inoculum, use of different diluents, and different concentration of gramicidin, to determine the detection and quantiication limits. The Bonferroni test was used as a test of averages.
The calibration curves constructed were assessed through residue analysis (homoscedasticity, normality, and independence of residues) and linear regression analysis using the ordinal least squares method (Souza, Junqueira, 2005; Finney, 1978). The analysis of covariance (ANCOVA) was used to compare the calibration curves obtained on different days to assess linearity as well as under the different conditions tested for the robustness parameter (Snedecor, Cochran, 1996).
To calculate the potency of the raw material gra-micidin by the 3x3 design, the Hewitt equation was used (Hewitt, 2004). The assay was tested statistically using the parallel linear model, residue analysis, and linear regression analysis. The ANOVA test was used to verify the validity of the assay (Souza, Junqueira, 2005; Finney, 1978).
For the 5x1 design, the equation below was applied to correct the growth inhibition:
–yPcj = –yPj + (=yP3 – –yP3j);
in which –yPcj is the corrected average of the zone diameter
of growth inhibition corresponding to the concentration present on the j plate; –yPj is the average of the zone
diame-ter of growth inhibition corresponding to the concentration
present on the j plate; =yP3 is the average of all the averages
of the zone diameter of growth inhibition corresponding to the concentration of 11.3 μg/mL; –yP3j is the average of
the zone diameter of growth inhibition corresponding to the concentration of 11.3 μg/mL present on the j plate. Three corrected averages of the zone diameter of growth inhibition were obtained for each concentration, not in-cluding the reference concentration (11.3 μg/mL), which was used for the correction. To calculate the potency of the raw material gramicidin, the Hewitt equation was used (Hewitt, 2004). The assay was analyzed statistically using residue analysis and linear regression analysis (Souza, Junqueira, 2005; Finney, 1978). The signiicance level for all the analyses was α = 0.05.
RESULTS AND DISCUSSION
K. rhizophila ATCC 9341 was the strain chosen as
the test microorganism because it produced a larger and clearer zone diameter of growth inhibition than the other tested microorganisms: S. aureus ATCC 6538, E. hirae
ATCC 10541 and S. epidermidis ATCC 12228.
Gramicidin has poor water solubility and low diffu-sibility, aspects which stem from its chemical structure. It contains the terminal N and C groups, linked to the formyl and ethanolamine groups, respectively. Hence, gramicidin is uncharged at all pH values, which explains its low solubility in water (Koo et al., 2001). In addition, it possesses a high molecular weight. These properties justify the low diffusibility of the molecule in solid culture medium, thus generating small zones of growth inhibition (Viola, Canestrini, 1966).
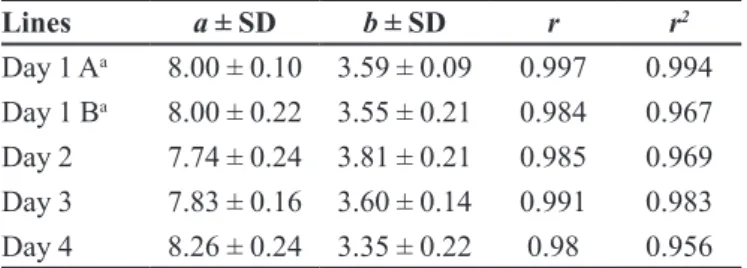
11.18 (R.S.D. 0.54%) for 7.50 μg/mL; 11.75 (R.S.D. 1.13%) for 11.3 μg/mL; 12.35 (R.S.D. 1.05%) for 16.9 μg/mL, and 13.07 (R.S.D. 0.29%) for 25.3 μg/mL. Five calibration cur-ves were constructed (Table I), two on the same day and the remainder on different days. All presented a coeficient of correlation (r) greater than 0.98 (Brasil, 2003; FDA, 2001) and when compared, no signiicant difference was found between the intercepts and slopes.
The 3x3 design assay proved to be valid for the concentrations 5.00, 10.0, and 20.0 μg/mL, inserted wi-thin the linear range 5.00 to 25.3 μg/mL. No deviation of parallelism or signiicant curvatures was observed. In addition, the residue analysis for both the standard’s and sample’s curves demonstrated that the linear model was appropriate for both.
The repeatability (intra-assay) and intermediate precision (inter-assays) were expressed as the relative standard deviation of a series of measures. The results are shown in Table II. The relative deviations were well below
15% for all levels of concentrations tested, thus indicating appropriate intra- and inter-assay precision (Brasil, 2003; FDA, 2001).
According to the trueness parameter, there was no evidence indicating systematic errors in either experi-mental design (Hubert et al., 2007a; Rozet et al., 2007a; INMETRO, 2003). Upon plotting the potencies determi-ned experimentally vs. the theoretical value, a line was obtained. The experimental values were approximate to the true values, thus the line did not shift away from the ideal line, in which the intercept was equal to zero and the slope was equal to one, in turn proving the absence of systemic errors (Rozet et al., 2007a; INMETRO, 2003).
The method had appropriate accuracy, as can be seen by the values calculated for the β tolerance interval (Figure 1) for each concentration level, which showed a maximum variation of 15% for both designs (Hubert et al., 2007a, b; Rozet et al., 2007a; FDA, 2001). Accuracy is represented by the combination of the random (precision) and systematic (trueness) errors, which were considered in the β tolerance interval calculation. This represents the interval in which β% of the future individual results is expected (Rozet et al., 2007b).
The method proved to be selective for gramicidin as the degradation product assayed by the microbiological method showed only local activity at the tested concen-trations, with no signiicant difference between the zone diameter of growth inhibition of the different concentra-tions and that of the diluent. In addition, the degradation of gramicidin was proven by the absence of the characteristic peaks of the antibiotic within the chromatogram of the degradation product (Figure 2).
To determine the limit of detection, upon comparing the zone diameter of growth inhibition of the different
con-TABLE I - Parameters of calibration curve (intercept – a, slope –
b, coeficient of correlation – r, and coeficient of determination - r2) for gramicidin within the range 5.00 to 25.3 µg/mL
Lines a ± SD b ± SD r r2
Day 1 Aa 8.00 ± 0.10 3.59 ± 0.09 0.997 0.994
Day 1 Ba 8.00 ± 0.22 3.55 ± 0.21 0.984 0.967
Day 2 7.74 ± 0.24 3.81 ± 0.21 0.985 0.969
Day 3 7.83 ± 0.16 3.60 ± 0.14 0.991 0.983
Day 4 8.26 ± 0.24 3.35 ± 0.22 0.98 0.956
aLines 1A and 1B were obtained on the same day, while 2, 3,
and 4 were obtained on different days.
TABLE II - Results of potency of solutions of different concentrations of gramicidin determined by agar diffusion method to study
precision and accuracy
Replicates 5.00 µg/mL 11.3 µg/mL5x1 Design 25.3 µg/mL 50% 3x3 Design100% 150%
1 2 3 4 5 5.37 5.30 5.21 5.17 4.97 11.10 11.59 11.33 11.09 11.40 25.26 25.13 24.93 25.02 25.11 51.99 50.12 48.30 101.40 101.76 102.97 152.05 148.03 149.76 1 2 3 4 5 5.25 4.96 5.25 5.42 5.11 11.75 11.34 10.96 11.71 10.94 25.71 25.98 25.09 25.54 25.35 47.68 52.64 50.38 102.72 99.44 100.30 159.75 147.16 148.36
Intra-assay average 2.96 1.90 0.49 3.68 0.81 1.34
FIGURE 2 - Chromatogram obtained through analysis of raw material (A) and degradation product (B) of gramicidin using HPLC method.
FIGURE 1 - Accuracy proile obtained for method of microbiological dosage of gramicidin using 3x3 and 5x1 designs. Dashed
centrations of gramicidin (1.00, 2.00, 3.00 e 4.00 μg/mL) and of the diluent, a signiicant difference was found be-tween them. It was shown that the lowest concentration to produce a zone diameter of growth inhibition different to that of the diluent was 2.00 μg/mL. This value was thus considered the limit of detection. The results for the potency of the concentrations 2.00, 3.00, 4.00, 28.0, 30.0, and 32.0 μg/mL were neither precise nor accurate. Never-theless, satisfactory results were obtained when using the concentrations 5.00 and 25.3 μg/mL (Table II), determined as the upper and lower quantiication limits, respectively.
A parallelism between the lines obtained when using the nutrient agar with a pH of 6, 7, and 8 was evident. However, a reduction in the zone diameter of growth inhibition was seen within the pH conditions of 6 and 8. A similar result was obtained when antibiotic medium 1 was used as a base layer. Upon using other media as base layers, no growth of the test microorganism was observed. Therefore, the pH conditions and composition of the me-dium should be controlled.
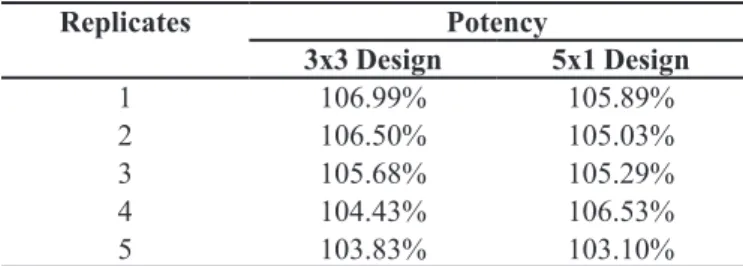
The experimental values for the potency of grami-cidin in the sample are given in Table III. The combined potency for the 3x3 design was 105.37%, whereas for the 5x1 design was 105.22%, with an estimated conidence interval at 95% ranging from 102.34% to 108.49% and 102.27% to 108.25%, respectively. Such results are wi-thin pharmacopoeic speciications for the potency limit (900 μg/mg) and conidence limit (± 5%), thus proving that the method produced appropriate and precise results (British Pharmacopoeia, 2007).
The precision of the designs was compared, and no signiicant difference was found.
CONCLUSION
These results indicated that the microbiological as-say of the cylinder-plate method offered good precision, accuracy, selectivity, as well as an appropriate calibration curve in the concentration range of 5.00 to 25.3 μg/mL.
Therefore, this method can be used to quantify the activity of the raw material gramicidin.
ACKNOWLEDGEMENTS
The authors wish to thank CNPq for their inancial support and Kinder for its kind donations of raw materials.
REFERENCES
BOSSCHA, M., DISSEL, J., KUIJPER, E., SWART, W., JAGER, M., The eficacy and safety of topical polymyxin B, neomycin and gramicidin for treatment of presumed bacterial corneal ulceration. Br. J. Ophthalmol., v.88, n.1, p.25-28, 2004.
BRASIL. Resolução RE n°899 de 29 de Maio de 2003. Guia para validação de métodos analíticos e bioanalíticos. ANVISA.
Diário Oficial da União. Poder Executivo, Brasília DF, 02 de Junho de 2003. Available at: <www.anvisa.gov.br>. Accessed on: 11 nov. 2009.
BRITISH pharmacopoeia. London: Her Majesty’s Stationery Ofice, 2007. CD-ROM.
FOOD AND DRUG ADMINISTRATION. Guidance for Industry, Bioanalytical Methods Validation, 2001. Available at: <www.fda.gov>. Accessed on: 11 nov. 2009.
FINNEY, D. J. Statistical method in biological assay. 3.ed.
London: Charles Grifin & Co. Ltd., 1978. 508 p.
HEWITT, W. Microbiological assay for pharmaceutical analysis: a rational approach. 1.ed. New York: INTERPHARM, 2007. 260 p.
HUBERT, P.; NGUYEN-HUU, J.; BOULANGER, B.; CHAPUZET, E.; CHIAP, P.; COHEN, N.; COMPAGNON, P.; DEW’E, W.; FEINBERG, M.; LALLIER, M.; LAURENTIE, M.; MERCIER, N.; MUZARDI, G.; NIVET, C.; VALAT, L.; ROZET, E. Harmonization of strategies for the validation of quantitative analytical procedures A SFSTP proposal – Part II. J. Pharm. Biom. Anal., v.45, n.1, p.70-81, 2007a.
HUBERT, P.; NGUYEN-HUU, J.; BOULANGER, B.; CHAPUZET, E.; COHEN, N.; COMPAGNON, P.; DEW´E, W; FEINBERG, M.; LAURENTIE, M.; MERCIER, N.; MUZARD, G.; VALAT, L.; ROZET, E. Harmonization of strategies for the validation of quantitative analytical
procedures A SFSTP proposal–Part III. J. Pharm. Biom.
Anal., v.45, n.1, p.82-96, 2007b.
TABLE III - Potency data obtained in analysis of raw material
gramicidin using microbiological assay of diffusion on plates
Replicates Potency
3x3 Design 5x1 Design
1 106.99% 105.89%
2 106.50% 105.03%
3 105.68% 105.29%
4 104.43% 106.53%
INTERNATIONAL CONFERENCE ON HARMONISATION.
ICH. Topic Q2B Validation of analytical procedures:
methodology. Geneva: ICH Secretariat, 1996. 9 p.
ISHII, S.; WITKOP, B. Gramicidin A. II. Preparation and
Properties of “seco-Gramicidin A. J. Am. Chem. Soc., v.86,
n.9, p.1848-1853, 1964.
KOO, S.; BAYER, A.; YEAMEN, M. Diversity in antistaphylococcal mechanisms among membrane-targeting
antimicrobial peptides. Infect. Imun., v.69, n.8,
p.4916-4922, 2001.
ROZET, E.; CECCATP, A.; HUBERT, C.; ZIEMONS, E.; OPREAN, R.; RUDAZ, S.; BOULANGER, B.; HUBER, P. Analysis of recent pharmaceutical regulatory documents
on analytical method validation. J. Chromatogr. A, v.1158,
n.1-2, p.111-125, 2007a.
ROZET, E., HUBERT, C., CECCATO, A., DEWÉ, W., ZIEMONS, E., MOONEN, F., MICHAIL, K., WINTERSTEIGER, R., STREEL, B., BOULANGER, B., HUBERT, B. Using tolerance intervals in pre-study validation of analytical methods to predict in-study results.
The fit-for-future-purpose concept. J. Chromatogr. A,
v.1158, n.1-2, p.126-137, 2007b.
SNEDECOR, G.W.; COCHRAN, W.G. Statistical methods.
8.ed. Ames: Jowa State University, 1996. 503 p.
SOUZA, S.V.C.; JUNQUEIRA, R.G. A procedure to assess
linearity by ordinary least squares method. Anal. Chim.
Acta, v.552, n.1-2, p.25-35, 2005.
UNITED STATES PHARMACOPOEIA. 31.ed. Rockville: The United States Pharmacopeial Convention, 2008. p.103-109.
VIOLA, M.R.; CANESTRINI, C. Sulla determinazione microbiologica della tirotricina. Boll. Chim. Farm., v.105, n.9, p.688-694, 1966.
VUILLEUMIER, M.; ANKER, L. Mikrobiologische wertbestimmung von antibiotika in der Pharmacopoea
Helvetica. Pharm. Acta Helv., v.33, n.2, p.621-633, 1958.
ZAIAS, N.; McCORMICK, G.; DILORENZO, P.; KANOF, N.; SCHOCH, E.; SCHNEIDERMAN, N. Topical combination therapy for cutaneous candidiasis: a double-blind trial. Curr. Ther. Res. Clin. Exper., v.29, n.3, p.463-476, 1981.
Received for publication on 19th October 2010