Sebastião
Cavalcante de Sousa
Professor at Federal University of Cariri – Crato (CE), Brazil.Vládia Pinto
Vidal de Oliveira
Professor at Federal University of Ceará – Fortaleza (CE), Brazil.
Karin Stock
de Oliveira Souza
Hohenheim University – Stuttgart, Alemanha.
Josefa Maria
Francieli da Silva
Agronomist – Crato (CE), Brazil.Francisco Ramon
da Cunha Alcântara
Agronomist – Crato (CE), Brazil. Endereço para correspondência: Sebastião Cavalcante de Souza – Rua José Sátiro Vilar, 138, apto. 08 – Alto da Penha –63104-060 – Crato (CE), Brasil – E-mail: scsousaufc@hotmail.com
RESUMO
The detection and monitoring of environmental degradation requires both low-cost and easy-to-perform techniques. This study intended to conduct sampling and use geostatistics to predict the spatial variability of environmental degradation indicators. The field of study was the micro-drainage basin of the Itacuruba creek in Itacuruba (PE). The georeferenced samples were subjected to sulfuric acid to determine organic carbon, iron oxide, aluminum oxide and molecular relation of ki and altitude. The data were statistically analyzed where only the altitude presented normal distribution and the organic carbon did not present spatial dependence, which indicated it was a degraded area. The iron oxide content in the soil surface is a good indicator of an environmental degradation index, and future sampling may be spaced in 600 m in the Itacuruba region (PE). Geostatistics is presented as an efficient, low cost predictor for studying environmental degradation and monitoring.
Keywords: sulfuric attack, spatial dependence, pedotransfer.
ABSTRACT
A detecção e o monitoramento da degradação ambiental exigem técnicas de baixo custo e de fácil execução. O presente estudo objetivou realizar amostragem e utilizar a geoestatística para predizer a variabilidade espacial de dados indicadores de degradação ambiental. A área de estudo foi a microbacia hidrográfica do riacho Itacuruba, em Itacuruba (PE). As amostras georreferenciadas foram submetidas ao ataque sulfúrico determinando: carbono orgânico, óxido de ferro, óxido de alumínio, relação molecular ki e altitude. Os dados foram analisados estatisticamente onde somente a altitude apresentou distribuição normal e o carbono orgânico não apresentou dependência espacial, significando ser uma área degradada. O teor de óxido de ferro na superfície do solo se apresenta como um bom indicador de índice de degradação ambiental e as amostragens futuras podem ser distanciadas de 600 m na região de Itacuruba (PE). A geoestatística apresenta-se como boa preditora, de baixo custo, para estudos de degradação e monitoramento ambiental.
Palavras-chave: ataque sulfúrico, dependência espacial, pedotransferência.
THE SPATIAL VARIABILITY OF THE ENVIRONMENTAL
DEGRADATION LEVEL IN ITACURUBA (PERNAMBUCO, BRAZIL)
O USO DA GEOESTATÍSTICA PARA AVALIAÇÃO DA
INTRODUCTION
The process of desertification involves several variables with narrow interrelationships and considerable spa-tial variability. The geostatistical analysis of primary or secondary data, conducted by different authors (GOO-VAERTS, 1997; ISAAKS & SRIVASTAVA, 1989; VIEIRA et al., 2008), is an appropriate and significant tool for the anal-ysis of properties that vary from one location to another with some degree of organization or continuity, which are expressed through spatial dependence (VIEIRA, 2000). Using mathematical prediction tools, several studies have been developed to predict soil properties, such as moisture retention (AQUINO et al., 2009); hydrau-lic conductivity (NEBEL et al., 2008); penetration re-sistance (ALMEIDA et al., 2008); and genesis (SIRTOLI et al., 2008). Morphological attributes and soil classi-fication have been measured and analyzed by geosta-tistics to correlate soil management systems and re-sults, as well as to predict physical properties (GRECO et al., 2011).
Geostatistics first appeared in South Africa, through the work of mining engineer Daniel Gerhardus Krige and statistician Herbert Sichel, who performed statisti-cal statisti-calculations for estimating natural reserves (KRIGE, 1951). Krige worked with spatial data using samples of concentrated gold, and concluded that the variances that considered the distances between samples proved to be more useful in the future prospection.
Later on, calculations received a formal treatment by Matheron (1971), who defined the geostatistics name as a study technique for variables that have spatial con-ditioning. The localized variable is a numerical spatial function ranging from one sampling point to another, but with an apparent continuity. The behavior of these variables is represented by two mathematical tools, the semivariogram and kriging (LANDIM, 2006).
The analysis of soil data, considering spatial indepen-dence, is conducted using statistical methods such as variance analysis and the variation coefficient. How-ever, for the analysis of data that present dependency on the distance in one dimension, the autocorrelation is used. When the data present spatial dependence in two dimensions, and require interpolation between two samples, the most suitable tool is the semivario-gram (VIEIRA, 2000).
The semivariogram is a graphic expression, which can be estimated by Equation 1, varying in magnitude and direction, with respect to vector h. When the semivar-iogram graph is identical to any direction h, it is isotro-pic; and when it presents different behavior in different directions, it is anisotropic. Equation 1 is based on the assumption of stationarity of order 2, that is, it implies the existence of a finite variance of the measured val-ues (LANDIM, 2006; VIEIRA, 2000).
h N h z x z x h ( ) 1 2 ( ) [ ( ) ( )] N h 1 1 2 1 ( )
∑
γ = − + α− (1) Where: h N h z x z x h ( ) 1 2 ( ) [ ( ) ( )] N h 1 1 2 1 ( ) ∑
γ = − + α −is semivariogram with respect to vector h; [z(xi) - z(xi + h)] 2 is an increment of attribute z with a
distance h; and
N(h) is the amount of pairs of measured values Z(xi), Z(xi+h), separated by a vector h.
The equation shows three characteristics with varia-tion of h: h=0, when the semivariogram has a positive value, which is called nugget effect – C0 (nugget ef-fect); when it reaches a certain distance, semivariance will not increase and will stabilize at a value equal to the average variance, this region is called silo or land-ing – C0+C1 (sill); and the distance correspondland-ing to the beginning of silo is called range, signifying the end of spatial dependence among samples (LANDIM, 2006; VIEIRA, 2000).
The evaluation of the spatial dependence level of soil properties can be performed using the classifica-tion provided by Cambardella et al. (1994), which is based on the ratio C0/(C0+C1) as follows: strong – the semivariograms that have a nugget effect = 25% of the level; moderate – nugget effect between 25 and 75%; and weak – nugget effect > 75%.
Modeling is the key part in determining the semivario-gram; it consists of an adjustment of an experimental variogram through a trial process. The semivariogram should be adjusted to a theoretical model that will set the following parameters: nugget effect, range and level. Among the most used models are the spheri-cal, exponential and Gaussian models. Adjustments should be compared under two conditions: when the model has a defined positivity and the analysis (r2)
Kriging, the name given by Matheron in honor of Daniel Krige, is an interpolation methodology that estimates values. It uses the spatial dependence of neighboring samples. Through the distances between measured points, it is possible to make estimates for unmeasured locations, thus making the construction of maps possi-ble (LANDIM, 2006; VIEIRA, 2000).
Kriging uses information from the semivariogram to find optimal weights to be associated with samples that will estimate a point, an area, or a block. As the semivariogram is a function of the distance between sampling locations while maintaining the same num-ber of samples, the weights are different according to their geographical arrangement. The closer they are, the greater the weight in the estimation process (LANDIM, 2006; VIEIRA, 2000).
The estimator is a weighted moving average that can be expressed by Equation 2 (LANDIM, 2006; VIEIRA, 2000).
z x( ) z x( ) z x( ) ... kz x( )k iz x( )i i n 0 1 1 2 2 1 =λ +λ + +λ =
∑
λ = (2) Where:N is the number of measured values,
z (xi), which is involved in the estimation, and λi are the weights associated with each measured value, z (x).
Fiorio (2002) conducted studies comparing soil data obtained in the laboratory (oxides and molecular re-lationships between Ki and Kr) and orbital data using multiple linear regressions through the Statistical Anal-ysis System (SAS). The soil data were obtained with sul-furic attack. The equations found provided maps that were highly correlated in comparison with convention-al maps.
The sulfuric attack is the method for determining levels of silicon, iron, aluminum and titanium, and the con-tents of these elements in the soil. Their molecular re-lations (ki and kr) indicate the pedologic degree of soil development (FERREIRA, 2008). The amount and dis-tribution of these elements within the soil profile are useful for predicting potential for plant development (CAMARGO et al., 2009).
Studies conducted by Souza et al. (2010), using the sul-furic attack on a toposequence in Pernambuco, showed that the iron oxide content increases with depth in
profile, with the iron and magnesium minerals content located in the source rock and rainfall. The silicon and aluminum oxide content also increase with moisture, while ki is inversely proportional, meaning it is higher in dry regions and lower in humid regions.
Soil carbon, in the inorganic form (carbonates, bicar-bonates and carbon dioxide) and in the organic form (polysaccharides, fatty acids, amino acids, polyphe-nols, among others), is found in the biomass of micro-organisms, plant and animal remains during the de-caying process. In Brazil, the total carbon varies from 0.2 to 5.0 dag.kg-1, except for peat soil that can reach up
to 50 dag.kg-1. The most used technique to determine
this fact is the Walkley-Black, which uses dichromate in an acid medium as the oxidizing agent (MENDONÇA & MATOS, 2005).
Diniz Filho et al. (2009) performed the classification of physical, morphological, and chemical soil groups, lo-cated in semi-arid Midwest region of the state of Rio Grande do Norte, whose rocky foundation, granite and gneiss provided the formation of shallow soils. In this study, the soils presented organic carbon (C) and organic matter (OM) expressed in percentage ranging from 0.04% to 2.71%, and 0.07% to 4.67%, respectively. Arruda (2008) characterized the agricultural environ-ments and the main soils in the city of Guarabira (PB), which is geologically composed of granite and gneiss. The Litholic Neosols presented the organic carbon con-tent ranging from 2.04 to 7.43 g.kg-1.
Martins et al. (2010) studied areas in Floresta (PE) and found 13 g.kg-1 in preserved areas, 10.9 g.kg-1 in
moder-ately degraded areas and 5.0 g.kg-1 in degraded areas,
which directly influence the microbial population of the soil. Other attributes that also varied were nutri-ents, acidity, and base saturation.
Cavalcante et al. (2007) studied the spatial variability of organic matter and other soil attributes under dif-ferent uses and management in Selvíria (MS) using a regular grid (14 x 14 points) totaling 64 points sam-pled at regular intervals of 2 m. Data were analyzed in GS+ (ROBERTSON, 1998), concluding that the OM has greater spatial dependence structure in the area with a naturally preserved system.
The region where the micro-drainage basin of the Ita-curuba creek is located in the São Francisco River Valley
in Pernambuco presented pebbles on the terraces and interfluves of river headwaters. This seems to prove the existence of a past period of wet weather in the region followed by intense drought, thus justifying the intense pediplanation and presence of inselbergs rang-ing from 100 to 300 meters (ARAÚJO FILHO et al., 2000; JACOMINE et al., 1973).
Studies in this area have detected a high level of environmental degradation. The main causes of degradation were deforestation and inadequate
ag-ricultural uses that led to the unprotected soil and consequent erosion, resulting in ecological imbal-ance (SÁ et al., 2006).
Based on the hypothesis that the use of mathematical tools are useful for the prediction and monitoring of environmental degradation in large areas, this study intended to conduct the survey of primary data in the field, spatially referenced, in the municipality of Ita-curuba (PE), and to use geostatistics to predict the spa-tial variability of environmental degradation indicators.
MATERIAL AND METHODS
Characterization of the field of study
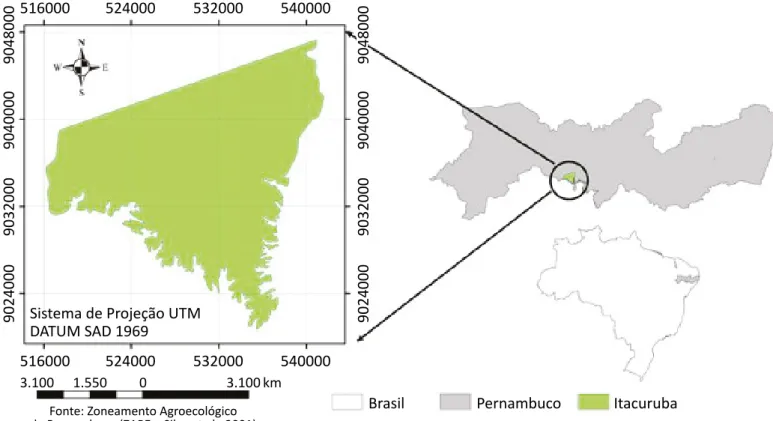
The micro-drainage basin of the Itacuruba creek is located between the geographic coordinates 08°43’47,5”and 08°48’07,8” South latitude and 38°40’54,3”and 38°43’38,1” West longitude, insert-ed in an area of 1,750.66 hectares. The Itacuruba creek is a tributary of the São Francisco River,
flow-ing into the Lake of Itaparica in the city of Itacuruba (PE) (Figure 1).
The area studied has predominantly Precambri-an rocks, with schist Precambri-and gneiss showing greater expression. It is located in the geoenvironmental
Source: ZAPE (Silva et al., 2001).
Figure 1 – Location of the municipality Itacuruba (PE).
532000 540000 9048000 9040000 9032000 9024000 9048000 9040000 9032000 9024000 516000 524000 532000 540000 516000 524000
Sistema de Projeção UTM DATUM SAD 1969
3.100 1.550 0 3.100 km
Fonte: Zoneamento Agroecológico de Pernambuco (ZAPE – Silva et al., 2001)
Itacuruba
unit named Depressão Sertaneja, which is the typ-ical landscape of the northeastern semiarid region, characterized by a rather monotonous pediplanation surface, ranging from soft-curled to mountainous relief (ARAÚJO FILHO et al., 2000; JACOMINE et al., 1973; CPRM, 2005).
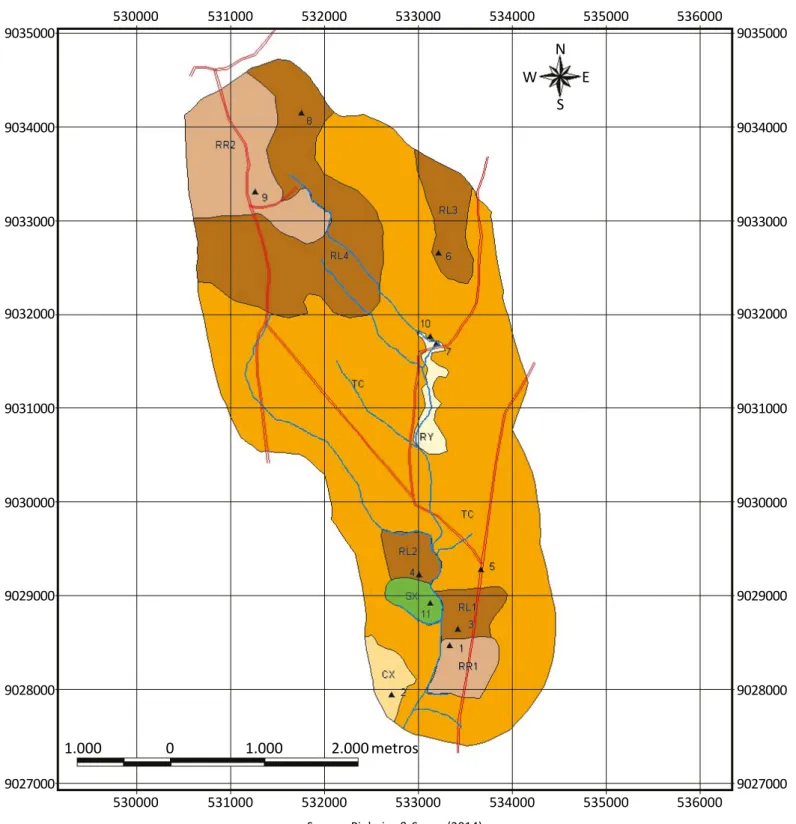
The soils mainly developed from acidic metamorphic rocks (gneiss), at its greatest extent, and also, in smaller expression, from sedimentary formations. The soils found by Silva et al., (2001), Pinheiro & Sousa (2014), Araújo Fil-ho et al. (2000) and Jacomine et al. (1973) belonged to the following classes, according to the Brazilian System of Soil Classification (SiBCS) (EMBRAPA, 2013): Luvisols (TC), Litholic Neosols (RL), Regolitic Neosols (RR), Fluvisols (RY), Cambisols (CX) and Planosols (SX) (Figure 2).
The Planosols, poorly drained, present average nat-ural fertility and salt problems, plain topography, oc-cur near the Itaoc-curuba creek. The Fluvisols, sandy, low relief, occur bordering the streams. Cambisols, of medium texture, medium fertility, and low relief occur in the lower thirds of waste crests. Regolitic Neosols, sandy and low relief, occur in the lower thirds of waste crests. Luvisols, clay based, high fer-tility, relief ranging from mild wavy to corrugated, are distributed across the surface. Litholic Neosols, shallow, stony and rocky with a wavy relief ranging from wavy to mountainous, are located in resid-ual ridges and higher elevation tops (ARAÚJO FIL-HO et al., 2000; JACOMINE et al., 1973).
In Itacuruba (PE), the average annual rainfall is 391.0 mm, with a minimum of 88.0 mm and a max-imum of 748.0 mm, in the month of March it has a higher concentration of rainfall (ITEP, 2014). The an-nual evapotranspiration is 1,500 mm (POSSAS, 2011). The average annual temperature ranges from 22 °C to 24 °C. The area is within the Koppen classification BSwh, with very hot semiarid climate. According to
Gaussen classification, the area closest to the São Fran-cisco River was rated by 2b – hot subdesertic trending tropical (JACOMINE et al., 1973)
The species found belong to the vegetable formation
hyperxerophilic caatinga, showing a significant degree
of xerophytes where the main families are: Cactaceae,
Euphorbiaceae, Malvaceae, Leguminoseae and Bro-meliaceae. They are woody formations, xerophile and
thorny, which are characterized by falling leaves of vir-tually all the species during the dry season. Within this area, the vegetation shows variations concerning the size (tree, a mix of shrub and tree, and shrub) and den-sity (dense, sparse and open) (JACOMINE et al., 1973). The most frequent species are: Aspidosperma
pyr-ifolium Mart (pereiro), Caesalpinia pyramidalis Tul.
(catingueira), Cnidoscolus phyllacanthus (Muell. Arg.) Paxand K. Hoffm. (favela), Pilocereus gounellei Weber (xiquexique), Opuntias pp. (quipá), Bromelia laciniosa Mart (macambira), Spondias tuberosa Arruda
(umbu-zeiro), Cereus jamacuru DC. (mandacaru), Bumelia sar-torum (quixabeira), Maytenus rigida Mart (bom nome), Leptophloeos bursera Mart (umburana-de-cambâo), Jathropha pohiliana (pinhão bravo).
The Itacuruba creek is located in the fields of drain-age basin of the São Francisco River, with the Ta-manduá creek as its main tributary. It features stan-dard dentritic drainage and the waterways have an intermittent cycle. The area is part of the hydro-geological fissural domain, crystalline basement, with underground water presenting high electri-cal conductivity and high content of soluble solids (salts) (CPRM, 2005).
Human settlement in the current day Itacuruba (PE) oc-curred in the early 1990s with the flooding of Itaparica Lake, resulting from the construction of the Luiz Gonza-ga Hydroelectric Plant. Currently, extensive cattle rais-ing is the main activity maintained by locals.
Cartographic and computer science material
In order to execute the studies, microcomputers and necessary peripherals (printers, scanners) and software SURFER 8.0Ò (SURFER, 2002) and ArcView
GIS 3.2Ò (ESRI, 1999) were used. The geographic
lo-calization of the sampled points was found with a navigational GPS (global positioning system)
receiv-er at the datum SAD 69 with the approximation receiv-error of 3 meters.
The areas were delimited at the ArcView Version GIS 3.2 (ESRI, 1999) through the usage of satellites im-ages TM LANDSAT 5 orbit-point 216_66, Itacuruba (PE), on September, 26 2000 (INPE, 2010).
Field material
The pedologic procedures were performed with
the help of the following materials: shovel, hoe, plastic bags, strings, tags, field forms, and naviga-tional GPS.
Source: Pinheiro & Sousa (2014).
FIgure 2 – Map of soil distribution in the micro-drainage basing of Itacuruba creek.
533000 534000 535000 536000 9035000 9034000 9033000 9032000 9031000 9030000 9029000 9028000 9027000 9035000 9034000 9033000 9032000 9031000 9030000 9029000 9028000 9027000 532000 531000 530000 533000 534000 535000 536000 532000 531000 530000 N E S W 1.000 0 1.000 2.000 metros
Field methods
The sampled points were chosen randomly in open ar-eas with no tree or bush cover, where the material was removed from the superficial width of 1 cm. At each point approximately 1 kg of soil was collected and their coordinates (GPS) and latitude were noted.
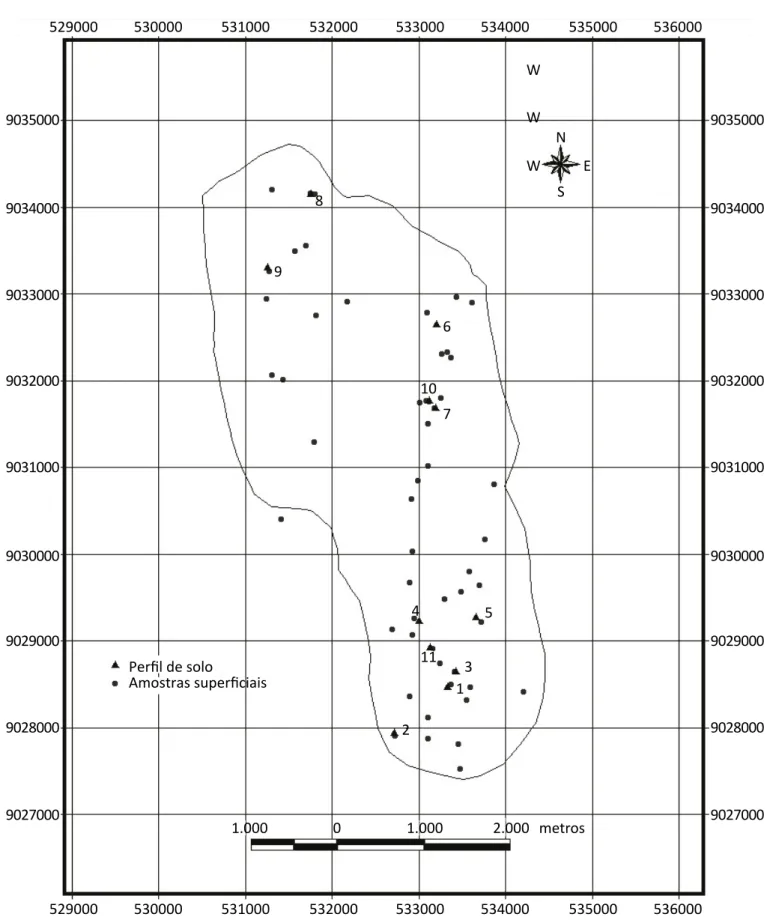
Fifty-three points and 11 superficial horizons of excavated profiles in a pedologic study at the micro-drainage basin of the Itacuruba creek (PIN-HEIRO & SOUSA, 2014) were sampled, reaching a total of 64 samples.
Laboratory methods
The analysis in this study followed Mendonça & Matos’ (2005) methodology for organic carbon and
the Camargo et al. (2009) methodology for the sul-furic attack.
Organic carbon
The soil samples were triturated in mortar, sifted with a 80 mm mesh sieve, weighed and put into test tubes for the digester block. Next, the solution of potassium dichromate 0.4N and sulfuric acid H2SO4 was added and then taken to the digestion at 170 °C for 30 minutes.
After the digestion, it rested until it reached room temperature and it was washed with distilled wa-ter. The solution was poured in a 250 ml Erlenmeyer, three drops of the diphenylamine indicator was added, and then a titration was conducted with a solution of ammonium iron sulfate 0.1N.
Sulfuric attack
The analysis followed the routine according to Camargo et al. (2009). The soil samples were triturated in mor-tar, sifted with a sieve of 0.5 mm mesh, and weighed and put in digester tubes. Next, sulfuric acid solution 18N was added, a funnel was put on top of the tubes to avoid rapid evaporation, and they were taken to the block digester. After boiling them for one hour, cooling them down, washing the tubes, they percolated and were taken to a volumetric flask after four washes of the filtrate.
The filtrate in the homogenized flask with deionized water is extract A. The total residue retained from the paper filter is transferred to tall stainless steel cups, with approximately 100 ml of deionized water. Next, 2 ml of NaOH solution at 30% is added and the solution is boiled for two minutes. After cooling, this solution will be transferred to a volumetric flask and its volume will be filled with deionized water and HCl 6N solution, resulting in extract B.
Silicon
Prepare the calibration curve and the sample contain-ing: 1 ml of the extract B, 2 ml of sulfomolybdic solu-tion, and 50 ml of deionized water. After 10 minutes, add 2 ml of tartaric acid solution at 20% and agitate.
After five minutes, add a little portion of ascorbic acid, fill the flask with deionized water, and shake it. Af-ter one hour, do a reading with a spectrophotomeAf-ter at 655.5 nm.
Aluminium
Prepare the calibration curve and transfer the sample containing 5 ml of extract A to a 100 ml volumetric flask, fill it, and shake it. Transfer an aliquot of 1 ml to a volumet-ric flask of 50 ml containing 25 ml of deionized water and
add 2 ml thioglycolic acid at 1%. Add exactly 10 ml of buf-fer solution pH 4.2 containing 0.04 % of Aluminon. Fill the flask with deionized water and shake it. After two hours, take a reading with a spectrophotometer at 534 nm.
Iron
Prepare the calibration curve and sample containing: 1 ml of extract A, deionized water, a pinch of ascorbic acid, 5 ml of 1,10-o-phenantroline at 0.25% and 2 ml of trisodium citrate at 25%. Fill the container and shake it.
After resting for 15 minutes, read it with a spectropho-tometer at 518 nm.
Molecular relation SiO2/Al2O3 (Ki) is calculated by the formula: Ki = (% SiO2 x 1,70) / (% Al2O3).
Statistics analysis
The data from the analyzed soils were: organic car-bon, iron oxide, aluminium oxide, and the molecular relationship between ki and altitude. These variables were analyzed through descriptive statistical analysis and geostatistics techniques. The geostatistics analy-sis demands that the data follows the normality hy-pothesis (intrinsic); Vieira (2000) and Landim (2006) state this hypothesis was tested on GS+ 7.0 softwareÒ
(ROBERTSON, 1998).
The regression analysis was made with ExcelÒ in
ac-cordance to Fiorio (2002). For the descriptive statis-tics the Kolmogorov-Smirnov test was used in order to verify the normality with SURFER 8.0Ò (SURFER, 2002)
software. The geostatistics analysis was conducted on GS+ 7.0Ò (ROBERTSON, 1998) software in accordance
to Cavalcante et al. (2007).
The semivariograms were adjusted by trial process and considered the linear, spherical, exponential and Gaussian models. In the process of choosing the best adjustment, the positivity of the model was consid-ered, in addition to the relationship C0/(C0+C1) of spa-tial dependency, the gained correlation coefficient (r2)
according to the methodology used by Vieira (2000) and Landim (2006), and the regression coefficient ob-tained with kriging’s cross-validation, used by Cavalca-nte et al. (2007).
The spatial dependency grade of the soil’s attributes was determined through the usage of the Cambardella et al. (1994) classification, which is based on the rela-tionship C0/(C0+C1) as follows: strong – the semivar-iograms that has the nugget effect = 25% of the level; moderate – nugget effect in between 25 and 75%; and weak – nugget effect > 75%.
RESULTS AND DISCUSSIONS
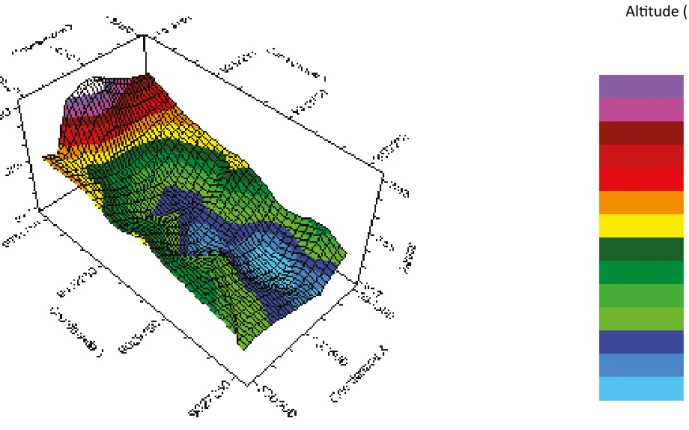
The digital elevation model (DEM) of the micro-drainage basin of the Itacuruba creek can be seen in Figure 3 and the geographical positions of the sampled points are
distributed according to Figure 4. The highest elevation can be observed to occur in the northwest region of the micro-basin, and it decreases as it goes southwest.
Descriptive statistics
The descriptive statistics is summarized in Table 1. The critical value found for the statistics of the Komol-gorov-Smirnov test with 64 samples and level of signif-icance α at 0.05 was 0.17.
From the studied variables, only altitude is observed to show normality by the Kolmogorov-Smirnov test, a mean close to the median. Since the altitude is the result of a long geologic period, human activities do not put morphogenesis’ pressure on this variable. All other variables taken from the soil surface do not show nor-mality due to the existing high level of environmental degradation, a result that is similar to the one found by Cavalcante et al. (2007), who found normality in the
variables of a preserved area and abnormality in de-graded areas.
Although the studied variables are located in a semi-arid and semi-arid environment, and that it shows a rocky basement, biotite-gneiss, gneiss and schist (Jacomine et al., 1973; Araújo Filho et al., 2000), the high amount of iron oxide and low ki is observed to contradict the results found by Souza et al. (2010). Whereas low plu-viometric precipitations can be verified today, confirm the findings of Jacomine et al. (1973) and Araújo Filho et al. (2000) who affirmed that there must have been a more humid past than the current conditions at the studied area.
The proportions of organic carbons found are within the levels stated by Arruda (2008), Diniz Filho et al. (2009) and Mendonça & Matos (2005). The propor-tions of iron and aluminium oxides indicate an elevated pedologic development, with the presence of Cambisol and Luvisol, thus confirming the results found by Cam-argo et al. (2009) and Ferreira (2008).
The distancing of the observed minimum and maxi-mum values caused the verified high variances. Iron oxide was the variable that showed the biggest ob-served variance. The iron oxide was the variable that suffered most variation within the space, suggesting it would be a good indicator of the environmental deg-radation by erosion.
Table 2 presents the results of the regression analysis between the altitudes and the other variables, indicat-ing that the relief shows interference on the iron oxide values. The most representative soils in the micro-ba-sin are the Luvisols, which present increased pedo-genesis, high concentrations of iron oxide, and greater
susceptibility of erosion even in the slightly undulated terrains and hills.
The differential erosion of the soil’s colloid in the stud-ied area is directly related to the relief, the pluviometric precipitation, land usage, and the modification of the
caatinga’s forest covering caused by human actions,
confirming the Sá et al. (2006) studies at the inland of Cabrobó (PE).
The spatial variation of organic carbon occurs because of the intense water deficit and biodiversity loss in both degraded and preserved areas, confirming the results gathered by Martins et al. (2010).
The data’s geostatistics of the organic carbon, iron oxide, aluminium, and ki regionalized variables is summarized in Table 3. It can be observed that the organic carbon at the micro-drainage basin of the Itacuruba creek does not present spatial dependency, thus characterizing it as the pure nugget effect. Additionally, it does not present itself as a good indicator for environmental degradation. The other variables present moderate spatial
dependen-Figure 3 – Digital elevation model of the micro-drainage basin of the Itacuruba creek.
393 Altitude (m) 388 383 378 373 368 363 358 353 348 343 338 333 327 322 317
533000 534000 535000 536000 9035000 9034000 9033000 9032000 9031000 9030000 9029000 9028000 9027000 9035000 9034000 9033000 9032000 9031000 9030000 9029000 9028000 9027000 532000 531000 530000 529000 533000 534000 535000 536000 532000 531000 530000 529000 N E S W 1 2 3 4 5 6 7 10 9 8 11 W W Amostras superficiais Perfil de solo 1.000 0 1.000 2.000 metros
Statistics OC (g.kg-1) Fe 2O3 (g.kg-1) Al2O3 (g.kg-1) ki Altitude (m) Mean 10,27 221,77 38,73 0,97 332,53 Median 8,39 152,59 30,51 0,59 329,50 Standard deviation 10,24 169,59 29,24 1,31 13,89 Minimum 0,00 36,74 4,00 0,10 313,00 Maximum 66,06 708,03 133,88 9,35 376,00 Variance 104,77 28.760,00 855,13 1,72 193,17 Variation coefficient 0,99 0,76 0,76 1,35 0,042 Kurtosis 14,47 1,07 0,91 26,83 0,97 Asymmetry 3,27 1,35 1,19 4,60 1,03 d 0,22 0,21 0,20 0,25 0,11ns
Table 1 – Descriptive statistics of the variables, organic carbon, iron oxide, aluminium oxide, molecular relationship between (ki) and altitude (m) at the micro-drainage basin of the Itacuruba creek.
Note: d = statistics of the Kolmogorov-Smirnov test; ns There is no significance at 5% probability; OC – organic Ccrbon; Fe
2O3 – iron oxide; Al2O3 – aluminium oxide; ki – molecular relation (SiO2x1,7/Al2O3).
Variables VS DF SS MS F F of signification
Altitude x organic carbon
Regression 1 704.27 704.27
4.4313 0,0395ns
Residual 60 9536.00 158.93
Total 61 10240.27
R² - 0,9312
Altitude x iron oxide
Regression 1 15.89 15.89
0.0811 0,7768*
Residual 62 12154.05 196.03
Total 63 12169.94
R² - 0,9987
Altitude x aluminium oxide
Regression 1 865.48 865.48 4.7468 0,0332ns Residual 62 11304.45 182.33 Total 63 12169.94 R² - 0,9889 Altitude x Ki Regression 1 2198.82 2198.82 13.6722 0,0004ns Residual 62 9971.12 160.82 Total 63 12169.94 R² - 0,8193
Note: VS = variation source; DF = degrees of freedom; SS = sum of squares; MS = mean square; F = significance level of the F test; R2 = coefficient of determination; *significant difference; ns non-significant difference; ki = molecular relation (SiO
2x1,7/Al2O3)
Table 2 – Results of the variance of altitude interference
cy, as was established by Cambardella et al. (1994), and a similar result for organic matter was found by Caval-cante et al. (2007) and Greco et al. (2011) for degraded areas with conventional culture systems.
The correction of the abnormality trend presented in the data via the Kolmogorov-Smirnov test was made with the Gaussian and exponential models, which offered the smallest amount of error and biggest coefficient of deter-mination, confirming Vieira (2000) and Landim (2006). Generally, the soils of the studied area showed a higher concentration of ki and organic carbon at the surface and lower concentration in the area beneath the sur-face, and the opposite happens with the concentra-tions of aluminium and iron oxides, thus confirming the results found by Fiorio (2002) and Ferreira (2008). The ki presented a range of 1844 m, indicating that it is not losing spatial dependency with the erosive process and consequently would not be a good indicator of envi-ronmental degradation.
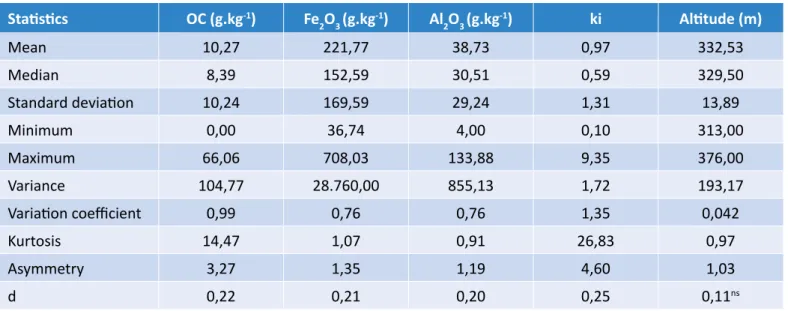
It can be observed in Figure 5 that the biggest concen-trations of aluminium oxide are located in the lower regions of the micro-basin, where there is a prepon-derance of Luvisols. Meanwhile, the smallest values at the higher regions are located where there is a preponderance of Litolic Neosols, and intermediate values at the center of the micro-basin, with a pre-ponderance of Luvisols.
It can be observed in Figure 6 that the smallest ki are located at the lower region of the micro-basin, close to the Itaparica Lake, related to the Cambisols, Regolitic Neosols, Planosol and Luvisol. The biggest values are located in the higher region, related to the Litolic Neosols, where there is less humidity and intermediate values are located at the center of the micro-basin.
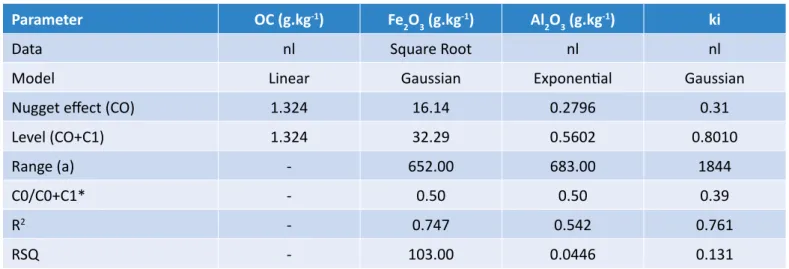
It can be observed in Figure 7 that the largest val-ues of organic carbon are located at the higher re-gion of the micro-basin, in the Indigenous Territories of the Pakarás Serrote dos Campos, with the stony Litolic Neosols. Despite the presence of a strongly undulated terrain, the area shows a high resistance to erosion due to the stony covering over 100% of the surface. The organic matter distribution of the space has no relationship with the altitude, the soils, or the micro-basin location.
It can be observed in Figure 8 that the largest values of iron oxide can be found at the more active part of the relief with a predominance of Luvisols, and the smallest values are in the flat areas, where Regolitic Neosols, Planosols and Cambisols dominate, all with a sandy surface texture, indicating a direct relationship between the concentration of iron oxide and altitude with the erosive processes.
Parameter OC (g.kg-1) Fe
2O3 (g.kg-1) Al2O3 (g.kg-1) ki
Data nl Square Root nl nl
Model Linear Gaussian Exponential Gaussian
Nugget effect (CO) 1.324 16.14 0.2796 0.31
Level (CO+C1) 1.324 32.29 0.5602 0.8010
Range (a) - 652.00 683.00 1844
C0/C0+C1* - 0.50 0.50 0.39
R2 - 0.747 0.542 0.761
RSQ - 103.00 0.0446 0.131
Note: O.C. – Organic Carbon; Fe2O3 – iron oxide; Al2O3 – aluminium oxide; ki – molecular relation (SiO2x1,7/Al2O3); nl – naperian logarithm; *Spatial Dependence Rate; R2 = coefficient of determination; RSQ = residual sums square
Table 3 – Characteristics of the experimental semivariograms for the variables,
9034196 9031968 9029740 9027512 530500 532000 533500 535000 Coo rd Y Coord X Aluminum oxide (g/kg) 54,6 47,5 40,5 33,4 26,3 19,2 12,1
Figure 5 – Map of the distribution of aluminium oxide at the micro-drainage basin of Itacuruba creek.
Figure 6 – Map of distribution of ki at the micro-drainage basin at Itacuruba creek.
9034196 9031968 9029740 9027512 530500 532000 533500 535000 Coo rd Y Coord X ki 2,26 1,92 1,59 1,25 0,91 0,58 0,24
Figure 7 – Map of the organic carbon distribution at the micro-drainage basin of the Itacuruba creek 9034196 9031968 9029740 9027512 530500 532000 533500 535000 Coo rd Y Coord X Organic carbono (g/kg) 59,6 49,8 40,1 30,4 20,7 11,0 1,2
Figure 8 – Map of the iron oxide distribution at the micro-drainage basin of the Itacuruba creek.
9034196 9031968 9029740 9027512 530500 532000 533500 535000 Coo rd Y Coord X Iron oxide (g/kg) 579 492 406 319 233 146 60
The largest concentration of iron oxide occurs in the area under the surface. The areas represented by pro-files 5 and 10 (Pinheiro & Sousa, 2014) were exposed by the erosion processes, confirming the results found by Sá et al. (2006), Fiorio (2002), and Ferreira (2008). The concentrated values at the surface, similar to those profiles and varying between 253 to 462 g.kg-1, are
much smaller than the verified values in the soil
hori-zons, respectively, 474.45 and 708 g.kg-1, and the
differ-ence is erased by the superficial flow from heavy rains. The small values of ki and larger values of aluminium oxide at the proximity of the Itaparica Lake show the influence of greater humidity existing in the area of the São Francis-co River and the existence of a more humid past, Francis- confirm-ing Araújo Filho et al. (2000) and Jacomine et al. (1973).
The use of geostatistics to predict the environmental degradation
The morphogenesis process in equilibrium with the pedo-genesis maintains the concentration of iron oxide close to the values gathered at its respective superficial horizon. The disequilibrium, stemming from the predominance of the morphogenesis, provides iron oxide concentrations close to the values of its respective soil horizons, due to the erosion of the superficial horizon, confirming the studies of Greco et al. (2011) and Ferreira (2008). The analysis of the kriging maps obtained by the geostatistics and the analysis of the descriptive and regression statistics show the iron oxide
concentra-tions at the soil surface as a good indicator of the environmental degradation rate, which is affirmed by Fiorio (2002).
In future studies, and complying with the methodolo-gy described by Vieira (2000) and Landim (2006), the gathering of primary data (superficial samples for the sulfuric attack) can be realized in a grid. The points should be spaced of 600 m at the Itacuruba (PE) region, providing a better kriging for the variation of concen-tration of iron oxide, organic carbon, aluminium oxide and ki.
REFERENCES
ALMEIDA, C. X.; CENTURION, J. F.; FREDDI, O. S.; JORGE, R. F. e BARBOSA, J. C. Funções de pedotransferência para a curva de resistência do solo à penetração. R. Bras. Ci. Solo, Viçosa, n. 32, p. 2235-2243, 2008.
AQUINO, L. S.; TIMM, L. C.; NEBEL, A. L. C.; MIOLA, E. C. C.; PARFITT, J. M. B.; PAULETTO, E. A. Avaliação da capacidade de funções de pedotransferência em predizer a estrutura de variabilidade espacial. In: SIMPÓSIO DE GEOESTATÍSTICA APLICADA EM CIÊNCIAS AGRÁRIAS, 4. Anais... Botucatu, 14-15 maio, 2009.
ARAÚJO FILHO, J. C.; BURGOS, N.; LOPES, O. F.; SILVA, F. H. B. B.; MEDEIROS, L. A. R.; MELO FILHO, H. F. R; PARAHYBA, R. B. V.; CAVALCANTI, A. C.; OLIVEIRA NETO, M. B.; SILVA, F. B. R.; LEITE, A. P.; SANTOS, J. C. P.; SOUSA NETO, N. C.; SILVA, A. B.; LUZ, L. R. Q. P.; LIMA, P. C.; REIS, R. M. G.; BARROS, A. H. C. Levantamento de reconhecimento de baixa e média intensidade dos solos do Estado de Pernambuco. Embrapa Solos, Boletim de Pesquisa; 11. Rio de Janeiro, 2000. 378 p.
ARRUDA, S. V. Caracterização de ambientes agrícolas e dos principais solos do município de Guarabira-PB. 2008. 105 p. Tese (Doutorado em Agronomia) – Centro de Ciências Agrárias, Universidade Federal da Paraíba, Areia, 2008. 105 p.
CONCLUSIONS
• The geostatistics analysis has indicated that the iron oxide concentration at the soil surface is directly re-lated to the superficial erosion. Additionally, it shows itself as an efficient, low cost tool in analyzing the envi-ronmental degradation that occurs in a certain region.
• This methodology can be used to monitor the ex-pansion of degradation or the environmental recu-peration of degraded areas.
CAMARGO, O.A.; MONIZ, A. C.; JORGE, J. A.; VALADARES, J. M. A. S. Métodos de análise química, mineralógica e física
de solos do Instituto Agronômico de Campinas. Campinas, Instituto Agronômico, 2009. 77 p. (Boletim técnico, 106,
Edição revista e atualizada).
CAMBARDELLA, C.A.; MOORMAN, T. B.; NOVAK, J. M.; PARKIN, T. B.; KARLEN, D. L.; TURKO, R. F.; KONOPKA, A. E. Field-scale variability of soil properties in central Iowa. Soil Science Society of American Journal, Madison, v. 58, n. 5, p. 1501-1511, 1994.
CAVALCANTE, E. G. S.; ALVES, M.C.; PEREIRA, G.T.; SOUZA, Z.M. Variabilidade espacial de MO, P, K e CTC do solo sob diferentes usos e manejos. Ciência Rural, Santa Maria, v. 37, n. 2, p. 394-400, mar-abr, 2007.
CPRM. Serviço Geológico do Brasil. Projeto cadastro de fontes de abastecimento por água subterrânea. Diagnóstico do município de Itacuruba, Estado de Pernambuco. MASCARENHAS, J. C.; BELTRÃO, B. A.; SOUZA JUNIOR, L. C.; GALVÃO, M. J. T. G.; PEREIRA, S. N.; MIRANDA, J. L. F. (Org.). CPRM/PRODEEM, Recife, 2005. 311 p.
DINIZ FILHO, E. T.; SOBRINHO, F. E.; SILVA, F. N.; MARACAJÁ, P. B.; MAIA, S. S. S. Caracterização e uso de solos em região semi-árida do médio oeste do Rio Grande do Norte. Revista Caatinga, Mossoró, v. 22, n. 3, p. 111-120, jul. 2009. EMPRESA BRASILEIRA DE PESQUISA AGROPECUÁRIA. Sistema Brasileiro de Classificação de Solos. SANTOS, H. G.; JACOMINE, P. K. T.; ANJOS, L. H. C.; OLIVEIRA, V. A.; LUMBRERAS, J. F.; COELHO, M. R.; ALMEIDA, J. A.; CUNHA, T. J. F.; OLIVEIRA, J. B. (eds.). 3. ed. ver. ampl. EMBRAPA-SPI, Brasília, 2013. 353 p.
ESRI. Environmental Systems Research, Institute, Inc. 1999.
FERREIRA, C. A. Gênese de Latossolos Acinzentados em topossequência de Latossolos das chapadas do alto do vale do Jequitinhonha (MG). Dissertação (Mestrado em Produção vegetal) – Pró-Reitoria de Pesquisa e Pós-Graduação, Universidade Federal dos Vales do Jequitinhonha e Mucuri. 2008. 84 p.
FIORIO, P. R. Dados radiométricos obtidos nos níveis terrestre e orbital na avaliação de solos. 2002. 198 p. Tese (Doutorado) – Escola Superior de Agricultura Luiz de Queiroz, Universidade de São Paulo. 2002.
GOOVAERTS, P. Geostatistics for natural resources evaluation. New York, Oxford University Press, 1997. 483 p.
GREGO, C. R.; COELHO, R. M.; VIEIRA, S. R. Critérios morfológicos e taxonômicos de Latossolo e Nitossolo validados por propriedades físicas mensuráveis analisadas em parte pela geoestatística. Rev. Bras. Ciênc. Solo. vol. 35, p. 337-350, 2011. INSTITUTO DE TECNOLOGIA DE PERNAMBUCO (ITEP). Rainfall data. Available in: <http://www.itep.br/>. Accessed in April, 10 2014.
INSTITUTO NACIONAL DE PESQUISA ESPACIAL. Image Catalog. Available in: <http://www.dgi.inpe.br/CDSR/≥. Accessed in November, 16 2010.
ISAAKS, E. H.; SRIVASTAVA, R. M. An introduction to applied geostatistics. New York, Oxford University Press, 1989. 561 p. JACOMINE, P. K. T.; CAVALCANTI, A. C.; PESSOA, S. C. P.; SILVEIRA, C. O. Levantamento exploratório-reconhecimento de solos do estado de Pernambuco. v.1, Recife, Ministério da Agricultura/Sudene, 1973. 359 p.
KRIGE, D. G. A statistical approach to some basic mine valuation problems on the Witwatersrand. Journal of the
Chemical, Metallurgical and Mining Society of South Africa, Dec. 1951, p. 119-139.
LANDIM, P. M. B. Sobre geoestatística e mapas. Terræ Didática, v. 2, n. 1, p. 19-33, 2006.
MARTINS, C. M.; GALINDO, I. C. L.; SOUZA, E. R.; POROCA, H. A. Atributos químicos e microbianos do solo de áreas em processo de desertificação no semiárido de Pernambuco. Rev. Bras. Ciênc. Solo, v. 34, p. 1883-1891. 2010.
MATHERON, G. The theory of regionalized variables and its application. Les Cahiers du Centre de Morphologie
Mathematique, Fas. 5, C. G. Fontainebleau, 1971.
MENDONÇA, E. S.; MATOS, E. S. Matéria orgânica no solo: métodos de análises. Viçosa, 2005. 77p.
NEBEL, A. L. C.; AQUINO, L. S.; MIOLA, E.C.C.; PAULETTO, E. A. Avaliação de funções de pedotransferência na estimativa de parâmetros hídricos em um solo de várzea no município de Capão do Leão – RS. In: CONGRESSO DE INICIAÇÃO CIENTÍFICA, 17, 2008 e ENCONTRO DE PÓS-GRADUAÇÃO, 10, 2008. Pelotas. Anais... Pelotas, 2008.
PINHEIRO, R. S.; SOUSA, S. C. Classificação técnica e etnopedológica de solos da bacia hidrográfica do riacho Itacuruba. 2014, 75 p. Monografia (Graduação em Agronomia) – Centro de Ciências Agrárias, Universidade Federal do Ceará, Fortaleza, 2014.75p.
POSSAS, J. M. C. Zoneamento agroclimático para a cultura do pinhão-manso (Jathopra Curcas L.) no estado de Pernambuco. 2011. 76 p. Dissertação (Mestrado em Engenharia Agrícola). Departamento de Tecnologia Rural, Universidade Federal Rural de Pernambuco. 2011.
ROBERTSON, G.P. GS+: geostatistics for the environmental sciences (version 5.1 for windows). Plainwell: Michigan, Gamma Design Software, 1998. 152 p.
SÁ, I. B.; SÁ, I. I. S.; SILVA, A. S. Desertificação na região de Cabrobó-PE: a realidade vista do espaço. In: SIMPÓSIO REGIONAL DE GEOPROCESSAMENTO E SENSORIAMENTO REMOTO, 3, 2006, Aracajú. Anais...Aracajú, 2006.
SILVA, F.B.R. E.; SANTOS, J. C. P; SILVA, A. B. Zoneamento agroecológico do Estado de Pernambuco. Recife: Embrapa Solos – Unidade de Execução de Pesquisa e Desenvolvimento – UEP Recife; 2001. CD-Rom. (Embrapa Solos. Doc. 35). SIRTOLI, A. E.; SILVEIRA, C. T.; SILVA, C. R.; MONTOVANI, L. E.; RIBEIRO, S. R. A.; OKA-FIORI, C. Atributos topográficos secundários no mapeamento de pedoformas. Geociências, São Paulo, v. 27, n.1, p. 63-77, 2008.
SOUZA, R. V. C. C.; RIBEIRO, M. R.; SOUZA JUNIOR, V. S.; CORRÊA, M. M.; ALMEIDA, M. C.; CAMPOS, M. C. C.; RIBEIRO FILHO, M. R.; SHULZE, S. M. B. B. Caracterização de solos em uma topoclimosequência no maciço de Triunfo – sertão de Pernambuco. R. Bras. Ci. Solo, v. 34, p. 1259-1270, 2010.
SURFER. Contouring and 3D surface mapping for scientists and engineers. User’s Guide. Golden Software, Inc. U.S.A. 2002. 640 p.
VIEIRA, S.R. Geoestatística em estudos de variabilidade espacial do solo. In: NOVAIS, R.F.; ALVAREZ, V.H. and SCHAEFER, G.R., eds. Tópicos em ciência do solo. Viçosa, Sociedade Brasileira de Ciência do Solo, 2000, v. 1. p. 1-54.
VIEIRA, S.R.; XAVIER, M.A.; GREGO, C.R. Aplicações de geoestatística em pesquisa com cana-de-açúcar. In: MIRANDA-DINARDO, L.L.; VASCONCELOS, A.C.M. and LANDELL, M.G.A., eds. Cana-de-açúcar. Campinas, Instituto Agronômico, 2008. p. 839-852.