An application of reliability-based robustness assessment of steel moment
1resisting frame structures under post-mainshock cascading events
2Filipe L. A. Ribeiro1
André R. Barbosa2
and Luís C. Neves3
3
Abstract
4
The paper presented herein proposes a reliability-based framework for quantifying the struc-5
tural robustness considering the occurrence of a major earthquake (mainshock) and subsequent 6
cascading hazard events, such as aftershocks that are triggered by the mainshock. These events 7
can significantly increase the probability of failure of buildings, especially for structures that are 8
damaged during the mainshock. 9
The application of the proposed framework is exemplified through three numerical case studies. 10
The case studies correspond to three SAC steel moment frame buildings of 3-, 9-, and 20- stories, 11
which were designed to pre-Northridge codes and standards. Two-dimensional nonlinear finite 12
element models of the buildings are developed using the Open System for Earthquake Engineering 13
Simulation framework (OpenSees), using a finite-length plastic hinge beam model and a bilinear 14
constitutive law with deterioration, and are subjected to multiple mainshock-aftershock seismic 15
sequences. 16
For the three buildings analyzed herein, it is shown that the structural reliability under a single 17
seismic event can be significantly different from that under a sequence of seismic events. The 18
1Ph.D. Student, UNIC, Department of Civil Engineering, Faculdade de Ciências e Tecnologia - Universidade Nova
de Lisboa, Quinta da Torre, 2829-516 Caparica, Portugal, and Visiting Ph.D. Student, School of Civil and Construction Engineering, Oregon State University, Corvallis, USA, E-mail: [email protected]
2Assistant Professor, School of Civil and Construction Engineering, Oregon State University, 220 Owen Hall,
Corvallis, OR 97331-3212, USA, E-mail: [email protected]
3Lecturer, Nottingham Transportation Engineering Centre, Faculty of Engineering, University of Nottingham,
reliability-based robustness indicator used shows that the structural robustness is influenced by the 19
extent by which a structure can distribute damage. 20
Keywords: Aftershock, Nonlinear Dynamic Analysis, Robustness, Seismic Sequences. 21
INTRODUCTION
22
Structures in earthquake prone regions are susceptible to being damaged due to intense ground 23
motion shaking. Traditionally, design and analysis of building structures only considers one single 24
earthquake event, also known as a mainshock. However, in reality, structures can be subjected 25
to cascading events, defined as events likely to be triggered by a major earthquake, such as after-26
shocks, fires, explosions, or tsunamis. The focus of this work is placed on sequences of ground 27
motions that include the mainshock as well as aftershocks. Structural damage is typically observed 28
in the large intensity mainshocks. Since the typical time interval between mainshocks and after-29
shocks is small, structural repair or retrofit is not possible and the mainshock-damaged structures 30
are thus more susceptible to failure when an aftershock occurs. The term failure, as used herein, is 31
synonymous with exceeding a defined limit state that may render structures unfit for use (Newmark 32
and Rosenbleuth 1971). 33
In this paper, a measure of structural robustness is used to characterize the effect of aftershocks 34
on the seismic safety of structures. With respect to aftershocks triggered by mainshocks, a struc-35
ture is said to be more or less robust depending on its capacity to sustain post-mainshock damage 36
without reaching failure. Three main approaches for quantifying structural robustness have been 37
proposed in the literature. In the first approach, measures of structural robustness are derived 38
from probabilistic risk assessments (Baker et al. 2008). Baker et al. (2008) defined a measure 39
for quantifying structural robustness as a function of direct and indirect risk. Even though this 40
approach is very powerful, the complexity and subjectiveness in the quantification of the direct 41
and indirect risk in large structural systems hinders the application of this approach. In the second 42
approach, measures of structural robustness are quantified in terms of ratios of structural properties 43
(e.g. damage, energy, or stiffness) between undamaged and damaged structures (Starossek 2006; 44
describe failures. Finally, in the last approach, measures of structural robustness are defined as 46
a function of the probabilities of failure of the intact and damaged structure. Examples of such 47
measures are the indices presented by Frangopol and Curley (1987) and Lind (1995). It is worth 48
noting that, as discussed in Starossek and Haberland (2008), both these measures evaluate struc-49
tural redundancy rather than robustness. However, for buildings, redundancy is provided by the 50
existence of alternative load paths which is the main mechanism providing robustness, rendering 51
these indicators an adequate indirect measure of structural robustness. Robustness assessment of 52
structures for cascading hazards is currently lacking in the literature. 53
There are two main challenges in modeling the effects of aftershock events on structures for 54
computing structural robustness. The first challenge is related to the accurate modeling of ex-55
pected mainshock-aftershock seismic sequences. This has been discussed extensively in (Ruiz-56
García 2012; Fragiacomo et al. 2004; Lee and Foutch 2004; Li and Ellingwood 2007; Luco et al. 57
2004; Luco et al. 2011; Ryu et al. 2011). Luco et al. (2011) and Ryu et al. (2011) performed 58
mainshock-aftershock incremental dynamic analyses (IDA, Vamvatsikos and Cornell 2002) on 59
single-degree-of-freedom models subjected to artificial sequences of mainshock-aftershock "back-60
to-back" structural analyses. The second challenge is related to accurate modeling of the effects 61
of damage introduced by the mainshock on structural performance. To this effect, state-of-the-art 62
modeling for estimation of structural performance/damage can be found in ATC-72 (PEER/ATC 63
2010). In the ATC-72 report emphasis is placed on phenomenological models that capture the 64
main effects of strength and stiffness deterioration. 65
In this study, a probabilistic framework for the assessment of structural robustness under main-66
shock triggered aftershocks is developed. Emphasis is placed on the evaluation of the structural ro-67
bustness as a function of the probability of failure (or the reliability index) under different damage 68
scenarios. In the probabilistic methodology, nonlinear dynamic time-history analyses of structural 69
computational models of buildings are used to estimate the recorded structural damage due to mul-70
tiple mainshock-aftershock sequences. Mainshock and aftershock incremental dynamic analyses 71
aftershock sequences are used in the "back-to-back" nonlinear dynamic time-history analyses. This 73
approach is applied to multi-degree-of-freedom (MDOF) structural models of the 3-, 9-, and 20-74
story steel moment resisting frames (SMRFs) of the SAC steel project (FEMA355C 2000). The 75
analytical building models are developed using the Open System for Earthquake Engineering Sim-76
ulation, OpenSees (Mazzoni et al. 2009), and were validated using the numerical data available 77
in the literature (FEMA355C 2000; Luco 2002). Important aspects of beam strength and stiffness 78
degradation as damage progresses during the analysis were also included in the model. To quan-79
tify the damage due the mainshock and aftershock, the buildings are first subjected to a mainshock 80
incremental dynamic analysis and for each level of the intensity of the mainshock, the mainshock-81
damaged structure is then subjected to incremental dynamic analysis due to the aftershocks. 82
FRAMEWORK
83
The framework proposed for the assessment of the structural robustness of buildings is sche-84
matically presented in Figure 1. The first step of the analysis corresponds to the definition of 85
the engineering measures considered to define failure and the thresholds used to define the per-86
formance or limit states. The following step of the analysis corresponds to the definition of the 87
mainshock hazard. This depends on the location of the building and the foundation soil. Extensive 88
data exists on the seismic hazard of locations in Europe, North America, and Japan (e.g., Petersen 89
et al. 2008). From this, the mean annual rate of exceeding a ground motion intensity measure 90
can be defined and, consequently, a probabilistic distribution of the mainshock intensity measure 91
can be obtained. The ground motion intensity measure most used is the 5% damped linear elastic 92
spectral acceleration at a fundamental period of the structureT1, which is denoted asSa(T1)(e.g. 93
Baker 2007). Herein, the notationSwill be used to refer to a spectral acceleration at a fundamental 94
period of the structure. 95
Based on the definition of the hazard, a set of mainshock ground accelerograms can be defined 96
(Step 3.1), considering either real or artificial accelerograms (e.g. Bommer and Acevedo 2004). 97
Considering the uncertainty in the characteristics of the mainshock, several different accelero-98
are discussed in Baker (2007), for example. When probabilistic simulation is employed, a set 100
of mainshocks following the distribution of the spectral acceleration are used. In Step 3.2, finite 101
element models are defined, leading at sufficient accuracy to characterize the nonlinear response 102
to collapse, providing reliable estimates of the residual displacements and loss in stiffness and 103
strength. Details on an example of models that can be employed to account for the strength and 104
stiffness deterioration are described in the following section. In Step 3.3, the damage caused by 105
the mainshock is evaluated for each of these samples. In the present paper, this is done using an 106
incremental dynamic analysis (Vamvatsikos and Cornell 2002), but other methods for estimating 107
the damage conditional on the mainshock ground motion intensity measure can be defined. Based 108
on the results of these analyses, in Step 3.4, the probability of failure under mainshock alone (pf1)
109
can be estimated using: 110
pf1 = ∫
Sm
P(F|Sm =sm)dP(Sm) (1) 111
where Sm represent the ground motion spectral accelerations associated with the mainshock at
112
the fundamental period of the intact structure, P(Sm) corresponds to the annual probability of
113
occurrence of a spectral acceleration associated with the mainshock, and P(F|Sm = sm)
repre-114
sents the probability of failure F conditional on Sm. The probabilities of exceedance of a given
115
Sm are defined considering, for example, the data described in Petersen et al. (2008). According
116
to Jayaram and Baker (2008) the spectral accelerations follow lognormal distributions. The term 117
F describes a failure event, which is defined as exceedance of a limit state. When considering a 118
collapse limit state, for example, FEMA356 (2000) reports 5% as a limiting value interstory drift 119
ratio in buildings. It is worth noting that Eq.1 is applicable for any limit state. 120
Based on the properties of the mainshock, the conditional aftershock hazard can be defined 121
in Step 4. The occurrence rate and the distribution of aftershocks have strong correlations with 122
mainshock magnitude (Yeo and Cornell 2005). As a consequence, an aftershock hazard should 123
be defined considering the mainshock amplitude, frequency content, and duration. Therefore, the 124
most sites such information in not available, and a general formulation cannot rely on existence of 126
this data. Thus, artificial mainshock-aftershock sequences are used herein, following Luco et al. 127
(2011), Ryu et al. (2011), and Li et al. (2012). In Step 5.1 a set of aftershock ground accelerations 128
is defined. In Step 5.2, damage resulting from mainshock and aftershock is evaluated, following 129
the tasks described above for the mainshock alone. The probability of failure due the aftershock 130
conditional on the occurrence of a mainshock that does not lead to failure, pf2, can be computed
131
through: 132
pf2 =
pf3 −pf1
1−pf1
(2) 133
where the probability of failure considering both mainshock and aftershock, computed in Step 5.3, 134
is given by: 135
pf3 = ∫
Sm
∫
Sa
P(F|Sm =sm, Sa =sa)dP(Sa|Sm =sm)dP(Sm) (3)
136
and where Sa represent the ground motion spectral accelerations associated with the aftershock
137
at the fundamental period of the intact structure, P(Sa|Sm = sm)is the conditional probability
138
of occurrence of an aftershock with spectral accelerationSafollowing a mainshock with spectral
139
accelerationSm, andP(F|Sm = sm, Sa =sa)represents the probability of failureF conditional
140
onSm andSa. Sais also assumed to follow a lognormal distribution.
141
In Step 6, the robustness assessment is performed based on the comparison of the reliability 142
index(β =−Φ−1(p
f))of the undamaged structureβintact, which accounts for the mainshock only,
143
with the reliability index of the mainshock-damaged structureβdamaged as (Frangopol and Curley
144
1987): 145
βR=
βintact
βintact −βdamaged
(4) 146
whereβintact =−Φ−
1
(pf1)andβdamaged =−Φ− 1
(pf2). 147
Herein, the reliability index for the mainshockβintact is computed considering the spectral
celeration event space divided in 10 intervals for ten equally likely ground motion records each 149
denoted as earthquakeEj using a technique known as Stratified Sampling (Kiureghian 1996). The
150
reliability index for the aftershock βdamaged is computed using stratified sampling for the
main-151
shock spectral acceleration and considering the conditional probability of failure due to aftershock 152
as the probability of exceedance of the minimum aftershock spectral acceleration leading to fail-153
ure. The probability of failure is computed considering the combination of 10 mainshock and 10 154
aftershock ground motion records. In this computation it is assumed herein that the mainshock and 155
the aftershock ground motion spectral acceleration are uncorrelated. 156
BUILDING MODELS
157
General Description
158
The steel moment resisting frame (SMRF) buildings studied in this work are a subset of the 159
models developed as part of the SAC Steel project (FEMA355C 2000). The buildings included 160
in this study are a 3-, a 9-, and a 20-story buildings (denoted LA3, LA9 and LA20, respectively) 161
which were designed for Los Angeles using pre-Northridge codes (UBC 1994). In all buildings, 162
external frames were designed to resist the lateral seismic loads and interior frames were designed 163
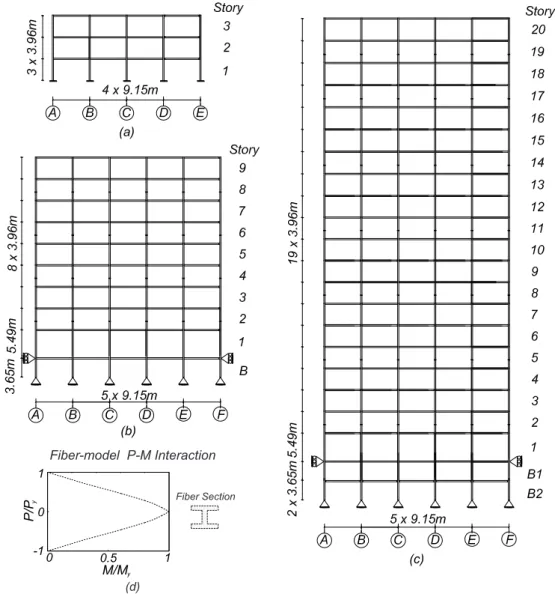
as gravity frames. As shown in Figure 2, all buildings have spans of 9.15m in both directions. 164
The 3-story building presents no basement, while the 9- and 20-story buildings have one and two 165
basement levels, respectively. The height of the frames is constant and equal to 3.96m, except for 166
the first level of the two taller buildings, which have a height of 5.49m, as shown in Figure 2. A 167
detailed description of the buildings can be found in FEMA 355C (2000) and Luco (2002). 168
Two-dimensional centerline models of an external frame of each of the three buildings are used 169
for the structural analysis. According to one of the modeling alternatives presented in Luco and 170
Cornell (2000), strong-column weak-beam ductile behavior was assumed for all structures. Brittle 171
mechanisms and connection fracture modes were not considered. 172
Geometric nonlinearities are accounted for during the analysis by considering aP −∆leaning 173
column. A rigid diaphragm is assumed for each floor. Soil-structure interaction was not considered. 174
(2000), Rayleigh damping is assigned to the models. As described in Erduran (2012), a damping 176
ratio of 2% was assigned to the first mode and a higher mode. Following FEMA355C (2000) the 177
higher mode considered is the fifth mode for LA20 and a mode with period 0.2s for buildings LA3 178
and LA9 (a period close to the LA3’s 3rdmodal period and the LA9’s 5thmodal period).
179
Component Modeling
180
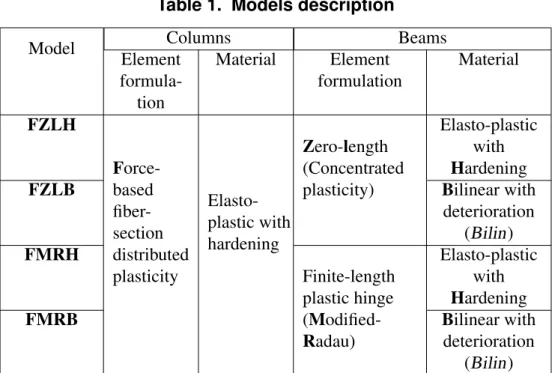
The building’s nonlinear behavior was modeled considering a set of four different models for 181
each structure, as described in Table 1. The four models considered differ in the method used to 182
simulate the beams. For the first two models, a zero-length plastic hinge element is used, consid-183
ering elasto-plastic behavior with hardening and a bilinear model with deterioration (Bilin model 184
in OpenSees). The third and fourth models used the same material models, but consider a finite-185
length plastic hinge element. In all four cases, the columns were modeled considering a distributed 186
plasticity model and an elasto-plastic constitutive law with a 3% hardening rate assigned to each 187
fiber. A moment-curvature section analysis showed that this corresponds to a section hardening of 188
3.0%, consistent with the assumptions used in the FEMA355C modeling. Thus, for the columns, 189
the main phenomenon considered is the interaction between moment and axial load. This as-190
sumption is supported by recent testing (Newell and Uang 2008), where it is shown that columns 191
such as the ones being modeled do not exhibit deterioration in strength by more than 10% for 192
P/P y ≤ 0.75even at 8% story drift ratios. For the building under analysis, which was designed 193
using the strong-column-weak-beam assumption, only minor deterioration in stiffness and strength 194
of columns is expected, and disregarding these effects will have no significant impact on the re-195
sults. However, for buildings consisting of slender columns, this assumption may not hold and the 196
effect of deterioration of the strength and stiffness of the columns should be evaluated. 197
Zero-Length vs. Finite-Length Plastic Hinge Elements
198
Model idealizations for nonlinear structural analysis of beams range from phenomenologi-199
cal models, such as concentrated plasticity models and finite-element distributed plasticity beam-200
column elements, to complex continuum models based on plane-stress or solid finite-elements. In 201
at both ends of a linear-elastic beam-column element. These elements have been recently pro-203
posed as the main method for estimating seismic demands (Ibarra and Krawinkler 2005; Medina 204
and Krawinkler 2005; Haselton and Deierlein 2007) and are the preferred modeling approach in the 205
Applied Technology Council ATC-72 modeling guidelines proposed recently (PEER/ATC 2010). 206
Considering that zero-length models have been widely used to model the seismic performance of 207
buildings, in this work they are used as a reference, and the results obtained using the finite length 208
plastic hinge elements are compared with those to ascertain their accuracy. 209
Scott and Fenves (2006) proposed a novel approach for modeling nonlinear behavior of frame 210
structures based on a force-based finite-length plastic hinge beam-column elements (beam with
211
hinges) which overcomes issues related to localization phenomena observed in distributed plastic-212
ity beam-column elements (Coleman and Spacone 2001). Furthermore, finite-length plastic hinge 213
elements can model plastic hinge length explicitly and separate the behavior of beam in the span 214
from that of beam-column connections. Compared to zero-length springs, finite-length plastic 215
hinge elements allow faster model development due to the reduction in the number of nodes and 216
elements. 217
Elasto-plastic Model with Kinematic Hardening vs. Bilinear Model With Deterioration
218
Steel structures are traditionally modeled considering an elasto-plastic behavior with kinematic 219
hardening, accounting for Bauschinger effect. However, during an earthquake, structural elements 220
are subjected to large inelastic cyclic deformations which lead to deterioration of both strength 221
and stiffness properties of components, affecting the overall structural performance under seismic 222
loading. 223
In the present work, a modified version of the Ibarra-Krawinkler (2005) phenomenological 224
model, applicable to any force-deformation relationship, is employed to simulate beam behavior 225
and compared to an bilinear model with kinematic hardening. This model was used by Lignos and 226
Krawinkler (2011) to model the moment-rotation relationship of plastic hinges in steel elements. 227
The model considers strength and stiffness deterioration, defined in terms of element geometry, 228
The model by Lignos and Krawinkler (2011) defines a moment-rotation relationship and, con-230
sequently, can not be directly applied when a finite length plastic hinge is considered, which re-231
quires the use of a moment-curvature relationship. Based on the moment-rotation model described 232
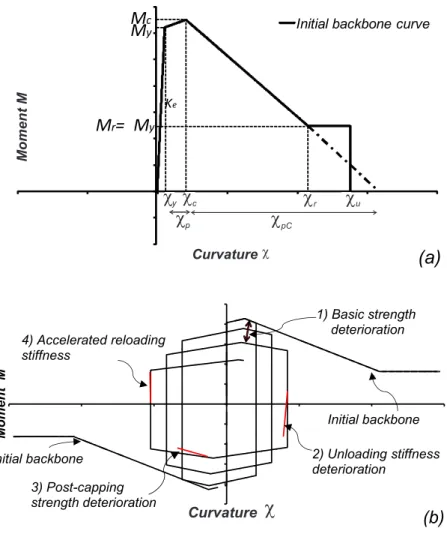
above, it is possible to define the moment-curvatureM−χmodel by scaling the moment-rotation 233
backbone curve, as well as, the loading and unloading rules, in terms of the length of the plas-234
tic hinge, Lp, resulting in the model presented in Figure 3. This plastic hinge moment-rotation
235
model is based on the assumption of a double curvature deformation, which leads to an elastic 236
stiffness of6EI/L. When a finite length plastic hinge element is used, a plastic hinge length of 237
Lp = L/6should be used to recover the exact solution for the case of a fixed-fixed beam column
238
element (Scott and Ryan 2013). All other model parameters are defined as proposed in (Lignos 239
and Krawinkler 2011; Lignos and Krawinkler 2012). Axial and shear behavior is assumed to be 240
linear elastic. Joint shear deformations (e.g. Gupta and Krawinkler 1999) and fracture due to low 241
cycle fatigue (Lignos et al. 2011) are not included in this work. 242
For the building examples analyzed, the axial load expected to develop in beams is very low and 243
the interaction between axial load and bending moment in beams is significantly less relevant than 244
the deterioration of stiffness and strength which is expected to occur in the beams. For this reason, 245
the interaction between axial load and bending moment is disregarded for the beams. The modeling 246
assumptions made in this work are intended to provide a relatively simple structural model and, 247
at the same time, accurately simulate the deterioration of the steel members to collapse. Thus, 248
the modeling of some building components was neglected in these models, such as beam-column 249
joints, column base plate connections, and partially restrained connections. The influence of these 250
components in the robustness of steel structures to cascading events is worth studying in future 251
works. 252
Model validation
253
The four models described were compared to those developed by Luco and Cornell (2000), 254
also designated as Model M1 (FEMA355C 2000), for the same buildings. The models in Luco 255
models implemented herein were developed in OpenSees. The elements used in theDRAIN-2DX
257
models correspond to concentrated plastic hinge models and a linear P-M interaction surface was 258
assumed for compressive axial loads greater than0.15Py. While the model in FEMA355C (2000)
259
considered this simplified bilinear P-M interaction surface, the P-M interaction surface considered 260
herein is obtained implicitly during the analysis since the columns are modeled using fiber-section 261
nonlinear beam-column elements. A representation of the P-M interaction curve (at the section 262
level) is presented in Figure 2(d). 263
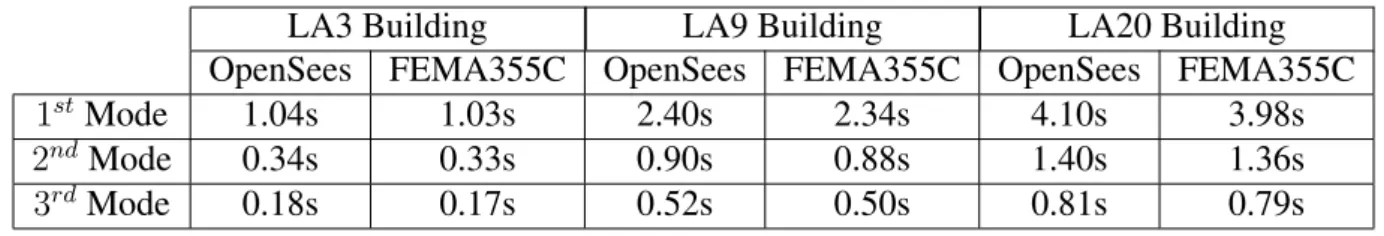
The model validation performed herein includes the comparison of results for both a nonlinear 264
static pushover and nonlinear dynamic time-history analysis. Furthermore, the buildings periods 265
available in the literature also correlate well with the ones obtained in the FE models developed in 266
this work, as shown in Table 2. 267
Nonlinear Static Analysis
268
The nonlinear static analyses were carried out considering the four models described in Table 1 269
and compared to those presented in FEMA355C (2000) and Luco (2002). The lateral load pattern 270
applied is proportional to the first mode of vibration of each structure. 271
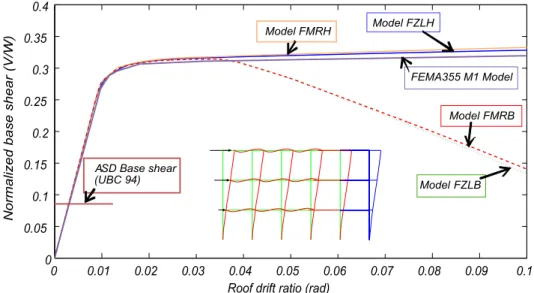
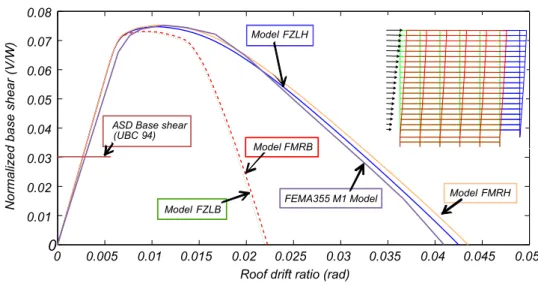
Figures 4, 5, and 6 show the pushover curves for each of the three buildings and the four 272
finite element models used. For reference, these figures also show the design base shear quantified 273
according to the allowable stress design method (ASD) of the 1994 Uniform Building Code (UBC 274
1994). It can be seen from these figures that the overall match of the pushover curve are quite 275
good for the models with hardening . In the elastic range the differences for all models to the 276
results presented in FEMA355C (2000) are small, increasing slightly with the increase in building 277
height. In spite of the differences for the 20-story building being discernible in the elastic range, 278
as shown in FEMA355C (2000), such variations are expectable as a consequence, for example, of 279
alternative joints models. For all buildings, the models considering an elasto-plastic with hardening 280
constitutive law (FMRH, FZLH, and FEMA355) presented a similar behavior, showing that the use 281
of beam with hinges models does not affect significantly the results obtained. For the two taller 282
bilinear model with deterioration is considered (FMRB and FZLB) the post peak force decreases 284
faster, as a result of the strength deterioration considered for the beams. As a consequence of the 285
strong-column weak-beam design, plastic hinges form firstly in the beams. The use of the bilinear 286
model with deterioration (FMRB and FZLB) leads to a faster decrease in the post peak base-shear 287
force, as a result of softening in the beams and corresponding change in column moment gradient, 288
once the plastic hinges form. 289
In summary, the results of the pushover analysis show that the models using an elastic-plastic 290
constitutive law lead to results similar to those described in FEMA355C (2000). Secondly, the use 291
of zero-length and beam with hinges does not affect the results significantly, allowing the use of 292
the finite-length plastic hinges model in subsequent analysis. Finally, the use of the bilinear model 293
with deterioration for the beams produced larger strength reduction. 294
Nonlinear Dynamic Time-History Analysis
295
To compare the results described in Luco and Cornell (2000) with those resulting from the mod-296
els used in this work, the structural response is evaluated considering forty (twenty two-component 297
records) SAC Steel Project LA01-LA40 earthquake records. Forty nonlinear dynamic time-history 298
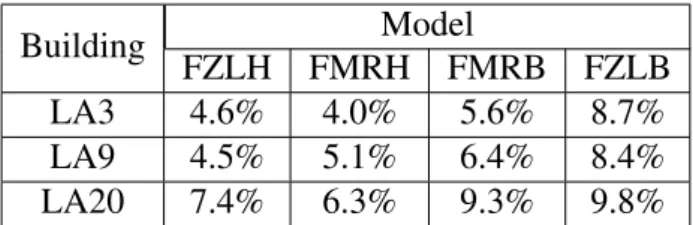
response analyses were performed for each model and each of the three buildings. Obtained results 299
were compared to those presented by Luco and Cornell (2000) in terms of maximum interstory drift 300
ratio. The mean relative errors obtained for each model and building are presented in Table 3. For 301
the models considering an elastic-plastic behavior (FZLH and FMRH) the results are relatively 302
close, with a maximum mean error of 7.4%. Correlation between the floor levels where this inter-303
story drift ratios is observed for the models developed by Luco and Cornell (2000) and the ones 304
shown in this paper was also quite good (Ribeiro et al. 2013). 305
The model validation performed is considered to be sufficient for the FZLH and FMRH models. 306
Even though no direct validation of the FZLB and FMRB models with experimental results is 307
possible, the definition of component degradation is consistent with experimental results and P-M 308
interaction is considered explicitly. Considering the advantages of the finite length model described 309
is used in the subsequent analyses. 311
ANALYSIS DESCRIPTION
312
To evaluate the increased probability of failure associated with the occurrence of an aftershock 313
following a major earthquake, a simulation procedure was employed that considered as random 314
variables the spectral accelerations of the mainshock and the aftershock corresponding to the initial 315
fundamental period of the structure. Although the occurrence rate and distribution of aftershocks 316
are correlated to mainshocks magnitude (Yeo and Cornell 2005), their amplitude, frequency con-317
tent, and duration are very difficult to simulate. Thus, artificial mainshock-aftershock sequences 318
are used herein, following Luco et al. (2011), Ryu et al. (2011), and Li et al. (2012). 319
Numerical and Computational Methods
320
The mainshock and aftershock are modeled considering a set of 10 accelerograms, each scaled 321
independently, representing different shaking intensities. For performing the incremental dynamic 322
analysis (IDA), each of the 10 mainshocks considered is scaled 10 times, by multiplying the corre-323
spondent time-history record by the objective spectral acceleration,Sm(T
1), divided by the original 324
ground motion spectral acceleration,SGM(T
1), corresponding to a stratified sampling of the spec-325
tral accelerations. Each of the mainshocks can be followed by one of the 10 aftershocks. For 326
each aftershock an IDA is also performed for at least 20 intensity levels. Thus, in this analysis 327
the aftershock ground motion is incrementally scaled (by multiplying the time-history record by 328
Sa(T
1)/SGM(T1)), similarly to the procedure of a regular IDA, performing a number ofn back-329
to-back analysis, wheren depends on the aftershock ground motion, the building being analyzed, 330
and the damage state at the end of the mainshock. Each aftershock incremental dynamic analysis 331
(AIDA) is computed considering the polarity of the aftershock (positive and negative directions). 332
A 30s time interval of free-vibration was considered between the end of the mainshock and the 333
application of the aftershock ground motion records. This duration was deemed sufficient after a 334
preliminary study that showed that the maximum nodal velocity observed during the last second 335
of this 30s interval was, for all buildings, smaller than 0.6% of the peak velocity observed for the 336
For each run, the Newton-Raphson method is used for solving the nonlinear system of equa-338
tions at each time step. To analyze the structure up to interstory drift ratios of 10%, a convergence 339
study of the horizontal roof peak displacement and horizontal peak floor absolute acceleration as 340
a function of the integration time step was performed. Time-steps considered were 0.01s, 0.005s, 341
0.002s, 0.001s, 0.0005s, 0.0001s, and 0.00005s. It was observed that a time step of 0.002s was 342
sufficiently small to produce negligible errors (when compared to the 0.00005s) and no significant 343
changes in the response were observed when smaller time steps were used. 344
To reduce the total computational time required for obtaining all the results for these large num-345
ber of runs, an embarrassingly parallel computing framework was implemented. The implemented 346
framework makes use of the OpenSees (v2.4.0, release 5172) sequential version and a batch-queue 347
system called HTCondor (v7.8.0) (Thain et al. 2005). HTCondor is a specialized batch system for 348
managing computational-intensive jobs. To make the most use of two student computer centers of 349
Civil Engineering Departments at both Oregon State University (OSU) and Universidade Nova de 350
Lisboa (UNL), two HTCondor pools were created, consisting of 464-cores at OSU and 96-cores 351
at UNL. Since the research team was geographically dispersed, to minimize time needed for sim-352
ulation data transfer and post-processing of the numerical results, a OSU-UNL web shared folder 353
was created using a commercial application. 354
Ground Motion Records
355
The ground motion records used in this study were selected from the set of forty SAC Steel 356
Project LA01-LA40 earthquake records mentioned above, considering earthquakes with the high-357
est peak ground acceleration. These records were obtained from real and simulated ground mo-358
tions, scaled so that their mean response spectrum matches the 1997 NEHRP design spectrum, 359
as reported by Somerville et al. (1997). The time histories for Los Angeles are all derived from 360
recordings of shallow crustal earthquakes on soil category D. The ten SAC records selected for 361
this study are characterized by a moment magnitudeMW between 6.0 and 7.4, duration between
362
29.9sand59.9s, and peak ground acceleration between0.6g and1.3g. The ten E1 to E10 ground 363
LA30, LA31, LA36 and LA37. 365
In order to quantify the probability of failure of the structures, the spectral accelerations at Los 366
Angeles are estimated from the hazard curves generated for the 2008 National Seismic Hazard 367
Mapping Project (NSHMP) (Petersen et al. 2008) for soil type D. These are approximated by a 368
log-normal distribution, under the mild assumption that the findings of Jayaram and Baker (2008) 369
also hold for the modified ground motion records. 370
DETERMINISTIC NONLINEAR DYNAMIC TIME-HISTORY RESPONSE ANALYSIS
371
This section presents results obtained for representative nonlinear dynamic time-history re-372
sponse analyses, selected from those described above. The performance of the LA3 building is 373
assessed considering a mainshock ground motion spectral acceleration of 1.2g and 0.9g for the 374
aftershock spectral acceleration. Earthquake ground motions E1 and E4 are used as the mainshock 375
and aftershock, respectively. 376
Figure 7 shows the time-history response of the LA3 building in terms of floor acceleration, 377
roof drift ratio, and interstory drift ratio during four identified timeperiods (TP1TP4): (i) TP1 -378
duration of the mainshock; (ii) TP2 free vibration period of 30s after the mainshock; (iii) TP3 -379
duration of the aftershock; and (iv) TP4 - free vibration period of 30s after the aftershock. This 380
figure also shows the floor accelerations and the interstory drift ratios at the instants when peak 381
interstory drift ratio is attained during the mainshock and the aftershock, respectively. The peak 382
interstory drift ratio during the mainshock is 4.1% at the3rdstory. In Figure 8 two moment-rotation
383
responses are shown at two different elements. It is important to note that during the aftershock the 384
deformations are much larger, especially for beams, whose response go beyond the peak strength, 385
i.e. a softening response is observable. 386
The deformed shape of the LA3 building at the peak deformation instant is shown in Figure 9. 387
This figure also shows the deformed shapes of the LA9 and LA20 buildings, in which, for repre-388
sentative analyses, the size of the circles illustrate the relative scales of rotations recorded at the 389
end of each element. For the LA3 building, almost all beam ends had gone into the inelastic regime 390
erable, as it can be inferred through the number of plastic hinges formed during the mainshock, the 392
residual deformation is not significant (see Figure 7). At the instant when the peak interstory drift 393
ratio is recorded during the aftershock, columns on the first story have formed plastic hinges in 394
both ends, which indicates that an undesirable soft story mechanism is formed. Four plastic hinges 395
have also formed in second story columns and two in the third one. Effects of higher modes in the 396
instants where peak interstory drifts are recorded can be observed in the LA9 and LA20 building 397
response especially during the aftershock (see Figure 9). 398
AFTERSHOCK INCREMENTAL DYNAMIC ANALYSIS
399
For each mainshock-aftershock combination and each mainshock intensity, an aftershock in-400
cremental dynamic analysis (AIDA), for increasing aftershock intensities, is performed in order 401
to compute the failure probability under this sequence of events. In Figure 10, AIDA curves are 402
shown for four mainshock ground motion spectral accelerations. For sake of brevity only results 403
from the LA3 building are shown herein. Earthquake E5 is considered as mainshock. Ten AIDA 404
curves are then computed for the ten possible aftershocks. For each mainshock intensity, the results 405
obtained show the variation of the peak interstory drift ratio,θmax, as a function of the aftershock
406
ground motion spectral acceleration. 407
The value of 10% of interstory drift ratio is considered to be the threshold for failure (Baker 408
2007). Higher values of interstory drift ratio will lead to violation of the performance threshold and 409
thus be considered as failure. Previous probability-based studies (e.g., Baker 2007) have concluded 410
that 10% IDR is an adequate threshold to define collapse in a numerical framework. Although 411
FEMA356 (2000) defines 5% IDR for collapse prevention, to study the structural robustness (i.e., 412
the capacity of the structure to sustain damage) this larger value allows for the assessment of 413
the nonlinear structural behavior under very large deformations, which contributes to the accurate 414
evaluation of the reliability-based structural robustness by allowing for more accurate computation 415
of the probability of failure. 416
Figure 10 shows the AIDA curves illustrating the decrease in capacity with the increase in 417
leads the structure to failure is 1.7g when the mainshock ground motion spectral acceleration is 419
1.2g, whereas when the mainshock ground motion spectral acceleration is 2.4g the aftershock 420
spectral acceleration that leads to failure is1.1g. 421
ROBUSTNESS ASSESSMENT RESULTS
422
Figure 11 shows the lowest aftershock spectral acceleration that leads the LA3 building to 423
fail (θmax = 10%) versus the mainshock spectral acceleration. The figure corresponds to results
424
obtained using earthquake E5 for both the mainshock and the aftershock. It can be seen that for 425
lower intensities of the mainshock there is little impact of mainshock on the aftershock spectral 426
acceleration that leads to failure. Additionally, for increasing mainshock intensities, the aftershock 427
spectral accelerations that lead to failure are reduced, since the mainshock induced damage reduces 428
the capacity of the structure to sustain additional damage due to the aftershocks. Since the same 429
accelerograms are used for generating both mainshock and aftershock, application of a mainshock 430
only or an aftershock following a low intensity mainshock (i.e., causing no damage to the structure) 431
are equivalent. Consequently, the lowest mainshock spectral acceleration leading to failure is 432
identical to the (minimum) aftershock spectral acceleration which leads to failure for very low 433
mainshock intensities. 434
In Figure 12 the median aftershock ground motion spectral acceleration that leads the structures 435
to failure is represented as a function of the median mainshock ground motion spectral accelera-436
tion. A similar trend to that described for Figure 11 is observable here, but now for the entire 437
set of AIDA analyses considered. Figure 12 also shows the median residual displacements after 438
application of the mainshock. The results show a significant correlation between the increase in 439
residual displacements and the reduction in the aftershock leading to failure, indicating that resid-440
ual displacements could be used as a measure of damage. 441
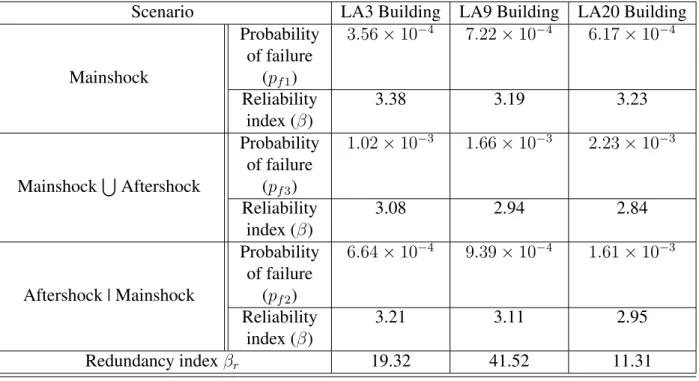
In Table 4, the probabilities of failure and the corresponding reliability indices are presented 442
considering mainshock, aftershock and mainshock+aftershock. The redundancy indicator, βr,
in-443
troduced by Frangopol and Curley (1987) is used to compare robustness of the three buildings. 444
showing that the design procedure applied is consistent. However, the probability of failure consid-446
ering aftershock and mainshock-induced damage increases much more significantly for buildings 447
LA3 and LA20, than for LA9. 448
The results obtained for the redundancy index,βr, show that LA9, although less safe than LA3
449
and LA20 under a mainshock alone, is significantly more robust. These results can be correlated 450
to the LA9 building ability to distribute damage over its entire height of the building as shown in 451
Figure 9. 452
CONCLUSIONS
453
In this paper, a reliability-based robustness assessment methodology for steel moment resist-454
ing frame structures subjected to post-mainshock seismic events was proposed and exemplified. 455
Robustness is computed through comparison of the structural reliability index under a mainshock, 456
considering the undamaged structure, and under an aftershock applied to the mainshock-damaged 457
structure. Probabilities of failure are computed through simulation, using nonlinear finite element 458
models that explicitly reproduce damage induced by strong shaking. The methodology is exempli-459
fied using back-to-back mainshock-aftershock nonlinear dynamic time-history analyses. 460
For structures expected to form strong-column weak-beam failure mechanisms, a finite element 461
modeling approach was presented in which columns were modeled using force-based fiber-section 462
distributed plasticity elements and beams were modeled using a recently proposed phenomeno-463
logical bilinear model with deterioration. The models used for the columns directly account for 464
axial load- bending moment interaction. For the beams, the deterioration behavior defined for the 465
plastic hinges is fundamental for accurate performance assessments under mainshock-aftershock 466
sequences. The finite-length plastic hinge element is used due to its ability to model plastic hinge 467
lengths explicitly and to separate the behavior of beam in the span from that of beam-column 468
connections. 469
Two-dimensional models of a 3-, 9-, and 20-story steel buildings, designed for the SAC project 470
for Los Angeles, California, were implemented in the OpenSees framework. For simulating the 471
records were combined. The spectral accelerations at fundamental periods of the buildings were 473
used to simulate mainshock and aftershock intensities that follow lognormal distributions. "Back-474
to-back" mainshock-aftershock incremental dynamic analyses are performed for each combination 475
of mainshock-aftershock, while failure is defined in terms of the exceedance of an interstory drift 476
threshold. It is worth noting that the results presented here are sensitive to the frequency content of 477
the ground motions (both aftershock and mainshock), period elongation due to cyclic deterioration 478
in stiffness from the mainshock, and the definition of the fundamental period of the frame struc-479
tures. These important factors are not considered herein, and as discussed in Faggella et al. (2013) 480
can only be adequately accounted for by using a vector-valued ground motion intensity measure. 481
The use of vector-valued ground motion intensity measures falls outside the scope of this paper. 482
Application of the reliability-based robustness assessment showed the importance of consid-483
ering the aftershock in the evaluation of safety of structures under seismic events, as a significant 484
increase in failure probability was observed when mainshock-aftershock sequences were consid-485
ered. Moreover, this study showed that the LA9 building, although initially more susceptible to 486
failure than the LA3 and LA20 buildings, presented significantly higher robustness for the af-487
tershock events (βr = 41.52 for LA9 versus βr = 19.32 and βr = 11.31 for LA3 and LA20,
488
respectively). In fact, robustness is defined in terms of the increase in probability of failure consid-489
ering damage, and LA9, although less safe than LA3 and LA20 under a mainshock alone, presents 490
a lower reduction in reliability index when cascading events are considered. Thus, it can also be 491
concluded that the probabilities of failure for multiple hazards requires explicit modeling of the 492
hazards and simulation methods need to accurately model the damage induced by the cascading 493
hazards. 494
ACKNOWLEDGEMENTS
495
In the development of this research work, the first and third author would like to acknowl-496
edge the support of the Portuguese Science and Technology Foundation through the fellowship 497
SFRH/BD/77722/2011 and UNIC Research Center at the New University of Lisbon. The support 498
thor is gratefully acknowledged. The first author would also like to acknowledge the support of 500
Oregon State University during the period in which he was a visiting Ph.D. student. The support 501
of the Nottingham Transportation Engineering Center to the third author is gratefully acknowl-502
edged. The opinions and conclusions presented in this paper are those of the authors and do not 503
necessarily reflect the views of the sponsoring organizations. 504
References
505
Baker, J., Schubert, M., and Faber, M. (2008). “On the assessment of robustness.”Structural Safety, 506
30(3), 253–267. 507
Baker, J. W. (2007). “Probabilistic structural response assessment using vector-valued intensity 508
measures.”Earthquake Engineering and Structural Dynamics, 36(13). 509
Bommer, J. J. and Acevedo, A. B. (2004). “The use of real earthquake accelerograms as input to 510
dynamic analysis.”Journal of Earthquake Engineering, 8(spec01), 43–91. 511
Cavaco, E., Casas, J., Neves, L., and Huespe, A. (2013). “Robustness of corroded reinforced con-512
crete structures: a structural performance approach.”Structure and Infrastructure Engineering, 513
9(1), 42–58. 514
Coleman, J. and Spacone, E. (2001). “Localization issues in force-based frame elements.”ASCE
515
Journal of Structural Engineering, 127(11), 1257–1265. 516
Erduran, E. (2012). “Evaluation of rayleigh damping and its influence on engineering demand 517
parameter estimates.”Earthquake Engineering & Structural Dynamics, 41(14), 1905–1919. 518
Faggella, M., Barbosa, A. R., Conte, J. P., Spacone, E., and Restrepo, J. I. (2013). “Probabilistic 519
seismic response analysis of a 3-d reinforced concrete building.”Structural Safety, 44, 11–27. 520
FEMA355C (2000). State of the Art Report on Systems Performance of Steel Moment Frames
521
Subjecte to Earthquake Ground Shaking. SAC Joint Venture for the Federal Emergency Man-522
agement Agency, Washington, DC. 523
FEMA356 (2000). “Prestandard and commentary for the seismic rehabilitation of buildings: 524
Fragiacomo, M., Amadio, C., and Macorini, L. (2004). “Seismic response of steel frames under 526
repeated earthquake.”Engineering Structures, 26(13), 2021–2035. 527
Frangopol, D. and Curley, J. (1987). “Effects of damage and redundancy on structural reliability.” 528
ASCE Journal of Structural Engineering, 113(7), 1533–1549. 529
Giberson, M. (1969). “Two nonlinear beams with definitions of ductility.”Journal of the Structural
530
Division, 95(2), 137–157. 531
Gupta, A. and Krawinkler, H. (1999). “Seismic demands for performance evaluation of steel mo-532
ment resisting frame structures.”Report No. 132, The John A. Blume Earthquake Engineering 533
Center. 534
Haselton, C. and Deierlein, G. (2007). “Assessomg seismic collapse safety of modern reinforced 535
concrete frame buildings.”Report No. 156, The John A. Blume Earthquake Engineering Center, 536
Stanford University. 537
Ibarra, L. F. and Krawinkler, H. (2005). “Global collapse of frame structures under seismic exci-538
tations.”Report No. 152, The John A. Blume Earthquake Engineering Research Center, Depart-539
ment of Civil Engineering, Stanford University, Stanford, CA. 540
Jayaram, N. and Baker, J. (2008). “Statistical tests of the joint distribution of spectral acceleration 541
values.”Bulletin of the Seismological Society of America 2008, 98(5), 2231–2243. 542
Kiureghian, A. D. (1996). “Structural reliability methods for seismic safety assessment: a review.” 543
Engineering Structures, 18(6), 412 – 424. 544
Lee, K. and Foutch, D. (2004). “Performance evaluation of damaged steel frame buildings sub-545
jected to seismic loads.”ASCE Journal of Structural Engineering, 130(4), 588–599. 546
Li, Q. and Ellingwood, B. R. (2007). “Performance evaluation and damage assessment of steel 547
frame buildings under main shock-aftershock earthquake sequences.”Earthquake Engineering
548
& Structural Dynamics, 36(3), 405–427. 549
Li, Y., Song, R., van de Lindt, J., Nazari, N., and Luco, N. (2012). “Assessment of wood and steel 550
structures subjected to earthquake mainshock-aftershock.”XV World Conference on Earthquake
551
Lignos, D. and Krawinkler, H. (2012). “Development and utilization of structural component 553
databases for performance-based earthquake engineering.” ASCE Journal of Structural
Engi-554
neering. 555
Lignos, D. G., Chung, Y., Nagae, T., and Nakashima, M. (2011). “Numerical and experimen-556
tal evaluation of seismic capacity of high-rise steel buildings subjected to long duration earth-557
quakes.”Comput. Struct., 89(11-12), 959–967. 558
Lignos, D. G. and Krawinkler, H. (2011). “Deterioration modeling of steel components in sup-559
port of collapse prediction of steel moment frames under earthquake loading.”ASCE Journal of
560
Structural Engineering, 137(11), 1291–1302. 561
Lind, N. C. (1995). “A measure of vulnerability and damage tolerance.” Reliability Engineering
562
and System Safety, 48(1), 1–6. 563
Luco, N. (2002). “Probabilistic seismic demand analysis, SMRF connection fractures, and near-564
source effects.” Ph.D. thesis, Department of Civil and Environmental Engineering, Stanford 565
University, Stanford, California. 566
Luco, N., Bazzurro, P., and Cornell, C. (2004). “Dynamic versus static computation of the residual 567
capacity of a mainshock-damaged building to withstand an aftershock.”13th World Conference
568
on Earthquake Engineering, Vancouver, Canada. 569
Luco, N. and Cornell, C. A. (2000). “Effects of connection fractures on smrf seismic drift de-570
mands.”ASCE Journal of Structural Engineering, 126(1), 127–136. 571
Luco, N., Gerstenberger, M. C., Uma, S., Ryu, H., Liel, A. B., and Raghunandan, M. (2011). 572
“A methodology for post-mainshock probabilistic assessment of building collapse risk.”Pacific
573
Conference on Earthquake Engineering, Auckland, New Zealand (April). 574
Mazzoni, S., McKenna, F., Scott, M. H., and Fenves, G. L. (2009).The OpenSees command
lan-575
guage manual, Version 2.0. Pacific Earthquake Eng. Research Center, Univ. California at Berke-576
ley. 577
Medina, R. and Krawinkler, H. (2005). “Evaluation of drift demands for the seismic performance 578
Newell, J. D. and Uang, C.-M. (2008). “Cyclic behavior of steel wide-flange columns subjected to 580
large drift.”Journal of structural engineering, 134(8), 1334–1342. 581
Newmark, N. and Rosenbleuth, E. (1971).Fundamental of Earthquake Engineering. Prentice-Hall. 582
PEER/ATC (2010). “Modeling and acceptance criteria for seismic design and analysis of tall build-583
ings.”Report No. 72-1, ATC - Applied Techonology Council. 584
Petersen, M., Frankel, A., Harmsen, S., Mueller, C., Haller, K., Wheeler, R., Wesson, R., Zeng, 585
Y., Boyd, O., Perkins, D., Luco, N., Field, E.H. Wills, C., and Rukstales, K. (2008). “Documen-586
tation for the 2008 update of the united states national seismic hazard maps.”Report no., U.S. 587
Geological Survey Open-File Report 2008-1128. 61 p. 588
Prakash, V., Powell, G., and Campbell, S. (1993). “Drain-2dx base program description and user 589
guide, version 1.0.” Report No. UCB/SEMM-93/17-18, Engineering Mechanics and Material, 590
Department of Civil Engineering, University of California, Berkeley, CA. 591
Ribeiro, F., Barbosa, A., and Neves, L. (2013).Numerical analysis of steel moment resisting frames
592
under seismic ground motions. 593
Ruiz-García, J. (2012). “Mainshock-aftershock ground motion features and their influence in build-594
ing’s seismic response.”Journal of Earthquake Engineering, 16(5), 719–737. 595
Ryu, H., Luco, N., Uma, S., and Liel, A. (2011). “Developing fragilities for mainshock-damaged 596
structures through incremental dynamic analysis.”Pacific Conference on Earthquake
Engineer-597
ing, Auckland, New Zealand (April). 598
Scott, M. and Ryan, K. (2013). “Moment-rotation behavior of force-based plastic hinge elements.” 599
Earthquake Spectra, 29(1). 600
Scott, M. H. and Fenves, G. L. (2006). “Plastic hinge integration methods for force-based beam-601
column elements.”ASCE Journal of Structural Engineering, 132(2), 244–252. 602
Somerville, P., Smith, N., Punyamurthula, S., and Sun, J. (1997). “Development of ground mo-603
tion time histories for phase ii of the fema/sac steel project.”Report No. SAC/BD-97/04, SAC 604
Background Document. 605
Starossek, U. (2006). “Progressive collapse of structures: Nomenclature and procedures.”
tural Engineering International, 2(16), 113–117. 607
Starossek, U. and Haberland, M. (2008). “Measures of structural robustness–requirements and 608
applications.”ASCE SEI Structures Congress - Crossing Borders, Vancouver, Canada. 609
Thain, D., Tannenbaum, T., and Livny, M. (2005). “Distributed computing in practice: the condor 610
experience..”Concurrency - Practice and Experience, 17(2-4), 323–356. 611
UBC (1994)."Structural Engineering Design Provisions", Uniform Building Code, Vol. 2. Inter-612
national Conference of Building Officials. 613
Vamvatsikos, D. and Cornell, C. (2002). “Incremental dynamic analysis.”Earthquake Engineering
614
and Structural Dynamics, 31(3), 491–514. 615
Yeo, G. L. and Cornell, C. (2005). “Stochastic characterization and decision bases under time-616
dependent aftershock risk in performance-based earthquake engineering.” Report no., Pacific 617
List of Tables
619
1 Models description . . . 26 620
2 Periods of vibration for OpenSees models and FEMA355C model . . . 27 621
3 Mean relative difference in peak interstory drift ratio to model M1 (FEMA355C 622
2000) . . . 28 623
4 Probabilities of failure, reliability indexes and redundancy index associated with 624
Table 1. Models description
Model Columns Beams
Element
formula-tion
Material Element formulation
Material
FZLH
F orce-based fiber-section distributed plasticity
Elasto-plastic with hardening
Zero-length (Concentrated plasticity)
Elasto-plastic with
Hardening
FZLB Bilinear with
deterioration (Bilin)
FMRH
Finite-length plastic hinge (M
odified-Radau)
Elasto-plastic with
Hardening
FMRB Bilinear with
Table 2. Periods of vibration for OpenSees models and FEMA355C model
LA3 Building LA9 Building LA20 Building
OpenSees FEMA355C OpenSees FEMA355C OpenSees FEMA355C
1st Mode 1.04s 1.03s 2.40s 2.34s 4.10s 3.98s
2ndMode 0.34s 0.33s 0.90s 0.88s 1.40s 1.36s
Table 3. Mean relative difference in peak interstory drift ratio to model M1 (FEMA355C 2000)
Building Model
FZLH FMRH FMRB FZLB
LA3 4.6% 4.0% 5.6% 8.7%
LA9 4.5% 5.1% 6.4% 8.4%
Table 4. Probabilities of failure, reliability indexes and redundancy index associ-ated with the scenarios considered
Scenario LA3 Building LA9 Building LA20 Building
Mainshock
Probability of failure
(pf1)
3.56×10⁻⁴ 7.22×10⁻⁴ 6.17×10⁻⁴
Reliability index (β)
3.38 3.19 3.23
Mainshock∪Aftershock
Probability of failure
(pf3)
1.02×10⁻³ 1.66×10⁻³ 2.23×10⁻³
Reliability index (β)
3.08 2.94 2.84
Aftershock | Mainshock
Probability of failure
(pf2)
6.64×10⁻⁴ 9.39×10⁻⁴ 1.61×10⁻³
Reliability index (β)
3.21 3.11 2.95
List of Figures
626
1 Flowchart for the robustness assessment of buildings subjected to cascading seis-627
mic events . . . 32 628
2 Building Models (a) LA3; (b) LA9 and (c) LA20 and (d) P-M interaction curve . . 33 629
3 Adapted modified Ibarra-Krawinkler model: (a) backbone curve; and (b) basic 630
modes of cyclic deterioration . . . 34 631
4 LA3 building - Nonlinear static (pushover) capacity curve considering a1st mode
632
lateral load pattern . . . 35 633
5 LA9 building - Nonlinear static (pushover) capacity curve considering a1st mode
634
lateral load pattern . . . 36 635
6 LA20 building - Nonlinear static (pushover) capacity curve considering a1stmode
636
lateral load pattern . . . 37 637
7 LA3 building - Example of a mainshock-aftershock back-to-back acceleration and 638
drift response time-histories . . . 38 639
8 LA3 building hinge moment-rotation response at: (a) bottom of first story in grid 640
line A; (b) left end of first floor level beam A-B . . . 39 641
9 Deformed shapes of the buildings at two different instants: (a,c,d) - Peak interstory 642
drift ratio during the mainshock; and (b,d,f) - Peak interstory drift ratio during the 643
aftershock, for LA3, LA9 and LA20, respectively. . . 40 644
10 LA3 building - Aftershock IDA curves for ten earthquake records and four different 645
mainshock ground motion spectral accelerations . . . 41 646
11 LA3 building - Aftershock ground motion spectral acceleration at the fundamental 647
period of the intact structure that leads to failure as a function of the mainshock 648
12 Median lowest aftershock ground motion spectral acceleration at the fundamen-650
tal period of the intact structure that leads to failure (solid line and left vertical 651
axis) and median residual interstory drift ratio after mainshock (dashed line and 652
left vertical axis) as a function of the median mainshock ground motion spectral 653
Step 2
Define mainshock hazard
Step 3.1– Generate mainshock
Step 4
Define conditional aftershock hazard
Step 3.4 Compute pf1
Step 5.3 Compute pf2
Step 6 Compute Robustness Step 1
Define performance level
Step 3.2– Development of structural model
Step 3.3– Damage evaluation due to
mainshock only
Step 5.1– Generate aftershock
Step 5.2– Damage evaluation due to mainshock-aftershock
sequence
Step3
–
Mainshock
Analysis
Step5
–
Aftershock
Analysis
0 0.5 1 -1
0 1
M/My
P/P
y
Fiber-model P-M Interaction
Fiber Section
(d)
M o m e n t M
Chord rotation ?
Initial backbone curve
Ke
Mc
My
?y?c ?r ?u
Mr=?My
?p ?pc
(a)
Moment M
c Curvature
pC
c
p
c
u
c
r
c
c
c
y
c
Curvature
c
0 0.01 0.02 0.03 0.04 0.05 0.06 0.07 0.08 0.09 0.1 0
0.05 0.1 0.15 0.2 0.25 0.3 0.35 0.4
Roof drift ratio (rad)
Normalized base shear (V/W)
FEMA355 M1 Model
ASD Base shear (UBC 94)
Model FMRH Model FZLH
Model FZLB Model FMRB
Figure 4. LA3 building - Nonlinear static (pushover) capacity curve considering a
0 0.01 0.02 0.03 0.04 0.05 0.06 0.07 0.08 0.09 0.1 0
0.04 0.08 0.12 0.16 0.2
Roof drift ratio (rad)
Normalized base shear (V/W)
FEMA355 M1 Model
ASD Base shear (UBC 94)
Model FMRH Model FZLH
Model FZLB
Model FMRB
Figure 5. LA9 building - Nonlinear static (pushover) capacity curve considering a
0 0.005 0.01 0.015 0.02 0.025 0.03 0.035 0.04 0.045 0.05
0
0.01 0.02 0.03 0.04 0.05 0.06 0.07 0.08
Roof drift ratio (rad) Normalized base shear (V/W) FEMA355 M1 Model
ASD Base shear (UBC 94)
Model FMRH Model FZLH
Model FZLB
Model FMRB
Figure 6. LA20 building - Nonlinear static (pushover) capacity curve considering a
-2 -1 0 1 2 Acceleration (g)
Ground Floor -0.1
-0.05 0 0.05 0.1
Drift angleθ(rad)
1 st Story -2 -1 0 1 2 1 st Floor -0.1 -0.05 0 0.05 0.1 2 nd Story -2 -1 0 1 2 2 nd Floor -0.1 -0.05 0 0.05 0.1 3 rd Story
0 25 50 75 100 125 150
-2 -1 0 1 2 3 rd Floor Time (s)
0 25 50 75 100 125 150
-0.1 -0.05 0 0.05 0.1 Roof Time (s) A(t=3.94s)=-0.064g A(t=3.94s)=-0.837g A(t=3.94s)=-0.919g A(t=3.94s)=0.789g A(t=102.0s)=-0.536g A(t=102.0s)=0.212g A(t=102.0s)=-0.187g
A(t=102.0s)=-0.227g θ (t=3.94s)=-0.0164
θ (t=3.94s)=-0.0297
θ (t=3.94s)=-0.0411
θ (t=3.94s)=-0.0291 θ (t=102.0s)=0.0513 θ (t=102.0s)=0.0568 θ (t=102.0s)=0.0521 θ (t=102.0s)=0.0449
TP3 TP4 TP1
TP1 TP2 TP2 TP3 TP4
TP1–Mainshock
TP2–Free vibration period after the mainshock
TP3–Aftershock
TP4–Free vibration period after the aftershock
-0,045 -0,030 -0,015 0 0,015 0,030 0,045 0,060 -3000
-2000 -1000 0 1000 2000 3000
Rotation (rad)
Moment (kNm)
Left end of A-B 1 floor beam
(b)
-0,045 -0,030 -0,015 0 0,015 0,030 -4000
-2000 0 2000 4000 6000
Rotation (rad)
Moment (kNm)
Bottom of 1 story column A
Mainshock Aftershock
(a)
st st
(a)
(c).
(b)
(d)
(e) (f)
0 0.05 0.1 0.15 0.2 0 1 2 3 4 5 6 S a m (T 1)=0.3g
Aftershock spectral acceleration
(g)
0 0.05 0.1 0.15 0.2
0 1 2 3 4 5 6 S a m (T 1)=1.2g
0 0.05 0.1 0.15 0.2
0 1 2 3 4 5 6 S a m (T 1)=2.1g
Aftershock spectral acceleration
(g)
Peak interstory drift ratio θ max(rad)
0 0.05 0.1 0.15 0.2
0 1 2 3 4 5 6 S a m (T 1)=2.4g
Peak interstory drift ratio θ max(rad) Earthquake E5 Collapse criteria Collapse criteria Collapse criteria Collapse criteria E8 E8 E8 E8 E4 E4 E4 E4 E8
0.0 0.5 1.0 1.5 2.0 2.5 3.0 3.5 4.0 0.0 0.5 1.0 1.5 2.0 2.5 3.0 3.5 4.0 mainshock -aftershock =3.34
mainshock only
=3.72
LA3, Mainshock E5-Af tershock E5
A f t e r s h o c k S p e c t r a l A c c e l e r a t i o n t h a t l e a d s t o f a i l u r e ( g )
Mainshock Spectral Acceleration (g)
0 0.5 1.0 1.5 2.0 2.5 3.00.0 2.0 4.0 6.0 8.0 10.0
0 0.5 1.0 1.5 2.0 2.5 3.0
LA 3 LA 9
LA 20
Median Mainshock spectral acceleration (g)
Median
Aftershock Spectral
Acceleration (g)
Residual Interstory Drift Ratio (%)
Minimum aftershock leading to failure Post-mainshock residual IDR .
.
Failure during mainshock