Vibrational spectroscopy of the mineral meyerhofferite
CaB
3
O
3
(OH)
5
H
2
O – An assessment of the molecular structure
Ray L. Frost
a,⇑, Andrés López
a, Yunfei Xi
a, Ricardo Scholz
b, Geraldo Magela da Costa
cFernanda M. Belotti
d, Rosa Malena Fernandes Lima
eaSchool of Chemistry, Physics and Mechanical Engineering, Science and Engineering Faculty, Queensland University of Technology, GPO Box 2434, Brisbane, Queensland 4001, Australia bGeology Department, School of Mines, Federal University of Ouro Preto, Campus Morro do Cruzeiro, Ouro Preto, MG 35,400-00, Brazil
c
Chemistry Department, Federal University of Ouro Preto, Campus Morro do Cruzeiro, Ouro Preto, MG 35,400-00, Brazil
d
Federal University of Itajubá, Campus Itabira, Itabira, MG 35,903-087, Brazil
e
Mining Engineering Department, School of Mines, Federal University of Ouro Preto, Campus Morro do Cruzeiro, Ouro Preto, MG 35,400-00, Brazil
h i g h l i g h t s
Meyerhofferite Ca2(H3B3O7)24H2O is
found in sedimentary or lake-bed borate deposits.
We have studied the Raman and infrared spectra.
We have assessed the molecular structure of meyerhofferite. A comparison is made between the
Raman and infrared spectrum. Raman spectroscopy proved far more
useful for the detection of meyerhofferite than infrared spectroscopy.
g r a p h i c a l
a b s t r a c t
a r t i c l e
i n f o
Article history:
Received 18 March 2013
Received in revised form 6 May 2013 Accepted 7 May 2013
Available online 20 May 2013
Keywords:
Raman spectroscopy Borate
Meyerhofferite Inyoite Colemanite
a b s t r a c t
Meyerhofferite is a calcium hydrated borate mineral with ideal formula: CaB3O3(OH)5H2O and occurs as
white complex acicular to crude crystals with length up to4 cm, in fibrous divergent, radiating aggre-gates or reticulated and is often found in sedimentary or lake-bed borate deposits.
The Raman spectrum of meyerhofferite is dominated by intense sharp band at 880 cm 1assigned to the
symmetric stretching mode of trigonal boron. Broad Raman bands at 1046, 1110, 1135 and 1201 cm 1are
attributed to BOH in-plane bending modes. Raman bands in the 900–1000 cm 1spectral region are
assigned to the antisymmetric stretching of tetrahedral boron. Distinct OH stretching Raman bands are observed at 3400, 3483 and 3608 cm 1. The mineral meyerhofferite has a distinct Raman spectrum which
is different from the spectrum of other borate minerals, making Raman spectroscopy a very useful tool for the detection of meyerhofferite in sedimentary and lake bed deposits.
Ó2013 Elsevier B.V. All rights reserved.
Introduction
Meyerhofferite is a calcium hydrated borate mineral of ideal formula CaB3O3(OH)5H2O and occurs chiefly as an alteration
prod-uct of inyoite Ca(H4B3O7)(OH)4H2O, another mineral[1]. The
min-eral was first discovered in Death Valley, USA in 1914 [2]. The mineral shows a complex acicular to crude crystals with lengths up to4 cm, in fibrous divergent, radiating aggregates, and is
com-monly reticulated[3]. The mineral shows some sort of topotactical relationship with inyoite [1]. It is often found with colemanite Ca(B3O4(OH)3)H2O. The mineral is often found in sedimentary or
lake-bed borate deposits[4].
1386-1425/$ - see front matterÓ2013 Elsevier B.V. All rights reserved. http://dx.doi.org/10.1016/j.saa.2013.05.016
⇑ Corresponding author. Tel.: +61 7 3138 2407; fax: +61 7 3138 1804.
E-mail address:[email protected](R.L. Frost).
Contents lists available atSciVerse ScienceDirect
Spectrochimica Acta Part A: Molecular and
Biomolecular Spectroscopy
als. There have been a number of studies looking at the effect of radiation on borate glasses[18,19]. If there is to be an understand-ing of borate glasses and their role in radioactive element contain-ment, then an understanding of the vibrational spectroscopy of borate minerals needs to be undertaken. The number of vibrational spectroscopic studies of borate minerals is quite few and far be-tween[20–23]. The number of Raman studies of borate minerals is also very limited[24,25]. There have been a number of infrared studies of some natural borates[26–29]. Most of these references are not new and there have been no recent studies on the vibra-tional spectroscopy of natural borates. Ross in Farmer’s treatise re-ported the infrared spectra of several borate minerals[30]. The use of infrared spectroscopy is limited by the spatial resolution of the technique which is around 25
l
m. In comparison, the spatialreso-lution using Raman spectroscopy is 1
l
m. Thus, when studying amineral using spectroscopic techniques it is advantageous to use Raman spectroscopy. The selection of the target mineral is more easily made. With infrared spectroscopy, any impurities will be measured as well as the target mineral.
Yet, there remains the issue of the vibrational spectroscopic study of natural borate minerals. In this research, our objective is to study the Raman and infrared spectra of the mineral meyer-hofferite and relate the spectra to the structure of the mineral.
Experimental
Samples and preparation
Off white meyerhofferite single crystals were obtained from the collection of the Geology Department of the Federal University of Ouro Preto, Minas Gerais, Brazil, with sample code SAA-121. The mineral originated from the Bigadic deposits, Turkey [31–33]. Meyerhofferite occurs in evaporate sediments. The crystals are in association with other borates such as hydroboracite, inyoite and gypsum. The studied sample was gently crushed and the pure frag-ments were selected under a stereomicroscope Leica MZ4. X-ray diffraction
X-ray diffractograms were obtained in a Shimadzu XRD 6000 diffractometer equipped with an iron tube and a graphite mono-chromator. The scans were done between 10–60°(2h) with a scan-ning speed of 0.5°/min. Silicon was used as an internal standard. Cell parameters were refined by means of the Jade+program using
least-square refinement after subtracting the background and the Ka2 contribution and using intensity and angular weighting of the most intense peaks.
Chemical characterization
Chemical study was done with support of Scanning Electron Microscopy (SEM) and Electron Microprobe (EMP). Experiments
selected element was used the following standards: Fe – Magne-tite, Mn – Rodhonite, Zn – Sphalerite, F – Fluorite, As – Arsenopy-rite, P – Ca2P2O7, Ca, Si and Al – Anorthite100 and Mg – MgO. The
epoxy embedded meyerhofferite sample was polished in the se-quence of 9
l
m, 6l
m and 1l
m diamond paste MetaDIÒIIDia-mond Paste – Buhler, using water as a lubricant, with a semi-automatic MiniMetÒ
1000 Grinder–Polisher – Buehler. Finally, the epoxy embedded sample was coated with a thin layer of evap-orated carbon. The electron probe microanalysis in the WDS (wavelength dispersive spectrometer) mode was obtained at 15 kV accelerating voltage and beam current of 10 nA. Chemical formula was calculated on the basis of nine oxygen atoms.
Raman spectroscopy
Crystals of meyerhofferite were placed on a polished metal sur-face on the stage of an Olympus BHSM microscope, which is equipped with 10, 20, and 50 objectives. The microscope is
part of a Renishaw 1000 Raman microscope system, which also in-cludes a monochromator, a filter system and a CCD detector (1024 pixels). The Raman spectra were excited by a Spectra-Phys-ics model 127 He–Ne laser producing highly polarized light at 633 nm and collected at a nominal resolution of 2 cm 1and a
pre-cision of ±1 cm 1in the range between 200 and 4000 cm 1.
Re-peated acquisitions on the crystals using the highest magnification (50) were accumulated to improve the signal to
noise ratio of the spectra. Spectra were calibrated using the 520.5 cm 1line of a silicon wafer. The Raman spectrum of at least
10 crystals was collected to ensure the consistency of the spectra.
Infrared spectroscopy
Infrared spectra were obtained using a Nicolet Nexus 870 FTIR spectrometer with a smart endurance single bounce diamond ATR cell. Spectra over the 4000–525 cm 1 range were obtained
by the co-addition of 128 scans with a resolution of 4 cm 1and a
mirror velocity of 0.6329 cm/s. Spectra were co-added to improve the signal to noise ratio.
Results and discussion
Mineral characterization
The X-ray diffraction pattern of is shown inFig. 1. All the major peaks can be associated to meyerhofferite, but there are a few low-intensity peaks that could not be properly identified. Considering their low intensities, it is estimated that this minor phase contrib-utes with less than 5% w/w for the total sample. The refined cell-parameters were found as: a= 6.637(4), b= 8.354(4), and c= 6.477(3), in good agreement with the literature values (pdf file 12-0411). Other commonly associated minerals, such as gypsum, hydroboracite and inyoite were not observed.
The Backscattering Image (BSI) image of meyerhofferite sample studied in this work is shown inFig. 2. The image shows a fragment of a single crystal, with prismatic form along thecaxis. The image shows three perfect cleavage directions and no zonation is ob-served. Qualitative chemical analysis shows a homogeneous com-position, with predominance of Ca (Fig. 3). In the EDS spectra, minor amounts of Al were also observed.
The thermogravimetric analysis is presented inFig. 4. The TG curve shows a main decomposition at 217°C followed by a second decomposition centered at about 436°C. The total loss of mass is 27.8% upon heating up to 1000°C.
The quantitative chemical analysis of meyerhofferite is pre-sented inTable 1. The composition was calculated as mean values in three spots. The range of the chemical analysis is also presented, and shows no significant variance. H2O content was calculated by
thermogravimetric analysis and B2O3was calculated by
stoichiom-etry. The chemical formula was calculated on the basis of 9 oxygen Fig. 1.X-ray diffraction pattern of meyerhofferite. Silicon was added as a internal
standard.
Fig. 2.BSI image of meyerhofferite.
Fig. 3.EDS analysis of meyerhofferite.
Fig. 4.TG/DTG graphic.
Table 1
Chemical composition of meyerhofferite (mean of 3 spots). H2O calculated by
thermogravimetric analysis and B2O5calculated by stoichiometry.
Constituent wt.% Range (wt.%)
Number of atoms
Probe standard
CaO 22.01 21.75–
22.38
0.97 Anorthite100
B2O3 46.71 3.09 Calculated by stoichiometry
MgO 0.00 0.00–0.01 0.00 MgO
Al2O3 0.00 0.00–0.00 0.00 Anorthite100
P2O5 0.02 0.00–0.05 0.00 Ca2P2O7
As2O5 0.04 0.00–0.08 0.00 Arsenopyrite
ZnO 0.01 0.00–0.03 0.00 Sphalerite
MnO 0.01 0.00–0.03 0.00 Rodhonite
FeO 0.00 0.00 0.00 Magnetite
SiO2 0.00 0.00 0.00 Anorthite100
F 0.00 0.00 0.00 Fluorite
H2O 27.84 H2O 0.97 Calculated by
thermogravimetric analysis
OH 4.87
The infrared spectrum over the 500–4000 cm spectral range is shown in Fig. 5b. Compared with the Raman spectrum, much greater intensity is found in the infrared spectrum. As with the Ra-man spectrum, the infrared spectrum is subdivided into sections for more detailed analysis, depending on the type of vibration being observed.
The Raman spectrum in the 800–1400 cm 1spectral region is
displayed inFig. 6a. In comparison, the infrared spectrum in the 500–1300 cm 1region is shown inFig. 6b. This spectral region is
where the trigonal and tetrahedral borate bands are observed. A very intense Raman band is observed at 880 cm 1. This band is
as-signed to the symmetric stretching mode of trigonal borate. The symmetric stretching mode of tetrahedral boron is normally ob-served in the 700–850 cm 1 spectral region. The intense Raman
band at 609 together with the Raman band at 728 cm 1are
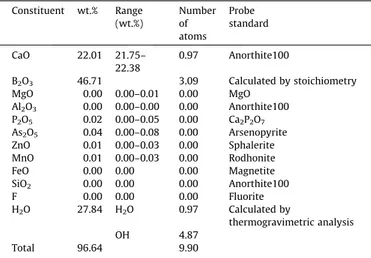
as-signed to this vibrational mode (Fig. 7a). The four bands at 935, 944, 958 and 1002 cm 1 are attributed to the antisymmetric Fig. 5.(a) Raman spectrum of meyerhofferite in the 100–4000 cm 1region, (b)
infrared spectrum of meyerhofferite in the 500–4000 cm1region.
Fig. 6.(a) Raman spectrum of meyerhofferite (upper spectrum) in the 800– 1400 cm1 spectral range and (b) infrared spectrum of meyerhofferite (lower
spectrum) in the 500–1300 cm 1spectral range.
Fig. 7.(a) Raman spectrum of meyerhofferite (upper spectrum) in the 300– 800 cm1 spectral range and (b) Raman spectrum of meyerhofferite (lower
stretching vibrations of tetrahedral boron. The Raman bands at 1110, 1135, 1201 cm 1are attributed to the BOH in-plane bending
modes. According to Ross[30](page 220 of this reference), bands between 1300 and 1500 cm 1 are due to the antisymmetric
stretching modes of trigonal boron. The broad band at 1367 cm 1
may therefore be assigned to the stretching vibration of trigonal boron.
The infrared spectrum of meyerhofferite shows complexity with a series of overlapping bands. Ross[30](page 222 of this ref-erence) reported the infrared spectrum of meyerhofferite and drew attention to the infrared spectrum of the borate mineral inyoite. The infrared spectra of several borate minerals[29,34]have been determined but no band assignments were made. The infrared spectra of some synthetic borates has been compared with the infrared spectra of some selected natural borates[35]. No band assignment was undertaken. The infrared bands are more likely to reflect the antisymmetric stretching vibrations as opposed to the symmetric stretching vibrations which are more intense in the Raman spectrum. Thus, the infrared band at 968 cm 1is
as-signed to the asymmetric stretching vibration of tetrahedral boron. The strong infrared bands at 1084, 1144 and 1196 cm 1are due to
the OH in-plane bending modes. The series of infrared bands in the 800–900 cm 1spectral range are best described as the symmetric
stretching of tetrahedral boron. The infrared bands at 659, 676 and 724 cm 1are assigned to the bending modes of trigonal and
tetra-hedral boron. These bands are observed as low intensity bands in the Raman spectrum and are observed at 627, 698 and 728 cm 1
(Fig. 7a). A series of low intensity Raman bands are observed at 366, 381, 398. A series of low intensity Raman bands are observed at 366, 381, 398, 435, 474 and 493 cm 1. It is probable that these
bands could also be assigned to borate bending modes. The bands
in the 100–300 cm 1spectral region (Fig. 7b) are assigned to lattice
vibrations.
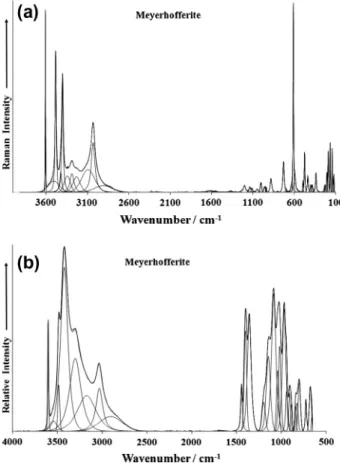
The Raman and infrared spectra of meyerhofferite mineral in the 2600–3800 cm 1 spectral range are displayed inFig. 8a and
b. Meyerhofferite contains both water and hydroxyl units, and therefore bands would be expected from these moieties. The very sharp Raman bands at 3400, 3483 and 3608 cm 1and the
equiav-lent infrared bands at 3485 and 3603 cm 1 are assigned to the
stretching vibration of the hydroxyl units. The Raman bands at 3031, 3092, 3232, 3287 and 3344 cm 1 are attributed to water
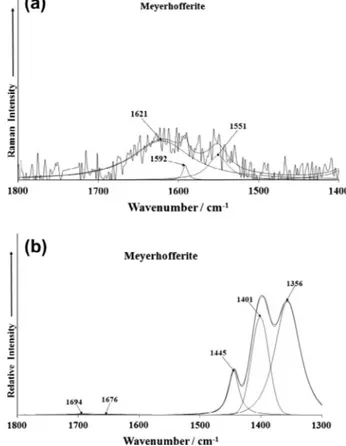
stretching bands. Such bands show much greater intensity in the infrared spectrum; bands are observed at 3032, 3173, 3301 and 3424 cm 1. The Raman spectrum in the 1400–1800 cm 1spectral
region is provided inFig. 9a. The spectrum suffers from a lack of signal; nevertheless a broad band is identified at 1621 cm 1and
is assigned to the bending mode of water. This band is identified as the bands at 1676 and 1694 cm 1 in the infrared spectrum.
The position of these bands is indicative of strongly hydrogen bonded water. Intense infrared bands are found at 1356, 1401 and 1445 cm 1. These bands are assigned to the antisymmetric
stretching of trigonal boron.
Conclusions
There are many borate minerals which have yet to have their vibrational spectrum determined and the molecular structure as-sessed in terms of their vibrational spectrum. Included in this group of natural borates is the mineral meyerhofferite, which to the best of the authors’ knowledge has not had its Raman spectrum analyzed. In this work we have measured the Raman and infrared spectrum of meyerhofferite over the complete spectral range. Fig. 8.(a) Raman spectrum of meyerhofferite (upper spectrum) in the 2600–
4000 cm1 spectral range and (b) infrared spectrum of meyerhofferite (lower
spectrum) in the 2600–4000 cm1spectral range.
Fig. 9.(a) Raman spectrum of meyerhofferite (upper spectrum) in the 1400– 2000 cm 1 spectral range and (b) infrared spectrum of meyerhofferite (lower
is to state which bands are due to trigonal and tetrahedral boron. The Raman spectrum of meyerhofferite is dominated by intense sharp band at 880 cm 1 assigned to the symmetric stretching
mode of trigonal boron. Broad Raman bands at 1046, 1110, 1135 and 1201 cm 1are attributed to BOH in-plane bending modes.
Ra-man bands in the 900–1000 cm 1spectral region are assigned to
the antisymmetric stretching of tetrahedral boron. Both the Raman and infrared spectrum of meyerhofferite in the hydroxyl stretching region show intense bands. In the Raman spectrum, the intensity of the bands attributed to the hydroxyl units are far more intense than the bands assigned to water stretching vibrations. This is be-cause water is such a poor Raman scatterer. On the other hand water is such a very intense absorber; the infrared bands are very strong whereas the infrared bands of the OH units are significantly lower. Distinct OH stretching Raman bands are observed at 3400, 3483 and 3608 cm 1. The mineral meyerhofferite has a distinct
Ra-man spectrum which is different from the spectrum of other borate minerals, making Raman spectroscopy a very useful tool for the detection of meyerhofferite.
Acknowledgments
The financial and infra-structure support of the Queensland University of Technology, Chemistry discipline is gratefully acknowledged. The Australian Research Council (ARC) is thanked for funding the instrumentation. The authors would like to acknowledge the Center of Microscopy at the Universidade Federal de Minas Gerais (http://www.microscopia.ufmg.br) for providing the equipment and technical support for experiments involving electron microscopy. R. Scholz thanks to CNPq – Conselho Nacional
[5]C.L. Christ, J.R. Clark, Acta Cryst. 9 (1956) 830.
[6]C.L. Christ, J.R. Clark, Zeit. Fuer Kristall. 114 (1960) 321–342. [7]J.R. Clark, C.L. Christ, Zeit. Fuer Kristall. 112 (1959) 213–233.
[8]C. Palache, Am. Mineral. 23 (1938) 644–648.
[9]P.C. Burns, F.C. Hawthorne, Can. Mineral. 31 (1993) 305–312. [10]R. Birsoy, Turk Muhend. ve Cevre Bilim. Derg. 12 (1988) 188–194.
[11] J.B. Farmer, A.J.D. Gilbert, P.J. Haines, in: Proc. 7th Int. Conf. Therm. Anal., vol. 1, 1982, pp. 650–656.
[12]I. Ardelean, S. Cora, J. Mater. Sc. 19 (2008) 584–588.
[13]I. Ardelean, S. Cora, J. Optoelectron Adv. Mater. 12 (2010) 239–243. [14]I. Ardelean, L. Griguta, J. Optoelectron. Adv. Mater. 9 (2007) 2068–2070. [15]I. Ardelean, V. Timar, J. Optoelectron Adv. Mater. 10 (2008) 246–250. [16]F.H. El Batal, M.A. Azooz, A.A. El-Kheshen, Trans. Ind. Ceram. Soc. 68 (2009) 81–
90.
[17]F.H. ElBatal, Y.M. Hamdy, Trans. Ind. Ceram. Soc. 67 (2008) 193–202. [18]C. Rajyasree, P.M. Vinaya Teja, K.V.R. Murthy, D. Krishna Rao, Condense. Mater.
406 (2011) 4366–4372.
[19]B. Sumalatha, I. Omkaram, T.R. Rao, C.L. Raju, J. Non-Cryst. Solids 357 (2011) 3143–3152.
[20]M. Mir, J. Janczak, Y.P. Mascarenhas, J. Appl. Cryst. 39 (2006) 42–45. [21]I. Mitov, Z. Cherkezova-Zheleva, V. Mitrov, J. Balkan Trib. Ass. 4 (1998) 191–
200.
[22]A.S. Povarennykh, E.I. Nefedov, Geol. Zh. 31 (1971) 13–27. [23]V.S. Suknev, E.N. Diman, Zh. Prikladnoi Spektros. 10 (1969) 326–328. [24]V.F. Ross, J.O. Edwards, Chem. Boron Its Compd. (1967) 15–207. [25]R.L. Frost, J. Raman Spectrosc. 42 (2011) 540–543.
[26]M.V. Akhmanova, Zh. Struk. Khim. 3 (1962) 28–34.
[27]D.A. Long, R.T. Bailey, Spectrochim. Acta 19 (1963) 1607–1610. [28]A. Vasko, I. Srb, Czech. J. Phys. 17 (1967) 1110–1123. [29]C.E. Weir, Phys. Chem. 70 (1966) 153–164.
[30] V.C. Farmer, Mineralogical Society Monograph 4: The Infrared Spectra of Minerals, London, 1974.
[31]C. Helvaci, Mercian Geol. 6 (1978) 257–270.
[32]C. Helvaci, R.N. Alonso, Turk. J. Earth Sci. 9 (2000) 1–27.