*e-mail: [email protected]
Gideã T. Tractz,a Aline Viomar,a Bianca V. Dias,a Camila A. de Lima, a
Everson P. Banczek,a Maico T. da Cunha,a Sandra R. M. Antunesb and
Paulo R. P. Rodrigues *,a
aDepartamento de Química, Universidade Estadual do Centro Oeste,
Campus Centro Educacional de Desenvolvimento Tecnológico de Guarapuava (Cedeteg), 85040-080 Guarapuava-PR, Brazil
bDepartamento de Química, Universidade Estadual de Ponta Grossa,
Campus Uvaranas, 84030-900 Ponta Grossa-PR, Brazil
Natural dyes can be used in dye sensitized solar cells (DSSCs) to generate low-cost devices, although with low light harvesting because of energy losses from the recombination process. This study investigates recombination reactions in DSSCs with natural dyes extracted from eggplants, plums, and hibiscus flowers. Titanium dioxide films were coated on a fluorine-doped tin oxide glass conductor substrate by the doctor blading method and impregnated in a dye solution for 24 h. Electrodeposited platinum was used as the cathode, and I3
–/I– as the redox couple. The techniques
employed were: intensity modulated photovoltage spectroscopy, intensity modulated photocurrent spectroscopy, electrochemical impedance spectroscopy, charge extraction, and cyclic voltammetry. The results show that cells containing plum dye exhibited the best photovoltaic parameters, with high values of gap, charge extraction, and potential, being less resistive to charge transfer with an electron lifetime of 0.51 s, collection time of 8.54 ms, and charge efficiency collection of 0.99.
Keywords: Gratzel cell, IMVS, IMPS photovoltaic devices
Introduction
The increasing energy demand to support economic growth and reduce the greenhouse effect caused by the oil product combustion, has led to the search for development of clean energy alternatives to fossil fuel combustion.1 Solar energy is an important resource because of its inexhaustibility and pollution-free character.1,2
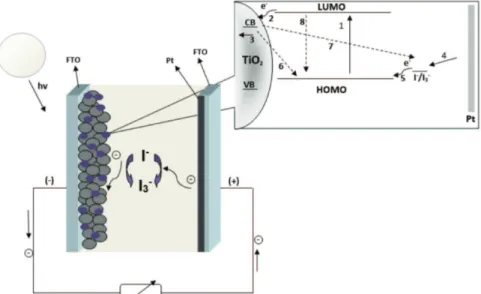
Dye-sensitized solar cells (DSSCs) are devices that can convert sunlight to electricity by a photovoltaic effect, theoretically exceeding the Shockley-Queisser limit.2 Light harvesting is provided by the use of a semiconductor material with an ideal sensitizer, which can absorb the light and eject electrons to an excited state (lowest unoccupied molecular orbital (LUMO) level; Figure 1).3,4 The use of an electrolyte is necessary to intermediate the charges and allow an electron flow.5-7
The most promising method for light conversion in DSSCs is via nanocrystalline TiO2, sensitized with ruthenium complexes, such as cis-[Ru
(2,2’-bipyridil-4,4’-dicarboxylic acid)2(NCS)2] (N3) and (Bu4N)2[Ru (2,2’-bypiridil-4,4’-dicarboxylic acid)2(NCS)2] (N719). However, these molecules have a high cost that gives impetus to the search for lower-cost materials such as natural dyes, containing flavonoids, as anthocyanins.7
Anthocyanins, present in a wide variety of flowers and fruits, have auxochrome groups such as COOH and OH that absorb light in a visible energy range from sunlight, in a less efficient way when compared with ruthenium-based dyes, but the cost can make their use viable.5 Energy conversion is promoted by the charge carriers, and the operational principle of DSSCs has important characteristics.
The generation and separation of charge carriers produce voltage and current in these devices, under solar illumination.6 Electron transport in nanocrystalline oxide can be limited by the reaction of the I3– before reaching the substrate or returning to the LUMO state, as depicted in Figure 1 (reactions 6-8).8 These reactions are known as recombination reactions, and they decrease the device solar energy efficiency.9
The key of the efficiency cell is the competition between reactions 3 and 7 (Figure 1). In reaction 3, the electrons Gideã T. Tractz,a Aline Viomar,a Bianca V. Dias,a Camila A. de Lima, a
Everson P. Banczek,a Maico T. da Cunha,a Sandra R. M. Antunesb and
move through the external circuit to meet the counter electrode, and, in reaction 7, the electrons in the TiO2 surface recombine with the oxidized dye according to the following reaction 9 (equation 1):5,8
I3– + 2e– (TiO2) → 3I– (1)
For devices made of the most efficient dyes, process 3 is much more rapid than process 7, and recombination to natural dyes was not reported in the literature. These values are determined by photovoltage and photocurrent measurements using modulated and pulsed illumination.8
The aim of this paper is to study the recombination process in lower-cost dye sensitized solar cells produced with TiO2 and dyes extracted from different natural products, using electrochemical and optical measurements.
Experimental
For the extraction, 6.25 g of natural products, such as hibiscus flowers (Hibiscussabdariffa), eggplant peel (Solanum melongena), and plum peel (Prunus domestica) were extracted with 65 mL of acidified ethanol solution (70%) at 5 oC for 12 h and used as dye.10-13 Anthocyanidin is formed when the glucose group of an anthocyanin is removed upon acidification, and the less steric hindrances result in strong bonding to the TiO2 surface, generating cells with better parameters, as described by Kumara et al.14 and Manhita et al.15
The photoanode was prepared with 3 g commercial TiO2 anatase (< 25 nm; Sigma-Aldrich), 0.1 mL of acetylacetone, 1 mL of polyethylene glycol 200, 4 mL of deionized water, and 0.1 mL of Triton X.10 The fluorine-doped tin
oxide (FTO; ca. 7 Ω sq-1) glass was cleaned in a solution (70:30 water/ethanol) using an ultrasonic bath for 15 min and then dried. The TiO2 emulsion was coated on the FTO by employing the doctor blading technique, followed by calcination at 450 oC for 30 min. The dyes were attached to the TiO2 surface by immersing the coated electrode in a dye solution for 24 h.13
The platinum counter electrode was prepared by cyclic voltammetry using three electrodes: the FTO (working electrode), Ag(s)/AgCl(s) (reference electrode) and platinum (counter electrode), at a scan rate of 10 mV s-1 with a supporting electrolyte prepared by 1 × 10⁻⁴ mol L-1 K2PtCl6 dissolved in 0.1 mol L-1 HCl.16 The solar cell was assembled in a sandwich format (Figures 2a-2c) with an electrolyte prepared with 0.5 mol L-1 tert-butylpyridine, 0.6 mol L-1 tetrabutylammonium iodide, lithium iodide, and 0.1 mol L-1 of resublimated iodine, solubilized in methoxypropionitrile.16 The active area used was 0.2 cm2.
The anthocyanidin present on the TiO2 film was
confirmed by the increase in the color intensity of the film, to a brighter red coloration, when concentrated hydrochloric acid was added, as described by Narayan17 and Lim et al.18 Electrochemical measurements were performed in a Zhenium Zahner potentiostat with a solar simulator provided by a xenon lamp. The charge extraction (CE) method of DSSCs under controlled illumination intensity (100 mW cm-2) was extracted by short-circuiting the cell from an open-circuit potential with light on time and a discharge time of 10 s in a time extraction of 15 s.19,20 Electron transport time and electron lifetimes were measured by modulated photovoltage spectroscopy (IMVS) and intensity-modulated photocurrent spectroscopy (IMPS), in a frequency range between 100 mHz and 1 kHz under 100 mW cm-2.
The electrochemical impedance spectroscopy (EIS) analyses were recorded in the frequency range between 10 mHz and 10 kHz with an irradiance of 100 mW cm-2 under standard illumination of air-mass 1.5 global (AM 1.5 G) and perturbation of 10 mV. Solar conversion efficiency measurement was tested in the same conditions.
The absorption spectra of dyes on TiO2 surfacewere obtained by an Ocean Optics spectrometer (USB-2000), coupled to a tungsten lamp and an optical fiber suitable for solid samples, in a range of 400 to 900 nm.
Cyclic voltammetry measurements were carried out in three electrode systems, consisting of a glassy carbon working electrode, platinum counter electrode, and Ag/AgCl reference electrode at a scan rate of 100 mV s-1. The
supporting electrolyte was 0.5 mol L-1 KCl in distilled water. The voltammograms obtained, with UV-Vis spectra of the dyes on TiO2 surface, were used to calculate the energy level of the natural photosensitizers.
Results and Discussion
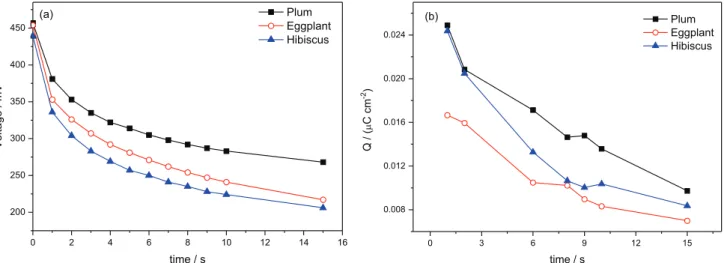
Figures 3a and 3b illustrate photovoltage decay and the charge density of the photoanode, respectively, determined by the CE method as a function of time to all cells produced.
Figure 3a illustrates the time dependence of the photovoltage for the cells analyzed. When the lamp was switched on, the voltage attained values close to 450 mV. When the lamp was switched off, the voltage decayed over Figure 2. Natural dyes (a) plum; (b) eggplant; and (c) hibiscus, and the respective cell assemblies in sandwich format of anode and cathode.
a period of seconds. Because the extract current is zero, a decrease in voltage can only be attributed to recombination electrons transferred to the electrolyte or oxidized dye molecules (reactions 6-8, Figure 1).8,19 Finally, the cell was short-circuited (jsc) and the charge was calculated and used to verify the electron concentration on TiO2 photoanode (Figure 3b).8,20-22
The results in Figure 3a indicate high values of voltage decay to cells sensitized with plum (380 mV in 1 s decay) when compared with other systems. This measurement, when accompanied with CE in Figure 3b that showed more electron density in TiO2 photoanode to the same cell (0.025 µC cm-2), indicated that recombination reactions are more pronounced in the cell produced with the dye extracted from eggplant.8,23 The lower concentration of active substances, dye adsorption of anchoring groups
on TiO2 surface, and position of auxochromes and
chromophore groups may be responsible for the result, but they have not been evaluated independently.24
The most favorable result, comparing the natural dyes tested, was the cell using the plum dye, with an initial photovoltage of 458 mV, and the lowest was the eggplant cell with 0.017 µC cm-2 of CE in 1 s with 438 mV of initial photovoltage.9,25
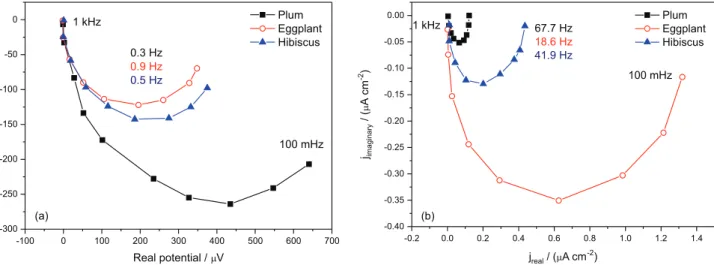
The IMVS curve depicted in Figure 4a and IMPS in Figure 4b were obtained and used to calculate the collection time (τc) and electron lifetime (τr), quantifying the results of the previous measurements.8,26
Figures 4a and 4b illustrate typical complex plane plots for the IMVS and IMPS responses at 100 mW of light intensity. In the absence of electron-hole recombination, the phase shift of the IMPS semicircle is the result of the time delay between the generation and collection of charge carriers.27-29 At low frequencies, the IMPS plots converge to a point on the real axis that corresponds to the
steady-state photocurrent, as described by Ghan et al.27 At high frequencies, the modulated photocurrent tends to zero, indicating that the modulation frequency is faster than the relaxation of the charge carrier density, by transport to the contacts and recombination reaction.27,30 In the case of the IMVS technique, the response is semicircular, and the phase lag is caused by the relaxation of electrons by back reaction with cations, in the hole conductor matrix, which are assumed to be in excess.30,31 The τ
r can be obtained from the IMVS plot according to the following equation:18
(2)
in which fr is the minimum point frequency (in Hz) of the IMVS response. The order of magnitude of the mean transit time for photogenerated electrons can be obtained from the frequency minimum in the complex plane IMPS plot, as equation 3:18
(3)
in which fc is the minimum point frequency (in Hz) of the IMPS response. The results of τc and τr are shown in Table 1.
Using the IMPS and IMVS response, it is possible to calculate the charge collection efficiency (ηc) for all the systems, employing equation 4.
Figure 4. (a) IMVS and (b) IMPS responses to DSSCs with natural dyes.
Table 1. Collection time and electron lifetime extract from IMPS and IMVS curves, calculated using equations 2 and 3
Dye τc / ms τr / s ηc
Plum peel 2.35 0.51 0.99
Eggplant peel 8.54 0.18 0.95
Hibiscus flower 3.80 0.30 0.98
collection time, 2.35 ms, when compared with the hibiscus and eggplant dyes, respectively.19 All natural dyes have anthocyanidin, a solar active pigment responsible for the harvesting of radiant energy, and this result indicated a large percentage of active substances in its composition.28
With better capacity to inject electrons, the cell sensitized with plum is expected to have a higher concentration of electrons in the semiconductor as analyzed by CE measurement, indicating that these electrons are collected in a shorter time.19
For low charge collection efficiency, the variation of
τc and τr must be as small as possible.28,29 As the time differences of the system are of a high order, all the cells produced showed high-efficiency charge collection of
ηc = 0.99 for plum, ηc = 0.95 for eggplant, and ηc = 0.98 for hibiscus. The best result, that for the plum cell, suggests that almost all the incident light is converted to electricity.29-31 These results show that, although the cells had different values of IMPS and IMVS, the efficiency of charge collection was close to all the systems.
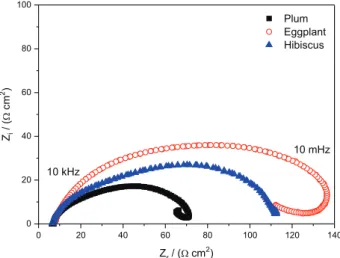
In Figure 5, the Nyquist plots for all cells produced with natural dyes are shown.
Nyquist plots of cells made with ruthenium-based dyes show three semicircles that can be assigned to charge transfer in the counter electrode (high frequency), the electron recombination and electron diffusion in the TiO2 conduction band (CB; intermediary frequency) and the electrolyte diffusion in solution in the low-frequency region.32 In the case of the natural dyes tested, only one semicircle was observed, and this behavior can be explained
used natural dyes in DSSCs.
Analysis of the cells tested shows that the plum dye can generate devices with less charge transfer resistance because of a lower impedance value, which facilitates the passage of current and consequently improves the photoelectrochemical parameters.33,34 The eggplant cell presented a high impedance value because of a larger capacitive arc, which consequently led to lower photoelectrochemical parameters.34
To support previous results, the measurements of the j vs. V curves are shown in Figure 6, and the energy conversion efficiency was calculated using the following equation:35-37
(5)
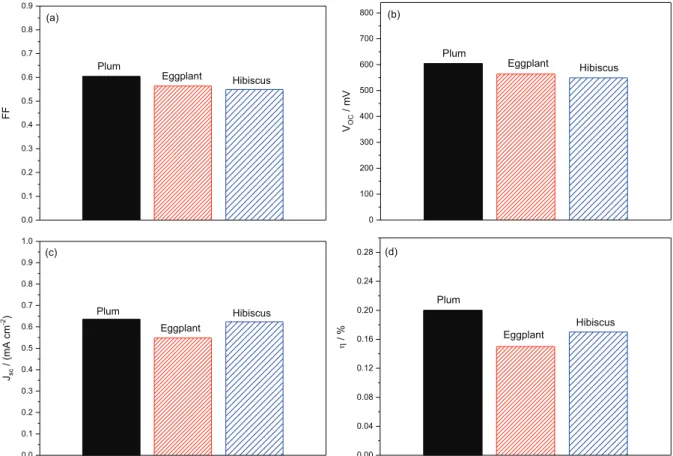
The best performance was observed from DSSCs sensitized with plum extract, showing an energy efficiency (η) of 0.20% with an open-circuit potential (Voc) of 608 mV, short-circuit current (jsc) of 0.64 mA cm-2, and fill factor (FF) of 0.61 under solar irradiation (Pin) of 100 mW cm-2.38-40
According to Tsai et al.,40 j
sc of a DSSC is influenced by the recombination rate at the interface of natural dye/TiO2 (reactions 6 and 8, Figure 1) or TiO2/electrolyte (reaction 7, Figure 1); therefore, the jsc performance of a DSSC is improved when the τr decay and τc increase, as observed in the systems analyzed.22,23,41
The results obtained confirm that the recombination reaction was more pronounceable for eggplant, and all the photovoltaic parameters for the cells analyzed decreased, generating a device with a solar energy efficiency of 0.15%, which was already expected, because the cell sensitized with eggplant dye presented inferior results of charge transfer resistance, CE, and recombination and collection times when compared with other dyes.
The driving force of the electron transport through the semiconductor network depends on the electron concentration gradient, such as the photosensitization of TiO2 with natural dyes presenting a lower electron concentration in the photoanode caused by lower absorption of sunlight, as shown by the CE technique. This may restrict the transport of electrons in the semiconductor, in contrast to ruthenium-based dyes (ca. 80 µC cm-2), leading to a low conversion efficiency.28-30
Absorption spectra of dye solution10,42 and on TiO 2 surface (Figure 7) give useful information about the optical and electrochemical performance of DSSC.39
During TiO2 sensitizing it is expected that the hydroxyl groups of the dye bond to the semiconductor by the condensation of alcoholic bound protons, present in dye solution.29 In Figure 7, it is noted that all films have a broad and strong absorption in the visible region (510-600 nm), confirming the presence of anthocyanidins molecules.39 The plum cell showed better results of pigments concentration, due to the high intense absorbance band, resulting in a better adsorption capability of the dye on TiO2 surface, matching
the report of the j vs. V curves.32,42,43 It was obtained that all systems are not capable to absorb in infrared region (> 700 nm), which partially limits the device harvesting light, as shown by the CE method (Figure 3b).24
The electrochemical behavior of the natural dyes was investigated using cyclic voltammetry to evaluate the possibility of charge transfer from dyes to the TiO2 photoelectrode and the results are shown in Figure 8.44
The oxidation peak potential for the dyes extracted from Figure 6. Photovoltaic parameters obtained of the photocurrent density voltage curves for cells with TiO2 and natural dyes, being: (a) fill factor; (b) open-circuit potential; (c) short-open-circuit current; and (d) global efficiency of sunlight conversion.
Figure 7. UV-Vis absorption spectra of adsorbed plum, eggplant and hibiscus pigment on TiO2 films.
for the reference electrode Ag(s)/AgCl(s) (equation 6). Values of –4.89, –4.91, and –4.90 eV were found for plum, eggplant and hibiscus, respectively. The EGAP values were estimated using the UV-Vis spectra of Figure 7, as described in papers by Hosseinnezhad et al.45 and Crespilho et al.44 The potential values for the LUMO state (ELUMO) were calculated by subtraction of EHOMO with EGAP as discussed by Barea et al.46 The TiO
2 band gap energy was calculated by Kubelka-Munk method and described in another paper from the present authors.47
(6)
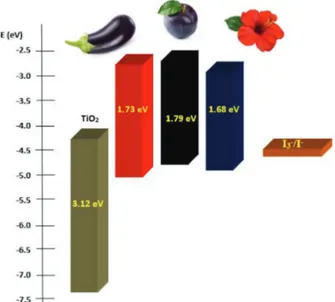
In Figure 9 is depicted the comparative view of the energy level to the dyes analyzed.
The electrons from the LUMO state could be ejected into the CB of the semiconductor if the LUMO level of the natural dye is sufficiently more positive when compared with the CB of TiO2.5,24 Figure 9 shows that all the analyzed dyes are shifted from the CB of TiO2, favoring the injection of electrons, providing high values of collection efficiency, as calculated using frequency domain techniques.48
The dyes showed EGAP values of 1.73 eV for eggplant, 1.79 eV for plum, and 1.68 eV for hibiscus, and these values are also close to those in the literature when acidified ethanolic solution was used to extract anthocyanidins.45,48
Kumara et al. and Gratzel et al. This result is equivalent to that obtained using the IMVS technique because the device produced with the plum dye presented a longer recombination time (τr = 0.51 s).
For eggplant dye, EHOMO is more negatively displaced, thus providing higher stability characteristics, which consequently favors the recombination of the electrons, as also shown by the time obtained via IMVS for the eggplant cell, τr = 0.18 s.50,51
Conclusions
The results show that the TiO2 cell sensitized with eggplant peel has more pronounced recombination reactions when compared with plum and hibiscus cells, as demonstrated by the frequency domain techniques.
All the systems analyzed present a great electron lifetime and collection time, however, the CE method indicates a low charge collection on photoanode, due to the anthocyanidin molecule absorb light until the visible range.
Dyes on TiO2 surface absorbed in a visible range, as demonstrated by UV spectra, with better adsorption of anthocyanidin in the plum cell.
Nyquist plots obtained by EIS measurements show the formation of one semicircle, characteristic of the charge transfer to the counter electrode. These results indicate a higher resistance in charge transfer to the cell sensitized with eggplant and a small resistance to the cell sensitized with plum.
The electrochemical results showed that the plum extract is capable of generating a TiO2 cell with less recombination with higher solar energy efficiency of 0.20%, with a Voc = 608 mV, FF = 0.61, jsc = 0.64 mA cm-2,
τr = 0.51 s, τc = 2.35 ms, ηc = 0.99, and Egap = 1.79 eV.
Acknowledgments
The authors are grateful to CNPq, CAPES, SETI/UGF and FINEP for supporting this study, and to Tatiane Valerio and Ketlyn Borth for UV-Vis analyses.
References
1. Blaszczyk, A.; Dyes Pigm. 2018, 149, 707.
2. Vitoreti, A. B. F.; Vaz, R.; Pena, A. L.; Raphael, E.; Ferrari, J. L.; Shiavon, M. A.; Rev. Virtual Quim. 2017, 9, 4.
3. O’Regan, B.; Gratzel, M.; Nature1991, 353, 737. Figure 9. Schematic diagram showing the estimated position of HOMO
4. Gratzel, M.; Nature2001, 414, 338.
5. Kumara, N. T. R. N.; Lim, A.; Lim, C. M.; Petra, M. I.; Ekanayake,
P.; Renewable Sustainable Energy Rev. 2017, 78, 301.
6. Thavasi, V.; Renugopalakrishnan, V.; Jose, R.; Ramakrishna, S.; Mater. Sci. Eng., R2009, 63, 81.
7. Longo, C.; Paoli, M. A.; J.Braz. Chem. Soc. 2003, 14, 889. 8. Li, L. L.; Chang, Y. C.; Wu, H. P.; Diau, E. W. G.; Int. Rev. Phys.
Chem. 2012, 31, 420.
9. Duffy, N. W.; Peter, L. M.; Rajapakse, R. M. G.; Wijayantha, K. G. U.; J. Phys. Chem. B2000, 104, 8916.
10. Tractz, G. T.; Maia, G. A. R.; Dias, B. V.; Ignachewski, F.; Rodrigues, P. R. P.; Quim. Nova2018, 41, 512.
11. Xiong, K.; Hou, L.; Wu, M.; Huo, Y.; Mo, W.; Yuan, Y.; Sun, S.; Xu, W.; Wang, E.; Sol. Energy Mater. Sol. Cells2015, 132, 252. 12. Tractz, G. T.; Maia, G. A. R.; Dias, B. V.; Banczek, E.;
Molinares, M. A.; Cunha, M. T.; Rodrigues, P. R. P.; Orbital: Electron. J. Chem. 2018, 10, 204.
13. Wongcharee, K.; Meeyoo, V.; Chavadej, S.; Sol. Energy Mater. Sol. Cells2007, 91, 566.
14. Kumara, N. T. R. N.; Ekanayake, P.; Lim, A.; Iskandar, M.; Ming, L. C.; Sol. Energy Mater. Sol. Cells2013, 135, 3. 15. Manhita, A.; Ferreira, T.; Candelas, A.; Dias, C. B.; Anal.
Bioanal. Chem.2011, 400, 1501.
16. Viomar, A.; Maia, G. A. R.; Scremin, F. R.; Khalil, N. M.; Cunha, M. T.; Antunes, A. C.; Rodrigues, P. R. P.; Rev. Virtual
Quim.2016, 8, 889.
17. Narayan, M. R.; Renewable Sustainable Energy Rev. 2012, 16, 208.
18. Lim, A.; Ekanayake, P.; Lim, L. B.; Bandara, J. M. R. S.;
Spectrochim. Acta, Part A2016, 167, 26.
19. Zhang, J.; Peng, W.; Chen, Z.; Chen, H.; Han, L.; J. Phys. Chem. C2012, 116, 19182.
20. Bailes, M.; Cameron, J.; Lobato, K.; Peter, L. M.; J. Phys. Chem. B2005, 109, 15429.
21. Boschloo, G.; Hagfeldt, A.; J. Phys. Chem. B2005, 109, 12093. 22. Kruger, J.; Plass, R.; Gratzel, M.; Cameron, P. J.; Peter, L. M.;
J. Phys. Chem. B2003, 107, 7536.
23. Tsekouras, G.; Myhashita, M.; Kho, Y. K.; Teoh, W. Y.; Mozer, A. J.; IEEE J. Sel. Top. Quantum Electron. 2010, 16, 6. 24. Hagfeldt, A.; Boschloo, G.; Sun, L.; Khloo, L.; Pettersson, H.;
Chem. Rev. 2010, 110, 6595.
25. Peter, L. M.; Duffy, N. W.; Wang, R. L.; Wijayantha, K. G. U.;
J. Electroanal. Chem. 2002, 524, 127.
26. Zheng, J. W.; Mo, L. E.; Chen, W. C.; Jiang, L.; Ding, Y. C.; Li, Z. Q.; Hu, L. H.; Dai, S. Y.; Electrochim. Acta2017, 232, 38. 27. Ghan, W.; Kang, H.; Sheikh, T.; Yadav, S.; Gil, T. C.; Nesbitt,
F.; Uddin, J.; Sci. Rep. 2016, 7, 41470.
28. Nissfolk, J.; Fredin, K.; Hagfeldt, A.; Boschloo, G.; J. Phys. Chem. Lett. 2006, 110, 17715.
29. Schlinchthorl, G.; Park, N. G.; Frank, A. J.; J. Phys. Chem. B
1999, 103, 782.
30. Reynal, A.; Forneli, A.; Palomares, E.; Energy Environ. Sci. 2010, 3, 805.
31. Guimaraes, R. R.; Parussulo, A. L. A.; Marias, T. A.; Toma, H. E.; Araki, K.; Electrochim. Acta2017, 255, 92.
32. Richhariya, G.; Kumar, A.; Opt. Mater.2018, 79, 296. 33. Çakar, S.; Ozacar, M.; Spectrochim. Acta, Part A2016, 163, 79. 34. Al-Alwani, M. A. M.; Mohamad, A. B.; Ludin, N. A.; Kadhum,
A. A. H.; Sopian, K.; Renewable Sustainable Energy Rev. 2016,
65, 183.
35. Sonai, G. G.; Melo, M. A.; Nunes, J. H. B.; Megiatto, J. D.; Nogueira, A. F.; Quim. Nova2015, 10, 1357.
36. Ocakoglu, K.; Yakuphanoglu, F.; Durrant, J. R.; Icli, S.; Sol.
Energy Mater. Sol. Cells 2008, 92, 1047.
37. Santana Andrade Jr., M. A.; Tiihonen, A.; Miettunen, K.; Lund, P.; Nogueira, A. F.; Pastore, H. O.; ACS Appl. Mater. Interfaces
2017, 9, 20454.
38. Mahalingam, S.; Andullah, H.; Renewable Sustainable Energy Rev. 2016, 63, 245.
39. Shalini, S.; Balasundaraprabhu, R.; Kumar, T. S.; Sivakumaran, K.; Kannan, M. D.; Opt. Mater.2018, 79, 210.
40. Tsai, J. K.; Hsu, W. D.; Wu, T. C.; Meen, T. H.; Chong, W. J.;
Nanoscale Res. Lett. 2013, 8, 459.
41. Calogero, G.; Di Marco, G.; Sol. Energy Mater. Sol. Cells2008,
92, 1341.
42. Tractz, G. T.; Maia, G. A. R.; Dias, B. V.; Banczek, E. P.; Cunha, M. T.; Rodrigues, P. R. P.; Rev. Virtual Quim. 2018, 10, 1074. 43. Heo, N.; Jun, Y.; Park, J. H.; Sci. Rep. 2013, 3, 1712. 44. Crespilho, F. N.; Zucolotto, V.; Siqueira Jr., J. R.; Carvalho, A.
J. F.; Nart, F. C.; Oliveira Jr., O. N.; Int. J. Electrochem. Sci. 2006, 1, 151.
45. Hosseinnezhad, M.; Gharanjig, K.; Moradian, S.; Saeb, M. R.;
Energy2017, 134, 864.
46. Barea, E. M.; Zafer, C.; Gultekin, B.; Aydin, B.; Koyuncu, S.; Icli, S.; Santiago, F. F.; Bisquert, J.; J. Phys. Chem. C2010,
114, 19840.
47. Dias, B. V.; Tractz, G. T.; Viomar, A.; Maia, G. A. R.; da Cunha, M. T.; Rodrigues, P. R. P.; J. Electron. Mater. 2018, 47, 9. 48. Kumara, N. T. R. N.; Ekanayake, P.; Lim, A.; Iskandar, M.; Ming,
L. C.; J. Sol. Energy Eng. 2013, 135, DOI: 10.1115/1.4023877. 49. G r a t z e l , M . ; D u r r a n t , J . R . ; N a n o s t r u c t u re a n d
Photoelectrochemical Systems for Solar Photon Conversion,
1st ed.; Imperial College Press: London, 2008.
50. Latif, M. S. A.; Batniji, A.; Agez, T. M.; Younis, M. J.; Ghamri, H.; Thaher, B, A. A.; Qeshta, B. S.; Awwad, F. M. A.; Taya, S.
A.; J. Nano- Electron. Phys.2016, 8, 4.
51. Wu, T. Y.; Tsao, M. H.; Chen, F. L.; Su, S. G.; Chang, C. W.; Wang, H. P.; Lin, Y. C.; Yang, W. C. O.; Sun, I. W.; Int. J. Mol. Sci.2010, 11, 329.
Submitted: July 17, 2018
Published online: September 21, 2018