Effects of Potential Deposition on the Parameters of ZnO dye-sensitized Solar Cells
Vanja Fontenele Nunesa* , Antonio Paulo Santos Souzab , Francisco Limab, Gessé Oliveiraa, Francisco Nivaldo Freirea, Ana Fabíola Almeidaa
Received: November 06, 2017; Revised: April 09, 2018; Accepted: May 06, 2018
Dye-sensitized solar cells (DSSCs) are a feasible option for photovoltaic energy. Zinc oxide is
an n-type semiconductor employed as photoanode on DSSCs. ZnO thin films were electrodeposited to study the effects of different potentials applied during deposition. SEM images, XRD and UV-Vis analysis were conducted to reveal the morphologic, structural and optical properties of the films at three potentials. DSSCs were assembled and the photovoltaic parameters were obtained through J-V plots. DSSC with 0.031% of efficiency was demonstrated at -1.4 V of deposition potential.
Keywords: Zinc Oxide, DSSC, Electrodeposition.
*e-mail: [email protected]
1. Introduction
Dye-sensitized solar cells are an alternative to the use of the conventional Si based solar cells due to advantages such
as low production cost and relatively high-energy conversion efficiency1. This photo electrochemical conversion can be
explained by the light harvesting of the dye molecules found on a typical DSSC2. In addition, by using dye, DSSCs can be
colored or transparent, which increases the commercial use on locations where the appearance of the cell is important,
like sunroofs and automobile panels2. Overall, a DSSC is
composed by a photoanode, an oxide layer for electronic conduction, a monolayer of charge transfer dye, a redox electrolyte, usually an organic solvent that restores the dye by electron donation, and a counter electrode3.
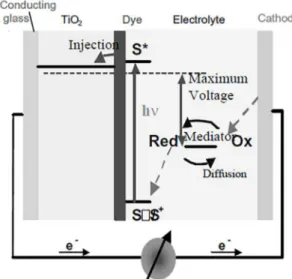
In a DSSC, the photo-excited dye oxidizes the mediator, the redox electrolyte, and is oxidized by the photoanode. The electrons circulate through the external circuit and, at the cathode; the electrolyte is regenerated by reduction2.
Figure 1, adapted from Grätzel (2003), exemplifies the working principle of a DSSC, using titanate as photoanode3.
The photoanode plays an important role in the conversion of light into electrical energy4. Among some of the metal oxides used as photoanodes, it can be listed TiO2, ZnO, SnO2, Nb2O5, SrTiO3, Fe2O3, WO3 and Ta2O5. Between them, zinc oxide has many properties than can be used in a DSSC, such
as high electron mobility of 115-155 cm2 V-1 s-1, stability
against photocorrosion, large excitation binding energy
(60 eV) and band gap near the one of the TiO2 (~3.2 eV) 5.
Besides, ZnO is found at low-cost and in many forms, like nanorods, nanowires and nanosheets6.
In a DSSC, the photoanode is deposited in a conductive glass. ZnO can be deposited by many methods, such as chemical vapor deposition, hydrothermal synthesis, spray
pyrolysis, pulsed laser deposition and electrodeposition6.
Electrochemical deposition (ECD) can fabricate thin layers with specific morphology, high orientation degree and good adhesion to the substrate, besides being cost-effective to the preparation of large area thin ZnO films7.
Previous works investigated the electrodeposition of ZnO thin films and its properties, such as uniformity. Illy et
al. (2011) varied the time of deposition, the concentration of the nitrate solution and the potential deposited to verify the
changes obtained on the ZnO film structure8. It was observed
that at higher concentrations of the precursor solution, high
temperature and low potentials, the film formed is more
continuous8. Ismail et al. (2017) also studied the effects of
the deposition parameters on the film characteristics, when
increasing the applied potential the charge transfer resistance aDepartamento de Engenharia Mecânica, Universidade Federal do Ceará, Fortaleza, CE, Brasil
bDepartamento de Engenharia e Ciência dos Materiais, Universidade Federal do Ceará, Fortaleza, CE, Brasil
of the zinc oxide films decreased9. Ahmed et al. (2015)
also electrodeposited ZnO at high potentials, varying the
duration of the ECD and using n-Si wafers, adding KNO3
in the precursor solution7. In addition, publications reveal
studies to improve the efficiency of solar cells, using the
zinc oxide as photoanode. Marimuthu et al. (2017) reached
efficiency of 3.75%, Ren et al. (2015) made cells with 9.67% efficiency, Lima et al. (2015) obtained power conversion efficiency of 2.27% and Zi et al. (2014) tested ZnO at different morphologies, with results varying from 0.018 to 0.320% of efficiency4,10,11,12. Futhermore, Canto-Aguilar et al. (2017) electrodeposited ZnO mesoporous nanostructures to apply
as semiconductor in DSSCs, reaching efficiency values of 0.66 ± 0.03%, using I-/I
3- as electrolyte and Marimuthu et al. (2018) also electrodeposited ZnO structures, this time
as nanorods, with its respective DSSC presenting 1.76% of efficiency and 0.37 of fill factor10,13.
In this work, three dye solar cells were assembled using ZnO electrodeposited at three different potentials to observe the effect these changes had on the conversion efficiency of the cells, besides the effects on the morphology, optical and structural ZnO film characteristics. The electrodepositions were carried out at a low temperature, below the usually tested temperatures, without any catalyst or additive, a simple aqueous zinc nitrate solution, on fluoride doped tin oxide layer synthesized in laboratory and used as the working electrode in the ECD process.
2. Experimental
Fluorine doped tin oxide (SnO:F2) was deposited by spray pyrolysis on blades for microscopy, adapted from
the method described by Lima et al. (2015), without adding acid, to create a conductive coat of fluorine doped tin oxide
(FTO) on the glass surfaces14. The furnace temperature during
the pyrolysis operated at 600 ºC. Tin chloride II (NEON) (99.3%) and ammonium fluoride (Sigma-Aldrich) (98%) were the source materials for the FTO deposition.
The electrodeposition consisted of a three-electrode
system, where the working electrode was the FTO coated glass (surface resistivity between 20-30 Ω/sqr), the counter electrode was a platinum sheet and Ag/AgCl (3 M) was the
reference. An aqueous solution of zinc hexahydrate (Dinâmica
Ltda.) at concentration of 0.2 M, kept at constant temperature of 67ºC, was the bath electrolyte for the electrochemical deposition. Before deposition, all FTO blades were cleaned on ultrasonically bath with deionized water (10 minutes)
and acetone (Qhemis) (20 minutes). The potentials tested
during the electrodeposition were -1.0 (Film A), -1.2 (Film B) and -1.4 V (Film C), on three different FTO blades. Each potential was applied for 30 minutes. The changes were made to observe the effect on the morphology and optical characteristics on the ZnO film. In addition, to verify if the different potentials could alter the performance of the dye
sensitized solar cells. This zinc oxide electrodeposition
system is similar to the one used by Lima et al. (2015), but, in this study, the concentration of the precursor solution was fixed, the applied potentials were high and varied and the temperature was fixed at 67ºC12.
Each one of the photoanode ZnO films were immersed in an ethyl alcohol (0.0003 M) N719 (Solaronix) dye solution for 24 h. Then, three face-to-face cells were assembled, using platinum (Pt) as the counter electrode (CE), due to being a stable and transparent counter electrode with high electrocatalytic activity towards I- reduction. Also, a Pt CE
improves the light harvesting efficiency due to its reflective
property15. The dye-adsorbed ZnO films was the photoanode
and, between them, the Iodolyte AN-50 (Solaronix) acted as
the electrolyte. The assembled cell, therefore, is similar to a Grätzel cell, replacing the titanate semiconductor by the zin oxide semiconductor3.
All the ZnO film samples were structurally characterized through X-ray diffraction. XRD analyses were carried out on a Bruker D8 Advance, using CuKα1 (λ = 0,154 nm) as radiation source.The scattering angle was in the 20º- 70º range, operated at 40 kV. The optic measurements were performedin a Cary 100 UV-Vis Spectrophotometer at room temperature with wavelength range of 190-900 nm. The scanning electron microscopy (SEM), using a Quanta 450 FEG-FEI, examined the surface morphology of the films, besides the thickness of each ZnO film. The same equipment realized energy dispersive spectroscopy for the SEM images.
The current-voltage (J-V) data was obtained under
illumination of 100 mW cm-2, light source of Led
white-neutral. The electrical parameters were calculated using model proposed by Li et al16.
3. Results and Discussions
3.1 Electrodeposition process
The reactions which took place during the ECD and
are responsible for the formation of the ZnO thin films are
generally described by reactions 1, 2 and 317. Reaction (1)
describes the reduction of NO3- at the working electrode
in Zn2+ aqueous solution, then, those Zn2+ react with
the OH- íons formed in the reductionreaction, resulting
in zinc hydroxide (Reaction 2). The Zn(OH)2 suffers dehydration, and consequently, it occurs the chemical
precipitation of ZnO (Reaction 3)17. The hydroxylation
and the dehydration control the rate of the overall reaction and are affected, mainly, by the temperature, Zn(NO3)2.6H2O concentration and the applied potential in the electrodeposition17. As the temperature and
concentration were kept constant for the three films, in
this study, the differences on the reaction rate and, by
consequence, the morphology of the films were affected
(1)
(2)
(3)
3.2 X-ray diffraction
Fig. 2 shows the XRD patterns of the ZnO films at the different potentials. All the peaks were observed at (100), (002) and (101), which is in accordance with the hexagonal ZnO wurtzite
structure10. The slight increase in the intensity of the (002) peak
in all the three patterns indicates, as observed by Marimuthu et
al. (2017), that the nanocrystals grow in a preferential or along
the c-axis to the surface of the substrate, in this case FTO10. NO3+H O2 +2e "NO2+20H
- - -
-( )
Zn2++20H-"Zn OH 2
( )
Zn OH 2"ZnO+H O2
Figure 2. XRD patterns of the three deposited potentials
3.3 Morphology
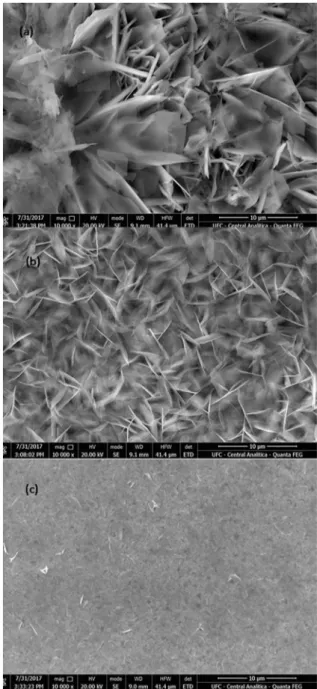
SEM images (Fig. 2) illustrate the effects on the morphology
structure caused by the changes on the applied potentials. The
presence of porous on the structures differs from -1.0 to -1.4 V. Films A and B present porous between the nanostructures, while, at film C, those same porous are not seen as regularly and the ZnO is more nodular, which can be explained by the higher
deposition potential18. Mahalingam et al. (2005) reports that those
nodular structures are characteristic of the ZnO growth19. The ZnO
nanosheets in films A and B can be attributed to the concentration
of Zn+2 in solution, as observed by Yang et al20.When increasing
the potential, those nanosheets are no longer noticed.
Since the precursor solution was Zn(NO3)2.6H2O, the source of Zn2+ and OH- was the zinc nitrate. At first, the Zn2+ moves to
the FTO-coated cathode, induced by the electrical field, which
causes the increase of the OH- concentration and the formation
of Zn(OH)221. Then, the conversion of Zn(OH)
2 to zinc nitrate,
at 67ºC, stimulates nucleation centers of ZnO, specially at the
(002) direction, which indicates the low energy barrier imposed
at this orientation21.The same behavior was observed by Meng
et al., (2014)21. The cathodic potential controls the nucleation
during the deposition process, once all the other parameters
were kept constant. At relatively low potentials (Films A and B) the nitrate reduction occurred slowly and not enough
OH- is formed, in consequence, more random and less dense
ZnO nuclei are formed (Figure 3 (a) and (b)). When the -1.4 V potential was applied, the reduction of NO3- and the ZnO
nucleation happened at an increased rate, leading to a more
dense formation ( Figure 3(c)). At higher potentials, Film C, the zinc oxide growth faces lower energy barriers, leading to high deposition rates, and more dense and packed ZnO film7.
Figure 3. Morphology structures for the three thin ZnO films
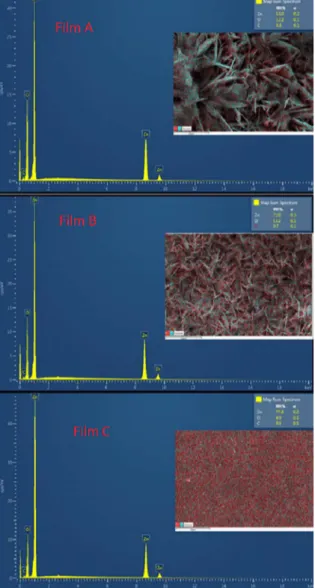
Entire areas of the SEM for the three samples were scanned, generating the images in Fig. 4 (inserted) and Energy dispersive spectroscopy produced the spectrums (Fig.4). These EDS analysis allowed to determine the relative proportions (Wt%) of the elements found on a specific area, through characteristic X-rays. The ratio between the zinc and oxygen proportions was 5.16 (film A), 6.42 (film B) and 7.86 (film C), which indicates
higher proportion of zinc comparatively to oxygen. The higher
element ration in film C is an indication of the increased rate of
reduction of nitrate and nucleation of ZnO by the electrodeposition at a high potential. The increase of the absolute value of the potential causes the formation of more dense and packed particles17. The spectrums confirmed the presence of atoms of
zinc (Zn) and oxygen (O). For the sample C, there was a higher proportion of the Zn atoms, with 77.8%, and a higher number
of x-ray counts for the zinc atoms. The presence of the Zn and
O elemental peaks at the spectrums confirms the formation of
zinc oxide (ZnO) in the electrodeposited samples22.
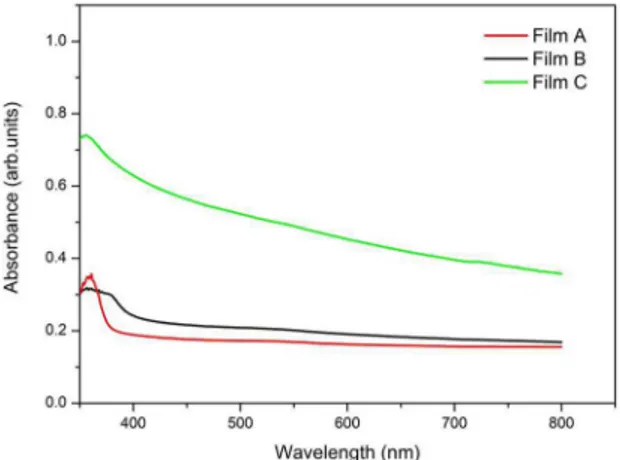
3.4 Optical characterization
The ZnO nanostructures optical properties were
determined by absorbance measurements in the range of
190-900 nm at room temperature. FTO/glass was used
before each measurement, as reference, to subtract the
effects of the fluorine tin oxide and the glass23. The ZnO thin films exhibited higher absorbance values at short wavelength (Fig. 5), reaching lower values at the IR region24. The obtained absorbance peaks were at wavelength less than 380 nm, same as Yang et al20. Yang et al. suggests
those peaks are due to the electronic transitions from the valence band to the conduction band of the ZnO band gap20.
Figure 4. EDS data and spectrum for ZnO thin films A, B and C
Figure 5. Normalized Absorbance plots for the three ZnO films
Band gap energy (Eg) was calculated for the three thin films A, B and C. The Tauc equation used to estimate the Eg values was described by Tauc (1974)25:
(4)
Where, A is proportionality constant, hv the incident
photon energy and α is the absorption coefficient. The value
of ½ is applied due to the direct transition characteristic
of the ZnO material. The Eg value was obtained by the
extrapolation of the plot of (αhv)2 as function of the incident
energy hv (Fig. 6)26. The band gap values were between
3.05 and 3.32 eV, as described in table 1. All the Eg values were below the standard 3.37 eV report in the literature27.
The lowest potential applied in the ECD deposited the film with the highest band gap energy, while the minimum value for the band gap was obtained for the sample C. As
the energy bad gap values decrease, there is a shift in the direction of the visible region of the spectrum (Fig.5).
( )
The higher potential applied in the ECD deposited the thinner ZnO film. According to Sielmann et al., this effect on the film thickness is a result of the Zn+2 depletion, at
high potentials, with formation of H+ ions at the counter
electrode28. These H+ ions decrease the overall pH of the
solution, which inhibits the film growth.
3.5 Photovoltaic performance
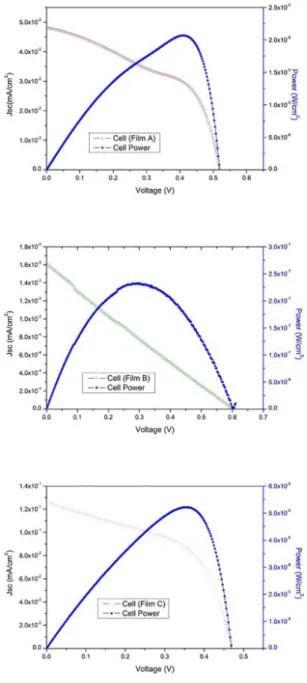
The photovoltaic performances of the three dye cells
were compared. Figure 7 reports the photocurrent density-voltage (J-V) plots under the 100 mW/cm2 illumination. The
photocurrent parameters are listed in table 2.
The efficiency (η) was calculated through the following
equation5:
(5)
Where Voc is the open-circuit voltage, Jsc is the short-circuit current density, FF is the fill factor and Pinc the incident light power5.
The thicker ZnO photoanode yielded an overall efficiency of 0.00023% and Jsc of 0.0016 mA/cm2, while the thinner one
had 0.031% performance efficiency. These results indicate that larger amounts of N719 dye molecules were adsorbed
on the thinner nanosheets (Figure 8), providing a higher
Figure 6. Extrapolation of the Tauc plots to determine bang gap values
Table 1. Band gap values and film thickness.
Potential applied
(V) Band gap energy value (eV) Thickness (nm)
Film A 3.32 619.86
Film B 3.25 650.54
Film C 3.05 551.75
Figure 7. J-V measurements for the three dye cells (a) Sample A
(b) Sample B (c) Sample C
Table 2. Photovoltaic parameters for the ZnO based DSSC.
Cell Rsh (kΩ/cm2) Rs (kΩ/cm2) Jsc (mA/cm2) Voc (V) η (%) FF Pmax (W/cm2)
A 31.55 1.38 0.048 0.52 0.012 0.486 1.22 x 10⁻⁵
B 340.5 666.3 0.0016 0.603 0.000283 0.24 2.32 x 10⁻⁷
C 8.862 0.586 0.13 0.47 0.031 0.52 3.07 x 10⁻⁵
photocurrent density of 0.13mA/cm2.29 Figure 8 shows that
the film C, sensitized by the N719 dye, presented higher absorption than A and B thin films, with a peak at 350 nm,
approximately. This leaded to more photogenerated charge carriers and, by consequence, higher short-circuit current density30. All three films absorbed mainly in the ultraviolet
spectrum, from 300 to 400 nm, with much lower absorptions
in the visible regions31. The higher Jsc was the parameter
Pinc Voc x jcs x FF
that contributed to enhance the photovoltaic performance30.
The photocurrent density of the film C was 80.25% higher
than the Jsc of the nanosheet B. In addition, the larger
thickness, 650.54 nm, film B, increased the defects inside the film, causing a greater series resistance, which dropped the overall FF value from 0.52 to 0.248. When the Rs is high,
there is a voltage drop across the cell and more resistance to the electron transfer process 4. The increase of the FF value indicates, in the cell C, a reduction of charge recombination
between the ZnO photoanode and the electrolyte I-/I
-332.
it is still necessary to research for better conditions for the ZnO/dye pair that should avoid the creation of ZnO/
sensitizer aggregations, which lead to the increase of
charge recombination at the photoanode interface and the deterioration of the DSSC performance36.
In short, the cells lost efficiency especially due to low
light harvesting and high electron recombination.
Although the cells with zin oxide acting as the only photoanode did not yield high efficiency, ZnO can be employed in combination with different photoanodes to improve light scattering and electron
injection 37. Niaki et al. (2014) designed a double-layer TiO2 solar
cell doped with ZnO, obtaining 6.58% of power conversion efficiency at 0.5% ZnO doped dioxide titanium 37. Mozaffari et al. (2015) electrodeposited ZnO nanostructures amongst TiO2
nanoparticles with a 22% enhancement of the short-circuit current density and 63% increase of electron lifetime38. Kouhestanian et al. (2016) also increased short-circuit current from 9.75 mA/cm2
(pure TiO2) to 10.24 mA/cm2 (0.001 M ZnO doped TiO 2)
39. Reddy
et al. (2018) synthetized a combination of CdO/ZnO reduzing the electron-hole pair recombination and decreasing the band
gap value to 2.97 eV from 3.21 eV (pure ZnO)40.
The present work can contribute to improve the ECD
of zinc oxide, changing the electrodeposition parameters,
to be employed in combination with dioxide titanium or a different semiconductor as a dye-sensitized solar cell
photoanaode, to increase the cell photovoltaic parameters such as short-circuit current density.
4. Conclusion
ZnO photoanodes were synthesized through electrodeposition at the potentials of -1.0 V (film A), -1.2 V (film B) and -1.4 V (film C). Nanosheets and nodular structures were obtained by changing the potential. Later, these ZnO films were used to assemble three dye-sensitized solar cells. The film with better performance as a photoanode was the nodular structure formed in C. UV-Vis analyses revealed, for the nodular film C, an
absorbance shift in the visible region of the spectrum. Also, at
this potential, more dye was absorbed by the film, which was indicated by the 0.13 mA/cm2 short-circuit current density.
This parameter helped to increase the overall efficiency of
the dye cell. In addition, the nodular nanostructures presented
the lower series resistance, which reduced the resistance
to the electron transport from the photoanode through the
conductive glass. This lower series resistance can be attributed to the thinner film thickness, which decreased with the more
cathodic potential applied. The other photovoltaic parameters
were shunt resistance, efficiency, fill factor and open-circuit voltage. The cell with zinc oxide electrochemically deposited at -1.4 V provided the best result of efficiency at 0.031% and fill factor of 0.52. All the nanostructures were applied as semiconductor without previous treatment of any kind to investigate the influence of the electrodeposition method on the efficiency of dye-sensitized solar cells.
Figure 8. Absorbance analysis of the deposited ZnO thin films
The recombination loss in ZnO based dye solar cells is caused mostly by uncovered oxide surface32. These uncovered
areas were not reached by the dye and had closer proximity
to the electrolyte surface, increasing the recombination
between the electron on the conduction band of the ZnO
and the holes in the electrolyte32.
The overall low efficiency of the dye cells A and B can
also be explained by the Zn2+/dye agglomerations. Theses
accumulations prevent the electron injection from the dye to the conduction band of the semiconductor, causing decrease on
the light to current conversion efficiency33. This can be avoided by changing the dye concentration or the sensitization time.
The overall efficiency of the ZnO based DSSCs was low,
compared to a standard TiO2 cell. Tasic et al. (2016) obtained
an efficiency of 4.92% for thermally treated titanium oxide
dye cells34. The low efficiency reported in this paper can be
explained by the lower stability of zinc oxide on acidic dye
environments35. Furthermore, the semiconductor zinc oxide
films were not thermally treated, since the aim of this study is to investigate the influence of the deposition potentials applied, the only varied constant between the cells.
To overcome the zinc instability on acid, different dyes have been tested with ZnO, such as Z907 and N3, but these dyes also present limitations, such as small areas for the J-V
curves31. Chang et al. (2015) used organic sensitizer W3
with zinc oxide, but obtained 24.7 % decrease of efficiency
5. Acknowledgments
The authors would like to acknowledge the Brazilian
research agency Coordenação de Aperfeiçoamento de
Pessoal de Nível Superior-Capes for the financial support, the Laboratório de Filmes Finos e Energias Renováveis- LAFFER for the assistance throughout the research and, also, the Analytical Central-UFC/CT-INFRA/MCTI-SISNANO/ Pró-Equipamentos CAPES.
6. References
1. Wang D, Zhu X, Fang Y, Sun J, Zhang C, Zhang X. Simultaneously
composition and interface control for ZnO-based dye-sensitized
solar cells with highly enhanced efficiency. Nano-Structures & Nano-Objects. 2017;10:1-8.
2. Sharma S, Siwach B, Ghoshal SK, Mohan D. Dye sensitized
solar cells: From genesis to recent drifts. Renewable and Sustainable Energy Reviews. 2017;70:529-537.
3. Grätzel M. Dye-sensitized solar cells. Journal of Photochemistry and Photobiology C: Photochemistry Reviews. 2003;4(2):145-153.
4. Zi M, Zhu M, Chen L, Wei H, Yang X, Cao B. ZnO photoanodes with different morphologies grown by electrochemical deposition
and their dye-sensitized solar cell properties. Ceramics International. 2014;40(6):7965-7970.
5. Vittal R, Ho KC. Zinc oxide based dye-sensitized solar cells: A review. Renewable and Sustainable Energy Reviews.
2017;70:920-935.
6. Kicir N, Tüken T, Erken O, Gumus C, Ufuktepe Y. Nanostructured ZnO films in forms of rod, plate and flower: Electrodeposition
mechanisms and characterization. Applied Surface Science.
2016;377:191-199.
7. Ahmed NA, Hammache H, Makhloufi L, Eyraud M, Sam S, Keffous A, et al. Effect of electrodeposition duration on the morphological and structural modification of the flower-like
nanostructured ZnO. Vacuum. 2015;120(Pt B):100-106.
8. Illy BN, Cruickshank AC, Schumann S, Da Campo R, Jones TS,
Heutz S, et al. Electrodeposition of ZnO layers for photovoltaic applications: controlling film thickness and orientation. Journal of Materials Chemistry. 2011;21(34):12949-12957.
9. Ismail AH, Abdullah AH, Sulaiman Y. Physical and electrochemical
properties of ZnO films fabricated from highly cathodic
electrodeposition potentials. Superlattices and Microstructures.
2017;103:171-179.
10. Marimuthu T, Anandhan N, Thangamuthu R, Surya S. Facile
growth of ZnO nanowire arrays and nanoneedle arrays with flower structure on ZnO-TiO2 seed layer for DSSC applications. Journal of Alloys and Compounds. 2017;693:1011-1019.
11. Ren X, Zi W, Ma Q, Xiao F, Gao F, Hu S, et al. Topology and texture controlled ZnO thin film electrodeposition for superior solar cell efficiency. Solar Energy Materials and Solar Cells. 2015;134:54-59.
12. Lima FAS, Vasconcelos IF, Lira-Cantu M. Electrochemically synthesized mesoporous thin films of ZnO for highly efficient dye
sensitized solar cells. Ceramics International. 2015;41(8):9314-9320.
13. Canto-Aguilar EJ, Rodríguez-Pérez M, García-Rodríguez R, Lizama-Tzec FI, Denko ATD, Osterloh FE, et al. ZnO-based dye-sensitized solar cells: Effects of redox couple and dye
aggregation. Electrochimica Acta. 2017;258:396-404.
14. Lima FM, Souza JHA, Maia Junior PHF, Silva ANA, De Sena AC, Freire FNA, et al. Fluorine-doped tin oxide films by spray pyrolysis using vacuum within nozzle. Revista Brasileira de Aplicações do Vácuo. 2015;34(3):94-97.
15. Thomas S, Deepak TG, Anjusree TS, Arun TA, Nair SV, Nair AS. A review on counter electrode materials in dye-sensitized solar
cells. Journal of Materials Chemistry A. 2014;2(13):4474-4490.
16. Li G, Shrotriya V, Huang J, Yao Y, Moriarty T, Emery K, et al. High-efficiency solution processable polymer photovoltaic
cells by self-organization of polymer blends. Nature Materials.
2005;4:864-868.
17. Lv J, Sun Y, Zhao M, Cao L, Xu J, He G, et al. Rectifying properties of ZnO thin films deposited on FTO by electrodeposition
technique. Applied Surface Science. 2016;366:348-352.
18. Li J, Liu Z, Lei E, Zhu Z. Effects of potential and temperature on the electrodeposited porous zinc oxide films. Journal of Wuhan University of Technology-Mater. Sci. Ed. 2011;26(1):47-51.
19. Mahalingam T, John VS, Raja M, Su YK, Sebastian PJ. Electrodeposition and characterization of transparent ZnO thin films. Solar Energy Materials and Solar Cells.
2005;88(2):227-235.
20. Yang J, Wang Y, Kong J, Jia H, Wang Z. Synthesis of ZnO
nanosheets via electrodeposition method and their optical
properties, growth mechanism. Optical Materials.
2015;46:179-185.
21. Meng Y, Lin Y, Lin Y. Electrodeposition for the synthesis of ZnO nanorods modified by surface attachment with ZnO
nanoparticles and their dye-sensitized solar cell applications.
Ceramics International. 2014;40(1 Pt B):1693-1698.
22. Hitkari G, Singh S, Pandey G. Structural, optical and photocatalytic study of ZnO and ZnO-ZnS synthesized by chemical method.
Nano-Structures & Nano-Objects. 2017;12:1-9.
23. Özdal T, Taktakoglu R, Özdamar H, Esen M, Takçi DK, Kavak
H. Crystallinity improvement of ZnO nanorods by optimization
of low-cost electrodeposition technique. Thin Solid Films.
2015;592(Pt A):143-149.
24. Madlol RAA. Structural and optical properties of ZnO nanotube
synthesis via novel method. Results in Physics.
2017;7:1498-1503.
25. Tauc J, ed. Amorphous and Liquid Semiconductors. New York:
Springer; 1974.
26. Kadem B, Banimuslem HA, Hassan A. Modification of morphological and optical properties of ZnO thin film. Karbala International Journal of Modern Science. 2017;3(2):103-110.
27. Zhang M, Xu K, Jiang X, Yang L, He G, Song X, et al. Effect
of methanol ratio in mixed solvents on optical properties and
wettability of ZnO films by cathodic electrodeposition. Journal of Alloys and Compounds. 2014;615:327-332.
28. Sielmann C, Walus K, Stoeber B. Zinc exhaustion in ZnO
29. De Marco L, Calestani D, Qualtieri A, Giannuzzi A, Manca
M, Ferro P, et al. Single crystal mesoporous ZnO platelets as
efficient photoanodes for sensitized solar cells. Solar Energy Materials and Solar Cells. 2017;168:227-233.
30. Chen X, Tang Y, Liu W. Efficient Dye-Sensitized Solar Cells Based on Nanoflower-like ZnO Photoelectrode. Molecules.
2017;22(8):1284.
31. Rahman MYA, Umar AA, Taslim R, Salleh MM. Effect of
organic dye, the concentration and dipping time of the organic dye N719 on the photovoltaic performance of dye-sensitized ZnO solar cell prepared by ammonia-assisted hydrolysis technique. Electrochimica Acta. 2013;88:639-643.
32. Jiang CY, Sun XW, Lo GK, Kwong DL, Wang XJ. Improved dye-sensitized solar cells with a ZnO-nano flower photoanode.
Applied Physics Letters. 2007;90(26):263501.
33. Keis K, Lindgren J, Lindquist SE, Hagfeldt A. Studies of the
Adsorption Process of Ru Complexes in Nanoporous ZnO
Electrodes. Langmuir. 2000;16(10):4688-4694.
34. Ahmad MS, Pandey AK, Rahim NA. Advancements in
the development of TiO2 photoanodes and its fabrication methods for dye sensitized solar cell (DSSC) applications.
A review. Renewable and Sustainable Energy Reviews. 2017;77:89-108.
35. Chang SM, Lin CL, Chen YJ, Wang HC, Chang WC, Lin LY.
Improved photovoltaic performances of dye-sensitized solar cells
with ZnO films co-sensitized by metal-free organic sensitizer
and N719 dye. Organic Electronics. 2015;25:254-260.
36. Tasić N, Stanojević ZM, Branković Z, Laĉnjevac U, Ribić V, Žunić M, et al. Mesoporous films prepared from synthesized
TiO2 nanoparticles and their application in dye-sensitized solar cells (DSSCs). Electrochimica Acta. 2016;210:606-614.
37. Niaki AHG, Bakhshayesh AM, Mohammadi MR. Double-layer
dye-sensitized solar cells based on Zn-doped TiO2 transparent and light scattering layers: Improving electron injection and
light scattering effect. Solar Energy. 2014;103:210-222.
38. Mozaffari SA, Ranjbar M, Kouhestanian E, Amoli HS, Armanmehr MH. An investigation on the effect of electro deposited nanostructured ZnO on the electron transfer process efficiency of TiO2 based DSSC. Materials Science in Semiconductor Processing. 2015;40:285-292.
39. Kouhestanian E, Mozaffari SA, Ranjbar M, SalarAmoli H, Armanmehr MH. Electrodeposited ZnO thin film as an efficient alternative
blocking layer for TiCl4 pre-treatment in TiO2-based dye sensitized solar cells. Superllatices and Microstructures. 2016;96:85-94.
40. Reddy CV, Babu B, Shim J. Synthesis, optical properties and efficient photocatalytic activity of CdO/ZnO hybrid nanocomposite.