Inês Sofia Duarte Flores
Licenciatura em Bioquímica
Iron storage and regulation
at a molecular level
Dissertação para obtenção do Grau de Mestre em Bioquímica
Orientador: Prof. Doutor Pedro António de Brito Tavares,
Professor Auxiliar, FCT-UNL
Co-orientador: Prof. Doutora Maria Alice Santos Pereira,
Professor Auxiliar, FCT-UNL
Júri:
Presidente: Prof. Doutor Ricardo Ramos Franco Tavares Arguente(s): Prof. Doutora Maria Cristina de Oliveira Costa
Inês Sofia Duarte Flores
Licenciatura em Bioquímica
Iron storage and regulation
at a molecular level
Dissertação para obtenção do Grau de Mestre em Bioquímica
Orientador: Prof. Doutor Pedro António de Brito Tavares,
Professor Auxiliar, FCT-UNL
Co-orientador: Prof. Doutor Maria Alice Santos Pereira,
Professor Auxiliar, FCT-UNL
III Iron storage and regulation at a molecular level
Copyright © Inês Sofia Duarte Flores, Faculdade de Ciências e Tecnologia, Universidade Nova de Lisboa.
V
Agradecimentos
São vários os agradecimentos e não existem palavras suficientes que consigam mostrar o papel importante de todas as pessoas, que foram e são importantes na minha vida pessoal e consequentemente profissional.
Agradeço a todos os que contribuiram para a minha formação e para o desenvolvimento das minhas capacidades profissionais, desde os professores até colegas. Um obrigada especial ao Doutor Pedro Tavares e à Doutora Alice Pereira, que para além de terem sido meus professores foram também meus orientadores, antes e durante esta dissertação. Obrigada por realmente me orientarem neste precurso profissional, pela oportunidade, por acreditaram nas minhas capacidades e por todo o tempo e esforços gastos.
Porque sou alguém de fé agradeço a Deus por realmente tudo, porque tu me susténs. Agradeço à minha familia, especialmente aos meus Pais, ao meu irmão e aos meus avós, que tantos sacrifícios fizeram para que eu pudesse seguir o meu sonho.
Agradeço ao meu noivo Ismael Marques que tanto suportou e sacrificou sem nunca se queixar. Por estares sempre comigo para o quer que seja, nos bons e maus momentos.
Também aos meus colegas, que acima de tudo são meus amigos (Inês Almeida, João Silva, Ana Diniz, Mariana Oliveira e Aline Viensiscki). Partilhamos não só uma profissão mas também uma grande amizade.
Agradeço aos meus amigos que em todas as alturas, mesmo quando eu não posso dar tanta atenção quanto merecem, sempre se preocupam comigo. Obrigada Nádia e Isaac Marques, Raquel e Gonçalo Paiva, Sara e Tiago Falcoeiras, Susana Calado, Miguel Rodrigues, Silvia Biscaia, Sofia Alberto, João e Andy Vieira, Cláudia Vieira, Jónatas e Sónia Luzia e Lucía Rodriguez.
Sem nunca esquecer, também um agradecimento especial à equipa do Laboratório de Biofísica Molecular, que me ajudaram e partilharam o seu conhecimento (Doutora Cristina Timóteo, Doutor Filipe Folgosa, Doutora Cristina Cordas, Daniela Penas, Alexandra Loupas e Nídia Almeida).
Mais uma vez repito, estas palavras não são suficientes para traduzir a dimensão do meu agradecimento.
VII
Abstract
Iron is an essential element for the proper functioning of the metabolic network in a living system. However, it is also toxic in physiological conditions. Apart from precipitation it can damage and compromise cellular macromolecules by Fenton reactions. Thus, ferritins, hollow spherical proteins, comes to solve this problem by storing iron in its inner cavity. Dps (DNA-binding protein in starved cells), focused in this study, has a detoxifying function, protecting DNA from ROS.
The reaction catalyzed by ferritins can be divided in the following stages: iron intake, oxidation, storage and release. The latter is the least explored and known function of this protein.
The M. hydrocarbonoclasticus WrbA flavoprotein, present in the same genome, was
used as a P. nauticas Dps redox partner, to reduced and release iron from the iron core.
Mössbauer spectroscopy was used to investigate the kinetics properties of WrbA(FMN):NADH:Dps in anaerobic conditions. To determine kinetic parameters it was needed to acquire spectra for different reaction times. The iron release for wild-type, Q14E and Δ15 Dps variants follow a first-order kinetic, with rate constants very similar.
Was also explored a more inexpensive and faster kinetic assay based on the o
-phenanthroline method, monitored by Visible spectroscopy. The result showed that the three Dps variants have no significant difference regarding the kinetic profile obtained, but rate constants were significantly lower than those obtained by Mössbauer spectroscopy probed kinetic measurements. Phenanthroline might cause an inhibitor effect and in order to understand that effect, the kinetic assays were repeated in the absence of phenanthroline.
Using bioinformatic tools (docking, modeling and others), was possible to conclude that exist conserved amino acid (G43, L74, P78 e W149) in Dps that appear to participate and are in the electron transfer pathway.
IX
Resumo
O ferro é um elemento essencial para o bom funcionamento da rede metabólica de um ser vivo. No entanto, também é tóxico em condições fisiológicas. Para além de precipitar, pode também danificar e comprometer as macromoléculas constituintes das células através de reações de Fenton. Assim, as ferritinas, proteínas esféricas ocas, vêm colmatar este problema ao armazenar ferro nas suas cavidades. Este presente estudo, centra-se no desempenho e funcionamento da Dps (DNA-binding protein), que, ao contrário das maxi-ferritinas têm a sua função direccionada para a protecção do DNA contra as ROS.
O funcionamento das ferritinas pode ser dividido em várias etapas: entrada de ferro, oxidação, nucleação e saída de ferro. Esta última é a menos explorada e conhecida.
A flavoproteina WrbA de M. hydrocarbonoclasticus foi usada como parceiro redox da
Dps de P. nauticas para o estudo do passo de libertação de ferro. Como tal, foram realizados
estudos cinéticos por espectroscopia de Mössbauer numa mistura reacional de WrbA(FMN):NADH:Dps em condições anaeróbias. Para determinar parâmetros cinéticos, foi necessária a aquisição de espectros em diferentes tempos reacionais. A libertação de ferro da Dps wild-type e mutantes (Q14E e Δ15) segue uma cinética de primeira ordem com constantes de velocidade muito semelhantes.
Para além disso foi desenvolvido um ensaio cinético mais barato e rápido baseado no teste de determinação de ferro por formação de complexo o-fenantrolina. Os resultados não mostraram diferenças significativas no perfil cinético entre a Dps wild-type e mutantes. Não obstante, as constantes cinéticas calculadas neste ensaio são significativamente inferiores às obtidas através dos ensaios de espetroscopia de Mössbauer. Verifica-se que a presença de fenantrolina causa um efeito inibitório na cinética.
Com recurso a ferramentas bioinformáticas (docking, modelação e outros), foi possível concluir que existem aminoácidos conservados na Dps que podem participar e que estão no caminho de transferência eletrónica para libertação de ferro.
XI
Table of contents
Agradecimentos ... V Abstract ... VII Resumo ... IX Table of contents ... XI List of figures ... XV List of tables ... XVII Abbreviations... XIX
1 Introduction ... 1
1.1 Metal elements in biological systems ... 1
1.1.1 Iron chemistry and properties ... 1
1.2 Iron metabolism regulation in bacteria ... 3
1.2.1 Iron entry into the cell ... 3
1.2.2 The ferritin family ... 4
1.3 DNA binding protein from starved cells (Dps) ... 4
1.3.1 Dps function... 6
1.3.2 Regulation of Dps expression ... 7
1.3.3 Dynamics of iron in Dps ... 7
1.3.3.1 Iron uptake ... 7
1.3.3.2 Ferroxidase activity ... 9
1.3.3.3 Nucleation and core formation ... 10
1.3.3.4 Iron exit ... 10
2 Aims ... 13
3 Experimental Procedure ... 15
3.1 Protein overexpression production ... 15
3.1.1 Plasmid preparation ... 15
3.1.2 Cellular growth ... 15
3.1.3 Protein isolation and purification ... 16
3.2 Kinetic studies ... 18
3.2.1 Iron-loaded Dps samples preparation ... 18
3.2.2 Kinetic studies of release of iron from Dps ... 19
3.2.2.1 Mössbauer spectroscopy ... 19
3.2.2.2 UV-Visible spectroscopy ... 20
3.3 Bioinformatic study ... 20
XII
3.3.1.1 3D Jigsaw ... 22
3.3.1.2 Modeller/HHPred ... 22
3.3.1.3 M4T version 3.0 ... 22
3.3.1.4 Phyre2 ... 22
3.3.1.5 Robetta ... 23
3.3.1.6 Swiss model ... 23
3.3.2 Model results evaluation ... 23
3.3.3 Model Refining ... 24
3.3.4 Docking ... 24
3.3.4.1 Dps and WrbA interaction ... 24
3.3.5 Additional Bioinformatic tools ... 25
4 Results and Discussion ... 27
4.1 Plasmid preparation ... 27
4.2 Overproduction of Dps(wt) ... 27
4.3 From cell lysis to purification of Dps ... 29
4.4 Modeling WrbA ... 32
4.4.1 3DJigsaw ... 32
4.4.2 HHPred/Modeller ... 32
4.4.3 M4T ... 33
4.4.4 Phyre2 ... 33
4.4.5 Robetta ... 33
4.4.6 Swiss Model ... 33
4.5 Modeling validation ... 33
4.5.1 SFCheck ... 33
4.5.2 SAVES ... 35
4.5.3 Modeling results overview ... 36
4.6 Docking Dps and WrbA ... 37
4.6.1 Dps and WrbA interaction ... 37
4.7 Kinetic characterization ... 41
4.7.1 Iron loaded proteins ... 41
4.7.2 Kinetic characterization by Mössbauer spectroscopy ... 42
4.7.3 Kinetic characterization by optical spectroscopy... 48
4.8 Docking Dps and ferroin/phenanthroline ... 53
5 Conclusion and general overview of results ... 59
6 Future prospects ... 61
7 References ... 63
XIII
8.1 Dps protein sequence ... 73
8.2 Transformation of competent cells ... 73
8.3 Nzytech plasmid DNA miniprep protocol ... 74
8.4 Agarose gel electrophoresis for DNA analysis ... 74
8.5 SDS-PAGE for protein analysis... 75
8.6 WHATCHECK number code ... 77
8.7 Cluspro score functions ... 78
8.8 Mössbauer spectra results ... 79
8.9 Predict protein ... 80
XV
List of figures
Figure 1 Spin, geometric and redox state of iron coordination complexes ... 1
Figure 2 Amino acids with high affinity side-chains for iron ions ... 2
Figure 3 Iron uptake by a gram– bacterial cell ... 3
Figure 4 Tridimensional structures of E. coli ferritins proteins ... 5
Figure 5 2-fold, 3-fold (type II) and 3-fold (type I) Dps channels ... 6
Figure 6 3-fold channels as a pathway of iron uptake ... 8
Figure 7 Iron entry to the ferroxidase center of DpsA from H. salinarum via a 3-fold type II channel ... 9
Figure 8 Bimetalic ferroxidase centers ... 10
Figure 9 Structural representation of flavoprotein WrbA ... 13
Figure 10 Schematic representation of the experimental procedure used for protein production ... 17
Figure 11 Structure of the ferroin complex ... 18
Figure 12 The two zones of sequence alignments ... 21
Figure 13 Electrophoresis analysis of pET21c-Dps(wt) minipreps in agarose gel ... 27
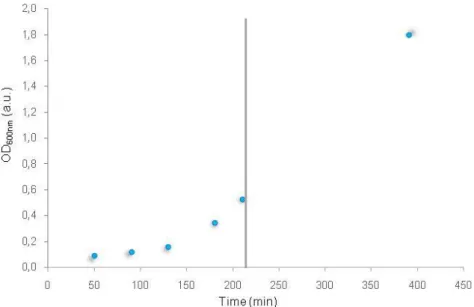
Figure 14 Growth curve of E. coli BL21(DE3) harboring the pET21c-Dps(wt) expression vector ... 28
Figure 15 SDS-PAGE analysis of the production of Dps in E. coli BL21(DE3) ... 28
Figure 16 Elution profile of DEAE-Sepharose FF column (2.6 x 30 cm) used as the first purification step of Dps(wt) ... 29
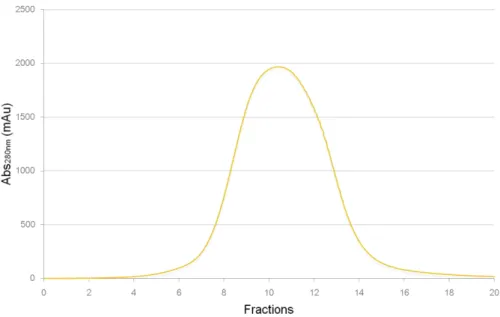
Figure 17 Elution profile of the gel filtration Superdex 200 column (1.6 x 49 cm) used as the 2nd purification step of Dps(wt) ... 30
Figure 18 Elution profile of the 3rd purification step on a Q-Resource column (6 mL) of Dps(wt) ... 30
Figure 19 Purity assessment of final pooled fractions during purification of Dps(wt) ... 31
Figure 20 A typical catalase test ... 31
Figure 21 Overposition of Robetta models 4 and 5 of WrbA ... 37
Figure 22 Spatial orientation of the monomer ... 38
Figure 23 Overposition of Dps-WrbA docking result for model 4 (gold) and model 5 (blue) with best balanced score. ... 39
Figure 24 Dps-WrbA docking result from Dps point-of-view ... 40
Figure 25 Docking result of model5 and Dps with vdw+elec function scores ... 41
Figure 26 Calibration curve with iron standard by the o-phenanthroline method ... 42
Figure 27 Iron loaded (144 Fe/protein) of wild-type , Dps-∆15 and Dps-Q14E. ... 42
Figure 28 Mössbauer spectra of Dps(wt) loaded with 144 57Fe/protein in anerobic conditions44 Figure 29 Mössbauer spectra of Dps Q14E and ∆15 loaded with 144 57Fe/protein in anaerobic conditions.. ... 45
XVI
Figure 31 Kinetic results for WT, N15 and Q14E samples. ... 47
Figure 32 UV-Visible spectra of the substrates of the anaerobic iron release reaction in Dps in 200 mM MOPS pH 7.6, 200 mM NaCl buffer. ... 48
Figure 33 Anaerobic iron release kinetic assay by Dps-NADH-WrbA system ... 49
Figure 34 Kinetic observed for Dps wild-type , Q14E and ∆15 ... 50
Figure 35 Phenanthroline kinetic data compared with Mössbauer results.. ... 51
Figure 36 Spectra recorded 3.62 and 462 min after NADH was added to Dps(core) and phenanthroline. ... 51
Figure 37 Kinetic of wild-type and NADH control samples. ... 52
Figure 38 Absorbance recorded at 510 nm for WrbA control.. ... 52
Figure 39 Best result for Dps and phenanthroline docking. ... 53
Figure 40 Best scored docking of Dps with ferroin. ... 54
Figure 41 Confsurf results for Dps sequence.. ... 54
Figure 42 Effect of point mutation results of Predict Protein server.. ... 56
Figure 43 NZYDNA Ladder III (Nzytech) molecular weight marker. ... 75
Figure 44 Electrophoretic profile of the low molecular weight (LMW) protein marker from Nzytech ... 76
Figure 45 Predict protein server result for point mutation effect from aminoacid 1 to 89 of Dps sequence. ... 80
XVII
List of tables
Table 1 Predominant redox states in physiological conditions ... 1
Table 2 Composition of samples for iron determination by the o-phenanthroline method ... 18
Table 3 Molar extinction coefficients in M-1cm-1 ... 19
Table 4 Modeling servers ... 21
Table 5 Additional bioinformatics tools description ... 25
Table 6 Best templates from alignment in 3DJigsaw ... 32
Table 7 Templates select for multiple alignment in Modeller ... 32
Table 8 Detailed results for the 4 best models. ... 33
Table 9 Resume of SFCheck results ... 34
Table 10 SAVES results ... 35
Table 11 Common residues for each set of 5 best scored models ... 38
Table 12 Detailed information about conservation of some amino acids from docking results. 55 Table 13 Composition and preparation of buffers, staining and bleaching SDS-PAGE. solutions. ... 76
Table 14 Preparation of a 12.5% polyacrylamide gel for SDS-PAGE analysis ... 77
Table 15 Percentage of ferric and ferrous specie calculated by WMOSS© v 1.51 (See co.) software for each Mossbauer spectra ... 79
XIX
Abbreviations
A Alanine
ATP Adenosine triphosphate
Bfr Bacterioferritin
bp Base pairs
D Aspartate
DEAE Diethylaminoethyl cellulose
DFB 3,3'-Difluorobenzaldazine
DNA Deoxyribonucleic Acid
Dps DNA-binding protein in starved cells
Dps(wt) Wild-type Dps
E Glutamic acid
E. Escherichia
FeSid Iron-siderophore complex
Flv Flavoprotein
FMN Flavin mononucleotide
FOC Ferroxidase center
Ftn Bacterial ferritin
G Glycine
GMQE Global model quality estimation
GTP Guanine triphosphate
H Histidine
HMM Hidden Markov Model
HPLC High performance liquid chromatography
I Isoleucine
IPTG Isopropyl β-D-1-thiogalactopyranoside
K Lysine
L Leucine
L. Listeria
LB Luria-Bertani
LMW Low molecular weight
Mers monomers
mRNA Messenger RNA
MRI Magnetic Ressonance Imaging
MWCO Molecular weight cut-off
N Asparagine
NADH Nicotinamide adenine dinucleotide
NADPH Nicotinamide adenine dinucliotide phosphate
OD Optical Density
P Proline
P. Pseudomonas
PDB Protein data bank
PFam Protein families
Phen o-phenanthroline
Prob Probability
PSA Ammonium persulfate
XX
Q Glutamine
R Arginine
ROS Reactive oxygen species
S Serine
SS Secondary structure matching
SDS-PAGE Sodium dodecyl polyacrylamide gem electrophoresis
SMART Simple modular architecture research tool
T Threonine
TEMED Tetramethylethylenediamine
UV Ultraviolet
V Valine
Vdw+elec Van der walls and electrostatic
W Tryptophan
WrbA Tryptophan [W] repressor binding protein
Wt Wild-type
1
1. Introduction
1.1 Metal elements in biological systems
Homeostasis, i.e. the balance of energy flow in and out of an open system, is essential for the survival of a living system.[1] Furthermore, the chemical elements that are used in a whole range of cross-linked reactions that constitute the metabolism must be bioavailable.[2]
In particular, metallic elements can participate in a series of metabolic reactions for the following biological functions:[3],[1],[4]
i) Charge carriers: Propagation of nervous impulses; one of the examples of this particular function, is triggered by the diffusion of inorganic ions through the membrane of neurons;[5]
ii) Electron transfer: Some metal elements have multiple oxidation states, which make possible a molecule to be redox-active;[3]
iii) Structural function: Metal ions may provide stability in protein structures, decreasing the effect of chaotropic agents.[6] An example is the zinc finger protein motif, in which one or more coordinated metal are responsible for the protein structure stabilization;[7]
iv) Catalytic function: Many proteins require metallic elements to fulfill his function;[8]
Among the various important metals that participate in biological reactions, like zinc, copper, molybdenum, cobalt, vanadium and others, iron is the most abundant.[3]
1.1.1 Iron chemistry and properties
There are two main reasons that make iron so suitable for biological use. In first place, it is the fourth element most abundant in earth crust (5%)[9] and, thus, theoretically the abundance and availability is no restrain. Also, this metal can adopt different spins and redox states[10] within a range of -300 to +700 mV, depending on the ligands and environment[11],[12] (figure 1). This versatility turns out to be a very important characteristic for a good prosthetic group.
Figure 1 - Spin, geometric and redox state of iron coordination complexes. Adapted from reference [13].
2
These two properties permits iron, in a local ambient like a protein pocket, to adopt the redox potential, geometry or spin state necessary to proper biological function.[12]
As shown in table 1, both iron states have preferred ligands. Accordingly to the hard-soft acid and base theory, Fe3+ (hard metal ion) have a tendency to react with hard ligands and Fe2+ (medium metal ion) can bind to soft and hard ligands.[15] In a protein, it is natural that the metal ion reacts with the amino acids side-chains that contain these preferredchemical groups. In figure 2, the common amino acids that may be more reactive to Fe3+ and Fe2+ are represented.[16]
Figure 2 – Amino acids with high affinity side-chains for iron ions.
Despite all these favorable properties, in physiological medium, iron can be very toxic and limited.[10] At pH=7, two main redox states - Fe2+ and Fe3+- with a solubility of ~10-1 M and 10-18 M, respectively, can exist.[12] The ferric insoluble form (Fe3+), in presence of water, frequently associates into μ-oxo ferric species.[3] The more soluble ferrous form (Fe2+) is still able to react. However, Fe2+ ion can react with molecular oxygen and hydrogen peroxide (product of the incomplete reduction of O2) through Fenton reactions (eq. 1), forming Fe3+ and oxygen reactive species (ROS). This phenomenon, known by oxidative stress, is devastating, since ROS damage biomacromolecules, compromising the cell integrity.[12],[17]
(eq. 1) (eq. 2)
3
1.2 Iron metabolism regulation in bacteria
1.2.1 Iron entry into the cell
However, before used inside the cell, specifically in gram– bacteria, iron has to pass through two independent steps (figure 3):[18], [19]
i) Transport across the external membrane: The general strategy for Fe3+ ions uptake is the synthesis of siderophores that are released to the medium in order to chelate the metal. The complex FeSid are uptaked by a transmembranar transporter.
ii) Iron release into the cytoplasm: The prevailing system for the Fe3+ siderophores, heme and iron transport to the cytoplasm, are the ATP-dependent transmembranar complexes. Fe2+ ions are transported by several transmembranar transporters (figure 3). The most common is the Feo system, an operon of three genes feoA, feoB, feoC and a Fe2+-Fur regulated promotor upstream of FeoA. FeoB is a protein with a GTPase domain and is essential for Fe2+ transport. Fe3+ can be released from siderophores and reduced to the Fe2+ form. Due to the stability of FeSid complexes, the iron release reaction is an enzymatic process.
Figure 3- Iron uptake by a gram– bacterial cell. Figure adapted from reference [19].
4
overcome the toxicity and low availability of unneeded iron, living systems have to evolve mechanisms to sequester iron and liberate only when required.[10] The proteins from the ferritin family have two main functions. First, serving as iron sink, storing iron in a nonreactive site until it is necessary, and thus time avoiding loss of available iron ions. The second function, dependent of the first, is saving macromolecules from damage by oxidative stress, avoiding the occurrence of Fenton reaction.[20],[21]
1.2.2 The ferritin family
The ferritin-related family (IPR012347) belongs to the ferritin-like superfamily. This family of proteins nanocages produces biocompatible ferrihydrated nanoparticles and based on their subunit composition are classified as maxi- or mini- ferritins.[22] Superparamagnetic iron oxide nanoparticles have been a great contribution to health biotechnology, for example as contrast agents in MRI or in chemotherapy.[23] As such, some research groups have been studying and using ferritins for the production of biocompatible nanoparticles for these applications.
Maxi-ferritins have 24 subunits (of about 20 kDa) and an internal diameter of 6-8 Å, capable of storing more than 4000 Fe atoms. Mini-ferritins, however, are smaller (12 subunits and an internal cavity of 4-5 Å) and thus have less storage capacity (< 500 Fe atoms).[22],[24]
In prokaryotes, there are two maxi-ferritins: Bacterial ferritin (Ftn) and the heme-containing bacterioferritin (Bfr). The mini- ferritin, also called Dps, will be described in more detail later. Escherichia (E.) coli is a typical organism where these three ferritins co-exist. Most
of prokaryotes have one or two of these three ferritins with different specialized functions. Actually, each type of ferritin can have different specific function in different organisms. For example, while in E. coli Ftn is the main source of iron, in Neirserria gonorrhoeae Bfr serves as
main iron storage protein.[25]
In eukaryotes, maxi-ferritin are quite different from those found in prokaryotes.[22] Different types of subunits combine and co-assemble to form the nanocavity. In animals, ferritins have a catalytic active heavy-type subunit and a ferroxidase inactive light-type.[26] Until today, eukaryotic mini-ferritin was not reported.
1.3 DNA binding protein from starved cells (Dps)
First described by Almiron et. Al, the E. coli Dps, highly expressed in starving
conditions, in vivo and in vitro, was shown to bind DNA protecting it from chemical
damage.[24],[27] Later in 1997, Martinez and Kolter demonstrated an increase of cell survival (and a decrease in DNA breaks) when Dps is expressed in vivo.[28]
The crystallographic structure of Dps from E.coli was reported in 1998.[29] Aside some
5
multimeric organization. Some authors proposed that mini-ferritins resulted from the evolution of maxi-ferritins in order to become adapted to more versatile functions.[24],[30]
Figure 4 – Tridimensional structures of E. coli ferritins proteins. Top panel: Protein nanocavities
with dimers in blue and heme group in red and respective monomers. Crystal structures of A) Bfr (PDB: 2Y3Q); B) Ftn (PDB: 1EUM); C) Dps (PDB: 1L8H); D) Structural superposition of Bfr (blue), Ftn (yellow) and Dps (orange) monomers.
6
I channel is more acidic while type II is more hydrophobic.[31],[32] Besides, the small helixes in the middle of the long loops, also not present in maxi-ferritins, are responsible for establishing interaction inter-monomers in 2-fold channels.
Figure 5- From left to right, 2-fold, 3-fold (type II) and 3-fold (type I) Dps channels. Protein structure data from reference [33].
1.3.1 Dps function
Recently, Ping et al described a new and rare function in Dps, the synthesis and degradation of amino-acyl glutamines, although attributing as principal function the protection of macromolecules, especially DNA, in oxidative stress, starving, heat-shock, pH alterations or osmotic pressure conditions.[32],[34],[35]In fact, this protein is involved in the survival of pathogenic bacteria like Bacteroid fragilis in a host environment to overcome the oxygen toxicity of the
host.[36]
How can Dps fulfill these functions?
i) Ferroxidase activity: Such as all other ferritins, Dps can oxidize free ferrous iron in solution and store it in its cavity so that Fenton reaction cannot take place;[35], [37], [38] ii) Peroxidase activity: Hydrogen peroxide is a more efficient substrate in iron oxidation
than oxygen. Dps can detoxify both reagents of Fenton reaction without ROS formation (eq. 1);[39],[40]
iii) Physical and chemical shielding of DNA: This mechanism can occur in synergy of Dps self-aggregation and DNA condensation.[41] Dps self-aggregation result in a crystal lattice of three adjacent dodecamers forming a hole lined by the N-termini.[42],[43] This will be the driving force to DNA condensation. The flexible N-terminal, observed in E. coli Dps, is crucial for the Dps-DNA co-crystallization,
7
1.3.2 Regulation of Dps expression
Dps is predominantly expressed in the stationary phase of E. coli growth, corresponding
up to 2% of the cell proteome.[19] At this growth phase, the microorganism is in intense competition of nutrients, i.e. in starving conditions, once more vulnerable to adverse events like oxidative stress, needing machinery to protect all types of macromolecules.[27]
E. coli Dps vary
from 600 copies on exponential phase to 180 000 in stationary stage.[46]
Iron limitation, chelators and molecules of FeSid up regulate the Dps expression at any growth phase.[47],[48] However, at transcriptional level, the control at stationary phase is up regulated by σs
transcription initiation factor that recognized the promotor. At the exponential phase, H2O2 regulates the OxyR that, in turn, activates the σ70-RNA polymerase initiating the transcription of Dps mRNA.[46],[49]
In E. coli down-regulation during exponential phase can occur by proteolysis or by
repression through H-NH to the promotor, preventing σ70 recognition.[50],[51] To block the σs promotor complex formation in the stationary phase, Fis binds to the promoter in the exponential phase.[51]
1.3.3 Dynamics of iron in Dps
The overall process can be divided in the following steps: Iron uptake, iron oxidation, nucleation and iron exit.
1.3.3.1 Iron uptake
It has been proposed that iron translocation in ferritins inside the hollow protein sphere occurs through the 3-fold channels. In most Dps, the preferential pathway is the 3-fold type I channels.[19]
The X-ray structure of iron loaded Listeria (L.) inoccua Dps provided important
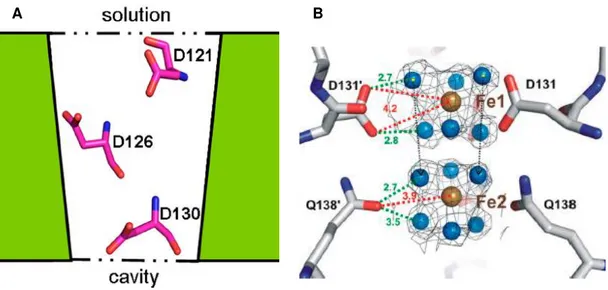
outcomes about the iron entry through these pores.[52],[31] Iron ions are guided through the funnel shaped channel by the electrostatic gradient. This gradient is formed by D121, D126 and D130 residues located along the surface (figure 6A). Since these channels are tapered, the negative charges become more concentrated in the inner side of the channel. Bellapadrona et al studied
the effect of this three aspartate residues in the iron uptake process.[52] D130, situated in the most interior and narrow region of the channel, has 80 % of conservation in Dps proteins. The mutation on this residue decreases the ferroxidation reaction rate. Mutation of residues D121 or D126 does not affect the uptake process. However, the triple mutant has a drastic effect, which suggests a cooperative effect of these three negative carboxylate residues.
8
exposed in the channel surface. It has been speculated that E132 and D139 have the role of guiding these complexes to the cavity; the aspartate residue also constrains the diffusion of iron, by stripping off the water molecules, so that iron can enter “naked” for subsequent
oxidation.
Figure 6 – 3-fold channels as a pathway of iron uptake. A) Aspartate residues aligned through the L. innocua Dps 3-fold type I channel; B) Experimental observation of iron-water complexes.
Figures from references [52] and [48], respectively.
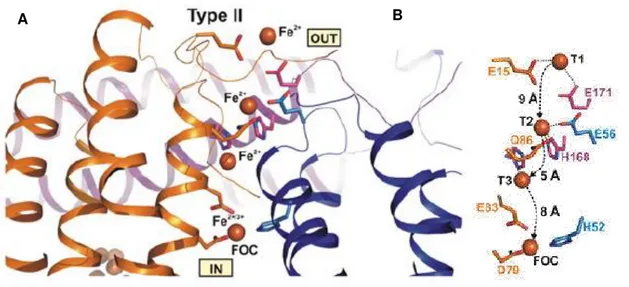
A different pathway for the entry of iron was observed in DpsA from H. salinarum,
through the hydrophobic 3-fold channels.[48] Three iron translocation sites were seen the crystallographic structure. The T1 site, most outside, is at a distance of 20 Å of the iron oxidation sites and binds Fe2+ ions via E171 and D172 residues. A cluster of 6 amino acids (E13, E15, D18, E167, E71 and D173) acts as electrostatic guide. At the second site, T2, iron is coordinated by E56, E86 and H168 side-chains. Site T3 (H164 and Q86), situated at 7 Å from the iron oxidation site, weakly interacts with the metal.
Only in H. salinarum was reported his iron pathway (figure7). Maybe, a hydrophobic
route has become preferable upon the restrict hydration resulted from the high salt concentrations faced by this enzyme. Also, the distance between the iron oxidation centers is 8 Å for T3 type II channel and 1nm for the second hydrated iron complex in type I channels.
9
Figure 7 - Iron entry to the ferroxidase center of DpsA from H. salinarum via a 3-fold type II
channel. A) Three subunits are colored in orange, blue and magenta. Iron ions in the channel are in the ferrous state, and can be Fe2+ or Fe3+ in the FOC.B) A schematic representation of
the iron pathway. Both figures from reference [19].
1.3.3.2 Ferroxidase activity
After iron translocation through the pores, ferrous ions are oxidized at the ferroxidase centers (FOCs).[19] In Dps these centers are localized in the two-fold interface of monomers with the exception of the proteins from. Lactococcus (L.) lactis and L. sulfobos are exceptions in
which the catalytic centers are located in the middle of the four-helix bundle monomers.[44],[53] Each dimer interface has 2 catalytic centers. A typical FOC is bimetallic.
The oxidation of Fe2+ to Fe3+ can occur with H
2O2 or O2 as oxidant. Although O2 can be used, the reaction is slower. The two reactions are represented in the following equations:[30]
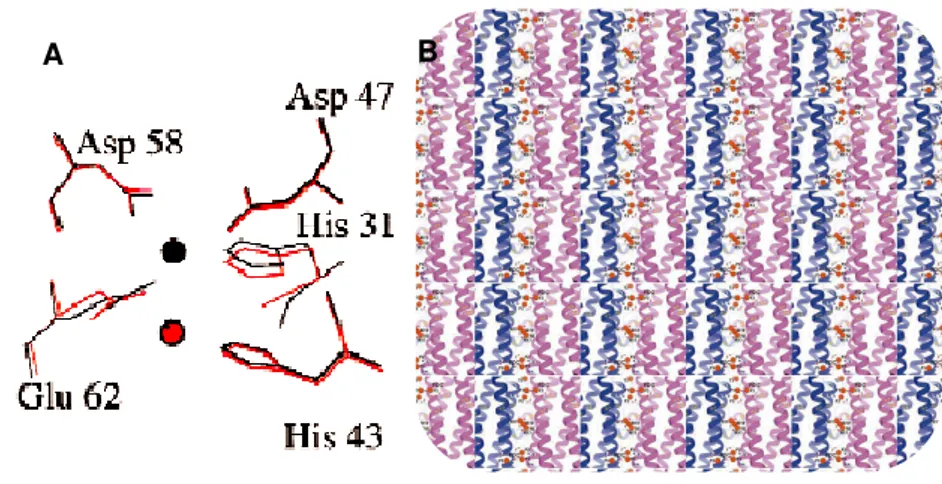
The two ferrous ions bind to the ferroxidase center and are oxidized producing a diferric µ-oxo bridged (FeOOH) species. Iron atoms are coordinated by histidine and carboxylate residues. However one, usually designated by site A, has a higher affinity for iron, once that has a histidine not present in site B.[19],[30] Site B were not visible in all Dps. In L. innocua Dps, site A
was firstly discovered, the iron atom was coordinated to H31, H43, D47, G62 and D58.[31] The site B was confirmed experimentally in DpsA.[54]
10
Figure 8- Bimetallic ferroxidase centers. A) Site A from L. Innocua. The iron atoms are
coordinated to D58 and G62 from one subunit and D47, H31, H43 from another. The di-iron binding site A was modeled and is shown at red. B) View from the inside of the Dps of site A and B. Figures from references [31] and [19], respectively.
1.3.3.3 Nucleation and core formation
Mineralization is explained by the crystal growth mechanism, in which nucleation is the first step of mineralization that consists in the formation of initial small iron clusters that become auto-catalytic increasing in size.[55]
Two different types of nuclei were observed in H. salinarum DpsA, one located at the
2-fold axis and a second at the 3-2-fold axis at approximately 12-13 Å of FOCs.[54]
Negatively charged residues in the FOC vicinity might facilitate iron oxide nucleation. L. innocua Dps residues E44 and D47 at two-fold symmetry axis have been proposed to be
involved in nucleation.[31]
The mineralization process is also dependent of the electrostatic gradient of pores. On the study of Bellapadrona, previously described, the mutation of the aspartate residue also resulted in the alteration of size distribution of iron core.[52]
The iron cores of ferritins and Dps proteins have superparamagnetic properties. A native core, i.e. the core of purified protein, contains only tens of atoms with different phosphate ratios. The smallest native core analyzed so far contains only 16 iron atoms with a phosphate/Fe ratio of 0.7.[56] The
in vitro cores are formed by addition of iron to the protein and
have more well-ordered crystalline state and higher phosphate content. This disorder makes iron more readily usable.[53]
1.3.3.4 Iron exit
This phase of Dps and ferritin function is the less known and explored. There are still many questions. Most described studies are from mammalian and prokaryotic ferritins.[57]–[59] Iron release has been neglected in scientific research; however has an important role and
11
application for medical biotechnology, for example in chelation therapy for iron overdosage or even in nanodrugs and nanomaterial design.
Great number of experimental procedures used for iron release used a reducing agent, such as NADH/FMN and chelators. In 1980, Crichton shows that different chelators lead to different results, but all are efficient in iron liberation studies in human ferritins in vitro.[60] This
was also verified in Dps, at uptake profiles for DFB and sulfoxine.[61] In fact, some evidences suggest that chelators can entry to the cavity and liberate the iron there stored.[62], [63]
The presence of biological ferritin unfolders inside the cell that would modulate the iron exit channels has been postulated.[57] Unfolding of hydrophobic zones at 3-fold channels in 24-mers mammalian ferritins results in small differences in the iron exit profile. Pores structure modifications can be induced by narrow variation of urea concentration or by mutation of conserved amino acids at the surrounding area. These 3-fold pores resemble those found in Dps, specially the type I. Despite not proved, this type of 3-fold pores can be an iron exit pathway. Due to their hydrophobic character and shorter radius, type II channel may have a major role in iron entry.[64]
In Dps the iron release curves depend on the shape and size of iron cores.[52] The iron release process can be divided into two different phases. The first is the reducing of ferric ions at the core surface. In the second phase iron is removed from the bulk mineral.
13
2 . Aims
As mentioned before, the iron release process is the less explored reaction of ferritins’
function. This present study is focused about the identification of a putative physiological redox partners of Dps and to unveil this function, specifically about the role of WrbA. This protein is coded by the wrba gene expressed in the stationary phase E. coli cells under the regulation of σs factor (described in section 1.3.2).[65] It is a NADH:Quinone reductase that binds a FMN cofactor to 3 subunits of a tetramer (each tetramer has 4 pockets for FMN and NADH ligation) (figure 9).[66], [67] As mentioned before the FMN/NADH system is used for iron release experimental studies from ferritins and because WrbA flavoprotein was proposed to be involved in bacterial stress defense mechanisms we postulated that this protein could participate in iron release from Dps.
Figure 9 – Structural representation of flavoprotein WrbA. A) Tridimensional structure of E. coli
WrbA with the FMN groups represented as stick and balls. The apo-WrbA monomers are represented in blue, green, purple and pink; holo-WrbA in green, purple, and grey. B) Representation of FMN/NADH binding pocket. FMN is represented in red and WrbA monomers are in green, blue and yellow. NADH is depicted as a skeletal model with a translucent electrostatic potential surface shaded from red (negative charge) to blue (positive charge). Figures from reference [66], [67], respectively.
Previous Mössbauer kinetic studies, Almeida revealed that the WrbA/NADH/FMN system has the ability to remove iron from the Pseudomonas (P.) nautica Dps core.[68] One aim
of this thesis is to develop a faster and inexpensive kinetic assay to test iron release from ferritins. This novel kinetic assay is based on the chelators’ assay commonly used, utilizing the chelator o-phenanthroline.
14
packages was compiled. Choice of which software to use was made based on calculation capabilities and assessment of end user usability. It was also an aim of this study to compare the used software packages regarding usability, reproducibility and performance when analyzing our multimeric, cofactor containing protein-protein complexes.
Once optimized with wild-type Dps, this characterization will be repeated with a Dps mutant (Dps Q14E and Dps∆15) in order to infer about the role of specific protein regions in Dps important in iron exit or electron entry pathways.
In summary, we aim to answer the following questions:
Is it possible to identify relevant amino acid residues with an active role in iron release?
Is it possible to obtain a plausible hypothesis for the interactions of these complex proteins?
What are the best/more relevant point mutations that can be done to obtain further information about the iron release mechanism?
15
3 . Experimental Procedure
3.1 Protein overexpression production
3.1.1 Plasmid preparation
E. coli NZY5γ and BL21(DE3) Nzytech competent cells were transformed with
pET21c-Dps(wt) plasmid, harboring the gene coding for P. nautica Dps (sequence at annex 8.1), for
subsequent plasmid purification and protein production, respectively, following the Nzytech protocol (annex 8.2).[69],[70] The genotypes of these cells are presented in annex 8.2.
Briefly, the appropriate amount of pET21c-Dps(wt) was added to competent cells and kept on ice for 30 min. After a heat shock of 40 seconds of at 42 oC in a heating bath (50-60 Hz Grant Instruments Cambridge Ltda.), cells suspensions were kept on ice for 2 min. Liquid LB medium (Nzytech) was added for cellular growth during 2 h at 42 oC at 225 rpm (Ovan Incubator OPAQ I10-OE+ACOP Ref. 10000-01056). Transformation controls were treated in parallel.
The transformation suspensions, including controls, were plated on LB/Agar (Nzytech) plates with 100 μg/mL of ampicillin (Nzytech). All plates were incubated overnight at 37 oC.
A single E. coli NZ5γ transformant colony was used to inoculate 5 mL of LB medium
(Nzytech) with 100 μg/mL ampicillin and incubated with vigorous shaking at 36 oC for 22 hours for plasmid isolation and purification.
Plasmid DNA was purified using the low copy number plasmid NZYMiniprep Kit protocol (annex 8.3).[71] The efficiency of the plasmid purification was evaluated by agarose gel electrophoresis, as described in annex 8.4.
Plasmid minipreps were quantified by UV spectroscopy using a molar extinction coefficient at 280 nm of 0.02 µg/mL/cm.
The same protocol was used to produce WrbA flavoprotein[68] from Marinobacter hydrocarbonoclasticus coded by MARHY3073 gene and Dps variants (Dps15 and DpsQ14E).
3.1.2 Cellular growth
Cellular growth and protein purification were performed using a protocol established by the Molecular Biophysics group.
First, a pre-inoculum of 5 mL (triplicates) LB medium containing ampicillin (100 μg/mL) were inoculated with single E. coli BL21(DE3) transformant. After incubation at 37o
16
medium, incubated for 9 h in the same conditions and used to inoculate 1 L of LB-ampicillin (100 μg/mL) (10 mL of inoculum).
Cell growth, at 37 oC, 220 rpm, was monitored measuring the OD at 600 nm. Gene expression was induced with 0.5 mM of IPTG at an OD600 nm of approximately 0.5. After 3 hours of induction, cells were harvested by centrifugation on a Hermle Z36HK centrifuge at 11 000 g
at 10 ºC for 10 min. The resulting pellets were suspended in 10 mM Tris-HCl pH=7.6 buffer and stored at −80 oC.
Proteins expression was evaluated by SDS-PAGE (protocol in annex 8.5) of aliquots collected at time zero and 3 h of induction.
3.1.3 Protein isolation and purification
To facilitate cell lysis, the membrane of the bacterial cells was embrittled with cycles of freeze-thaw.
Disruption of cell membranes was made with cycles of 3 min of sonication with a Ultrasonic homogenizer (LABSONIC M Sartorius Stedim Biotech) at 100% of amplitude on ice followed by 30 sec of cooling on ice. DNase I (Roche) was added to reduce viscosity. The suspension was centrifuged to remove cell debris at 10 000 g (Hermle Z36HK LaborTechnik
centrifuge) for 15 min at 10o
C; the supernatant was subsequently ultracentrifuged (Optima LE-80K with a 70Ti rotor, Beckam) at 207 870 g to obtain the soluble protein fraction.
The soluble fraction was dialyzed in 12-14 kDa MWCO membranes (Visking, Medicell International, Ltd) against 10 mM Tris-HCl pH 7.6 buffer, at 4o
C, overnight. The dialyzed crude extract was centrifuged at 11 000 g for 15 min at 4 oC before purification. Aliquots of each
fractionated fraction were collected to evaluate the efficiency of the isolation process by SDS-PAGE.
The dialyzed soluble fraction was filtered with a 25 mm syringe filter (0.45 μm
polyethersulfone membrane, VWR International) and loaded into a DEAE-Sepharose Fast Flow column (2.6 x 30 cm, GE Healthcare Life Sciences) coupled to a ÄKTA Prime Plus chromatography system (GE Healthcare Life Sciences), pre-equilibrated with 10 mM Tris-HCl pH 7.6 buffer (buffer A). After washing the column (with buffer A), elution of bound proteins was made with a discontinuous linear gradient of NaCl (0 to 500 mM) with buffer B ( 10 mM Tris-HCl pH=7.6, 200 mM NaCl), at 5 mL/min. 12 mL fractions were collected and analyzed by SDS-PAGE and tested for catalase.
17
When judged necessary, a third chromatographic step was used to further purify the protein on a Resource Q column (6 mL, GE Healthcare Life Sciences) and following the same procedure used for the first step. The chromatographic separation was performed at a flow rate of 1 mL/min; fractions of 2 mL were collected.
Pure fractions were concentrated in ultrafiltration cells, 30 kDaMWCO Vivaspin (of 6 or 70 mL, Sartorius).
The catalase test was used to verify the presence of any trace of catalase that will interfere with subsequent kinetic studies. For such, 3 drops of 30% hydrogen peroxide was added to small aliquots of protein fraction. If release of O2 is observed, the fraction is contaminated with catalase.
Pure Dps fractions were dialyzed against 200 mM MOPS pH 7.0 buffer, 200 mM NaCl
and kept at −80 oC.
Figure 10 – Schematic representation of the experimental procedure used for protein production.
18
3.2 Kinetic studies
3.2.1 Iron-loaded Dps samples preparation
For the iron release studies, Dps had to be previously loaded with iron. The iron solution was quantified by the o-phenanthroline method, based on the formation of a colored Fe2+(o
-phen)3 complex (called ferroin). This complex has an intense orange color and a molar extinction coefficient at 510 nm of 11.2 mM-1cm-1.
Figure 11- Structure of the ferroin complex (created in ChemDraw® Professional v.14).
The calibration curve was produced using a Iron atomic absorption standard solution (Sigma-Aldrich) at 0.01 mg/mL. The composition of all samples, standard and iron solution of unknown concentration, are presented on table 2. After reduction with 10% hydroxylamine hydrochloride samples were quantified (eq. 9 and 10).
Table 2 – Composition of samples for iron determination by the o-phenanthroline method.
(eq. 9)
19
Protein preparations and NADH were quantified by UV-Visible spectroscopy using a Thermo Scientific Evolution 300BB spectrometer. The molar extinction coefficients are presented in table 3.
Table 3- Molar extinction coefficients in M-1cm-1.
The 57Fe solution used in the preparation of holo-Dps for Mössbauer analysis was dissolved in sulfur acid with stirring in an anaerobic chamber (MBraun Labmaster) and diluted with milli-Q water at pH 2.8. Holo-Dps with 144 Fe/protein was prepared in a headspace sealed microliter conic vials (Wheaton) by the 6 successive additions of 24 Fe(II)/protein aliquots. Samples were left to incubate for 5 days, oxygenated 2-3 times per day and stored at 4 oC.
The same procedure was followed for the preparation of iron-loaded Dps samples used in the UV-Visible spectroscopic study, with the exception of iron solution, which was replaced by a 56Fe
3SO4.
3.2.2 Kinetic studies of release of iron from Dps
3.2.2.1 Mössbauer spectroscopy
The Mössbauer spectroscopy is based on the resonant emission or absorption of gamma energy associated to level energy transition of nuclei in atoms. However, this resonance is prevented by the recoil of the atoms. To overcome this obstacle, Mössbauer discovered that, if the atoms are in a solid matrix, the recoil and the Doppler energies are low enough to observe resonance, since now the nucleus is fixed in a matrix.
The Mössbauer experiment consists in an isotope at an excited sate and an absorber that is the sample to study. The absorber contains the isotope from the same type of source. The gamma rays emitted by the nuclei source pass to the absorber where it may be partially absorbed. To modify the energy of gamma rays emitted, the isotope source is moving relative to the absorbance. The resonance absorbance is observed when the gamma rays energy is equal to the energy of the level energy transition. A Mössbauer spectrum is a plot of gamma ray relative absorption against the velocity of the source movement.
20
All the Mossbauer samples were prepared in an MBraun Labmaster anaerobic chamber (<4 ppm O2). All solutions were degassed with vacuum and argon cycles before placing inside the chamber.
The reaction time scale was previously assessed by a former Master student.[68] Mössbauer samples were prepared by addition of WrbA (15.897 µM Dps: 190.68 µM WrbA) to 144 57Fe/protein loaded Dps wild-type samples of 5x molar excess of NADH (2.289 mM 57Fe: 11.445 mM NADH). The same was proceeded for Dps variants Dps∆15 and Dps Q14E. However for these, Dps protein concentrations were 16.71 µM and 17.44 µM, respectively. The WrbA and NADH added to Dps mutant samples were accordingly to the same proportions of the WT samples, i.e WrbA 12 times Dps and NADH 5 times iron concentration.
The iron release reaction was initiated by the addition of the flavoprotein WrbA (12 WrbA/Dps) and stopped by freezing samples in liquid nitrogen after 2, 12, 20, 30, 50, 100 and 200 min. Mössbauer spectra were recorded at 10 K and 80 K.
3.2.2.2 UV-Visible spectroscopy
Based in the o-phenanthroline assay (described before) for iron quantification, a kinetic
assay was developed for the detection of iron release from Dps and mimicking the Mössbauer samples.
Reaction mixtures were prepared in a septum-sealed quartz cuvette with optical path length of 2 cm. The chelator o-phenanthroline (10 Phen/Fe in Dps) was included to 57Fe2SO3 iron loaded Dps with 5 and 12 times molar excess of NADH and WrbA, respectively. Such as in the Mössbauer samples, reaction was started by the addition of the WrbA protein and followed by continuous acquisition of spectrums over time. Special attention was made to keep the sample in anaerobic conditions. All spectra were recorded with a Thermo Evolution 300BB spectrometer between 300 and 600 nm.
3.3 Bioinformatic study
3.3.1 Modeling Flavoprotein
21
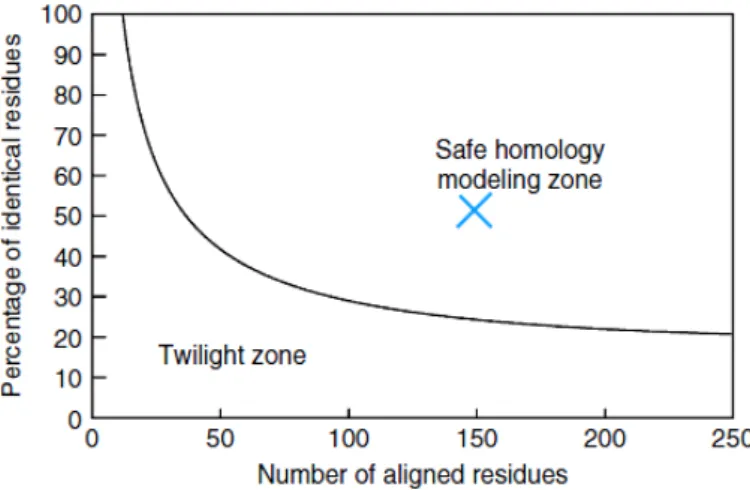
Figure 12- The two zones of sequence alignments. Two sequences are practically guaranteed to fold into the same structure if their length and percentage sequence identity fall into the region marked as ‘‘safe.’’ An example of two sequences with 150 amino acids, 50% of which are identical, is shown (cross). Figure from reference [72].
Homology modeling comprises the steps: 1. Find the best template
2. Align the template with the protein sequence 3. Create the backbone structure
4. Model loops 5. Model side-chains 6. Optimize
7. Validate
For the study of the interaction between Dps(wt) and WrbA it was necessary to request protein modeling tools to predict flavoprotein tridimensional structure. Seven different webservers provide models based in parent templates (table 4). All these servers search and select the best template from a database and use it to predict the 3D structure for the protein of interest. Two of the used servers can also perform ab initio modeling.
22
The amino acid sequence used in the query was the following:
MAKILVLYYSMYGHIETMANTVAEGARGVNGADVVVKRVPETMADEAFLNAG GKADQGAPVADPKELADYDAIIFGTPTRFGNMAGQMRTFLDQTGGLWAEGKL HGKVGSVFTSTGTGGGQEQTITSFWTTLAHHGMVLVPLGYGIPEFFDISEVNG GTPYGASTIAGGDGSRQPSEKELAIARFQGEHVAELAIKLHG
3.3.1.1 3D Jigsaw
3D Jigsaw server[73]–[75] looks for homologous in PFam[76], PDB[77] and non-redunctant templates database[78]. In iterative mode, the algorithm split the query sequences into domains and attributes a score accordingly to the template coverage in the query sequence.
After selecting the best template, the alignment can be corrected before submitting the modeling job. For the WrbA the alignment was not corrected.
3.3.1.2 Modeller/HHPred
This method is based on HMM (Hidden Markov model based profiles) profile comparison.[79] HMM profiles have information about the frequency of insertion and deletion that reflect how important each position is for defining other member of the protein family. By using both HMM profiles and iterative PSI-BLAST[80] alignment in uniprot[81], non-reduncted, HHpred, PFAM and SMART databases,[82] this algorithm become more conventional for predicting 3D structure from more distance related parents.[83],[84],[77]
The templates with more score were chosen in order to be modeled by Modeller program. This is one of the most popular programs for protein comparative modeling. Constrains, like C-C distances, bond lengths, main-chain and side-chain dihedral angles, are formulated in order to find the parameters that maximize the total probability density obtained by combining all constraints.
3.3.1.3 M4T version 3.0
M4T is the Multiple Mapping Method with Multiple Templates, i.e., uses an iterative implementation of the alignment method named Multiple Mapping Method (MMM).[85]–[87] But before, the templates are searched by a PSI-BLAST alignment in PDB database. Then the results are iterative clustered. The cluster with high score is used as template and submitted to a sequence-to-structure alignment method that optimally combines alternatively aligned regions according to their fit in the structural environment of the template structure. Models are build using Modeller program.
3.3.1.4 Phyre2
23
3.3.1.5 Robetta
Robetta server provides ab initio and comparative models.[89]–[91] The server uses Ginzu
protocol that identifies templates and predicts the domain regions that are aligned to PDB templates with reasonable confidence. The comparative models are built from templates detected and aligned by HHSearch/HHpred[92], RaptorX[93] and Sparks-X[94] programs. When domains don’t have a PDB homolog to serve as template, one is modeled with the Rosetta de novo protocol.
3.3.1.6 Swiss model
For the WrbA modeling was used the Swiss model server in fully automated mode.[95]– [97] The requested templates are identified by the homology modeling pipeline based on BLAST
and HHBlits[98]. The templates ranked according to their estimated quality are selected and modeled using PROMOD-II[99] and Modeller.
All the steps (Template selection, Model building and Structure quality evaluation) are executed and can be invoked in the Workspace.
3.3.2 Model results evaluation
The best models obtained from each server were selected to be ranked according to SFCheck server[100],[101] results.
SFCheck server evaluates:
i) Atomic Clashes: unfavorable interactions where atoms are too close together ii) Peptide Linkage: C-N bonds distance that outlier outside the accepted range for the
peptide bond (1.30-1.45).
iii) Covalent Geometry: Bond angles that outlie outside the standard values. iv) Chirality Error: detect chiral center with wrong chirality.
v) Phi/Psi torsion angles: identifies phi/psi torsion in forbidden region of Ramachandran plot.
The models approved by this server were submitted at SAVES v.4 server[102] for a more detailed validation. It runs the following programs:
i) PROCHECK[103]: Analyze the stereochemical quality residue-by-residue and the overall structure geometry.
ii) WHAT Check[104]: Does intensive checking of many stereochemical parameters of the residues.
iii) ERRAT[105]: Analyze the statistics of non-bonded interactions between different atoms types and compares with statistics from highly refined structures.
24
v) PROVE[108]: Calculate a statistical Z-score deviation from highly resolved (2.0 Å or better) and refine (R-factor of 0.2 or better) PDB-deposited structures.
vi) Ramachandran Plot: Produce a interactive Ramachandran plot.
Also the QMEAN score of the pass models are generated by the Swiss Model QMEAN server for quality model estimation.[109],[110]
3.3.3 Model Refining
The WbrA model was minimized in UCSF Chimera v.1.10.1[111]. This tool moves the system toward a local minimum without crossing energy barriers.[112] The minimizing procedure have the following default parameters:
Steepest descent steps (default 100)
Steepest descent step size (Å) (default0.02)
Conjugate gradient steps (default10)
Conjugate gradient step size (Å) (default0.02)
Update interval (default10)
Fixed atoms -none (default)
However, Chimera calls first the Dockprep tools to perform the following tasks:
i) AddH to add hydrogens. This step also considers H-bonds and Histidine, Glutamic
acid, Aspartic acid, Lysine and Cysteine was protonated based on residue name.
ii) Add Charge to associate atoms with partial charges and other force field
parameters. Standard residues parameters were assigned from AMBER ff14SB force fields.[113]
3.3.4 Docking
Docking is basically modeling the quaternary structure, i.e. predict the orientation and interaction of the macromolecular complex as it would occur in a living organism. It is assumed that the contacts occur at the surface by non-covalent bonds. All docking processes can be resumed in three stages: search, filter and score.
Docking result must be integrated to data from mutagenesis, cross-linking, spectroscopy, reaction mechanism, active sites or machine learning.
3.3.4.1 Dps and WrbA interaction
25
functions to calculate and score the docking, balanced, electrostatic favored, hydrophobic favored and Van der walls + electrostatic (vdw+elec) (annex 8.7).
3.3.5 Additional Bioinformatic tools
Two bioinformatics tools, Predict protein and Consurf, were assessed in order to find complementary structural information about Dps. The services provided by these tools are described in the next table.
27
4 . Results and Discussion
4.1 Plasmid preparation
The efficiency of the plasmid isolation and purification was evaluated by electrophoresis in an agarose gel. The electrophoresis profile (figure 13) a major band with higher mobility corresponding to the supercoiled form of the DNA allowing the progression of the work; two minor bands are also present attributed to different conformations of DNA.
Figure 13 - Electrophoresis analysis of pET21c-Dps(wt) minipreps in agarose gel. Lane 1-NZYDNA Ladder III (Nzytech) Molecular weight marker.[118] Lane 2-5) pET21c-Dps(wt) more concentrated (was applied 3μL of plasmid) and Lane 6-9) less concentrated samples (was applied 3μL of plasmid).
Transformation of E. coli BL21(DE3) competent cells with the previous plasmid DNA
was successful. Isolated transformants were observed in the LB-ampicillin-agar plates. No colonies were detected on the negative control plate showing no contamination.
4.2 Overproduction of Dps(wt)
The growth curve of E. coli cells harboring the pET21c-Dps(wt) expression vector for
Dps production is presented on figure 14. After 3 h and 30 min, the expression of Dps encoding gene was induced with IPTG at an OD600nm of 0.53.
1 2 3 4 5 6 7 8 9
28
Figure 14 - Growth curve of E. coli BL21(DE3) harboring the pET21c-Dps(wt) expression
vector. The vertical line indicates the time of induction with 0.5 mM IPTG.
The protein expression profile along the growth curve, assessed by SDS-PAGE, is shown in figure 15. The gel reveals an intensive band with an apparent molecular mass around 18 kDa due to the high level of production of Dps (lane 3). The presence of a very intense band in the supernatant of the ultracentrifugation step confirms the production of the protein in a soluble form (lane 6).
Figure 15 - SDS-PAGE analysis of the production of Dps in E. coli BL21(DE3). Lane 1 - LMW
protein weight Marker (Nzytech);[119]
lanes 2 and 3 - Protein profile at t=0 h and after 3 h of induction of gene expression with 0.5 mM IPTG, respectively; Lanes 4 and 5 - Supernatant and pellet, respectively, from the low speed centrifugation; Lanes 6 and 7 - Supernatant and pellet from the ultracentrifugation.
Under the tested experimental conditions, 2.3 g of wet cells were obtained per liter of culture.
1 2 3 4 5 6 7
96.0 66.0
48.0 40.0
32.0
26.0
29
4.3 From cell lysis to purification of Dps
The purification of Dps protein was accomplished using 3 chromatographic steps of a weak anionic exchanger, size exclusion and strong anionic exchanger, in this sequence. Typical elution profiles of each column are presented in figures 16 to 18.
In the first chromatographic step, with a DEAE-Sepharose column, adsorbed proteins were eluted with a discontinued linear gradient of 10 mM Tris-HCl pH 7.6 with NaCl (figure 16). Dps containing fraction were eluted between 210 and 265 mM of NaCl (i.e. 42% to 53% of elution buffer), pooled and loaded into a Superdex 200 column (figure 17). The most impure fractions from were further purified in a third step using the buffer system of the first chromatographic column (figure 18). Pure Dps was eluted from the Q-resource column between 104 mM and 144 mM of NaCl (52-72% of elution buffer).
All collected fractions were analyzed by SDS-PAGE for purity assessment and tested for catalase.
30
Figure 17 - Elution profile of the gel filtration Superdex 200 column (1.6 x 49 cm) used as the 2nd purification step of Dps(wt). Proteins were eluted with 10 mM Tris-HCl pH 7.6 with NaCl at a
flow rate of 1.5 mL/min. Fractions were collected in 2 mL.
Figure 18 - Elution profile of the 3rd purification step on a Q-Resource column (6 mL) of
Dps(wt). Elution was performed with 10 mM Tris-HCl pH 7.6 with NaCl (Buffer B) at a flow rate of 1 mL/min. 2 mL samples were collected. The zone marked at grey corresponds to the Dps elution.
31
Figure 19 – Purity assessment of final pooled fractions during purification of Dps(wt). Lane 1 – LMW protein marker (Nzytech);[119]Lane 2 and 3 – Pure and impure Dps fractions, respectively, obtained after 3 chromatographic steps; Lane 4 – Dps fraction with a trace of catalase. For all was applied 0.5 μL of protein.
As referred before, presence of catalase was assessed by the addition of hydrogen peroxide. In the following figure (figure 20), a typical example of fractions with and without catalase is presented. As can been seen, when catalase is present, this protein catalyze the formation of O2 (gas) and H2O using H2O2 as substrate.
Figure 20 – A typical catalase test. 1 - Negative result; 2- Positive result.
Since hydrogen peroxide was not a substrate in the kinetic assays, the presence of traces of catalase will not be a problem, and thus was used for the following experiments.
1 2 3 4
1 2
66.0
48.0
40.0
32.0
26.0
18.5 kDa
32
4.4 Modeling WrbA
4.4.1 3DJigsaw
Results of the search in Pfam indicate that our target sequence matches the NADPH-dependent FMN reductase (pf03358.10). The PFam alignment result has 60% identity and an e-value of 6x10-56. Five structural templates from PDB search were selected to model.
Table 6- Best templates from alignment in 3DJigsaw.
4.4.2 HHPred/Modeller
The top four PDB structures obtained from HHPpred analysis were selected to be used as templates for modeling. The multiple alignment of the 4 templates with the query serves as input for Modeller.
Table 7- Templates select for multiple alignment in Modeller.
33
4.4.3 M4T
M4T Server uses only one template. For that reason, flavoprotein WrbA (PDB: 3zho_A), with the top score according to HHPpred analysis, was used as template. The alignment of the template sequence do not covered the first aminoacid of the target sequence. The resulting model has a DOPE score of -21224.359375 and a z-score of -8.76.
4.4.4 Phyre2
For Phyre2 server used a E.coli flavoprotein WrbA (PDB:c3b6iB) with 77% identity and
whose alignment covers the residues 2-199 of the query sequence. The template’s probability
to be homologous to the target, i.e. the confidence, is 100%. Thus, after excluding the first residue of the query sequence from the alignment, modeling by ab initio was performed.
4.4.5 Robetta
Ginzu protocol found a domain for modeling, 4la4A that span the whole query sequence. The confidence is 95.14%.
4.4.6 Swiss Model
The 4 hit template obtained by the alignment performed in the Swiss Model server were selected to model.
Table 8- Detailed results for the 4 best models.
4.5 Modeling validation
4.5.1 SFCheck
34

![Figure 3- Iron uptake by a gram– bacterial cell. Figure adapted from reference [19].](https://thumb-eu.123doks.com/thumbv2/123dok_br/16503178.734124/27.892.256.629.559.1047/figure-iron-uptake-gram-bacterial-figure-adapted-reference.webp)