Ana Teresa Silva Semeano
Licenciatura em BioquímicaNovel gas sensors and electronic noses for optical, electrical and
hybrid sensing: development, properties and applications.
Dissertação para obtenção do Grau de Mestre em
Biotecnologia
Orientador: Prof. Doutor Jonas Gruber, IQUSP
Coorientadora: Prof.ª Doutora Ana Cecília Afonso Roque,
REQUIMTE-FCT/UNL
Júri:
Presidente: Prof. Doutor Pedro Miguel Ribeiro Viana Baptista
Arguente: Prof. Doutor João Carlos da Silva Barbosa Sotomayor
Ana Teresa Silva Semeano
Licenciatura em Bioquímica
Novel gas sensors and electronic noses for optical, electrical and
hybrid sensing: development, properties and applications.
Dissertação para obtenção do Grau de Mestre em
Biotecnologia
Orientador: Prof. Doutor Jonas Gruber, IQUSP
Coorientadora: Prof.ª Doutora Ana Cecília Afonso Roque,
REQUIMTE-FCT/UNL
Júri:
Presidente: Prof. Doutor Pedro Miguel Ribeiro Viana Baptista
Arguente: Prof. Doutor João Carlos da Silva Barbosa Sotomayor
iii
Novel gas sensors and electronic noses for optical, electrical and hybrid sensing:
development, properties and applications.
Copyright Ana Teresa Silva Semeano
Faculdade de Ciências e Tecnologia
Universidade Nova de Lisboa
v
Agradecimentos
Começo com um agradecimento muito especial ao meu orientador Prof. Doutor Jonas Gruber que me direcionou e muito me ajudou, tornando possível todo o trabalho desenvolvido nesta tese, agradeço a confiança e crença depositada em mim, o conhecimento e as conversas sábias, as palavras certas no momento certo, a paciência e dedicação incansável, a força, a coragem, o positivismo e os segundos planos, as oportunidades que contribuíram em muito para o crescimento profissional e pessoal durante o último ano, as experiências inesquecíveis, a amizade e os cuidados incondicionais durante toda a minha estadia em São Paulo, e tudo o mais que fez por mim, não podendo expressar por palavras a minha profunda gratidão.
Agradeço à minha coorientadora Prof.ª Doutora Cecília Roque pela oportunidade e encorajamento de embarque neste projeto, que superou muito as minhas expectativas, os conselhos, o interesse, o acompanhamento, o suporte, a orientação e todo o apoio. Agradeço ao Doutor Abid Hussain pela contribuição e partilha de conhecimento no desenvolvimento deste trabalho.
Adicionalmente, agradeço à FCT, ao IQUSP, à FAPESP a ao CNPq e pelo apoio financeiro que contribuiu para a realização desta tese.
vi
Um obrigado a todos os colegas do Laboratório de Síntese de Polímeros Condutores do IQUSP pelo companheirismo, troca de desabafos, momentos de tensão e descontração e assiduidade nos almoços do bandejão e agradeço ainda ao técnico Francisco pela disponibilidade. Aos membros do Laboratório de Engenharia Biomolecular da FCT-UNL sou grata pela contribuição com ideias e discussões de carácter científico.
Aos amigos que tive a oportunidade de conhecer, com os quais partilhei as condições de imigrante no Brasil, agradeço todos os bons momentos, as partilhas e ajudas diárias a Lourdes, Cristiana, Esmar, Gustavo, Ricardo e Lucas. À minha pequena Elina, quero agradecer pelo acolhimento desde o primeiro momento, como membro da sua família.
Aos amigos em Portugal agradeço a todos por me terem mantido sempre presente quando saudades apertavam, em particular agradeço pelo ombro de apoio e pela força às minhas best friends Susana, Caralinda, Sónia, Ana Isabel, Tânia e Tatiana. Agradeço ainda a alguns amigos que me deram uma ajuda extra, David e Joaquim, ao Luís agradeço a partilha de informação diária e à Helena a amizade e companhia em tempos de luta e escrita de tese.
vii
Abstract
Smell is one of the most important senses of man. It is used in everyday life, influencing our behaviour. Evaluation of the quality of food and beverages or the production control in industries that require specialised personnel, are some examples of its use. The Electronic Nose mimics the human nose, through the transduction of a chemical interaction between a sensitive layer and the volatile compounds, generating a measurable signal. Conducting polymers, doped with dodecylbenzenesulfonic acid, employed in electrical gas sensors and in an electronic nose showed their applicability in monitoring the circadian emissions of fragrance by the plant Madagascar Jasmin and in the discrimination and classification of different samples of flaxseed, respectively.
An innovative approach in the development of sensitive thin films based on organized liquid crystal micelles in an ionic liquid, encapsulated in a biopolymer matrix and used as sensitive layers for gas sensors, is the focus of this thesis. Liquid crystal micelles acting as sensitive elements that change reversibly their orientation in the presence of volatile compounds showed, as a proof of concept, their potential use in the classification of volatile solvents. They were also successfully tested for monitoring the quality of Tilapia fish. The combination of this optical system with the electrical system gave the so called "hybrid sensor" with dual response. Thus, a single sensor was efficient in the quantification of ethanol in gasoline. Polarized light microscopy, SEM and AFM techniques were used to study the morphology of these layers and have revealed that the formation of the micelles is closely influenced by the solvent where the liquid crystal molecules are arranged. QCM studies were conducted in order to learn more about the interaction of these films with volatile compounds, and to check the influence of parameters such as the exposure time, solvent nature, film composition and drying time, on the film. These biopolymer films were also used as immobilisation matrix for cytochrome c, forming electrochemical sensors having an additional optical response.
ix
Resumo
O olfato é um dos mais importantes sentidos do homem usados no quotidiano, que influencia o nosso comportamento. Avaliação da qualidade de alimentos e bebidas ou o controlo de produção em indústrias, que requer pessoal especializado, são alguns exemplos. O Nariz Electrónico mimetiza o nariz humano, através da transdução de uma interação química, entre uma camada sensitiva e os compostos voláteis, num sinal mensurável. Polímeros condutores dopados com ácido dodecilbenzenossulfónico empregues em sensores elétricos de gás e nariz electrónico mostraram a sua aplicabilidade na monitorização da emissão circadiana de fragrâncias pela planta Jasmin de Madagascar e discriminação e classificação de diferentes amostras de linhaça, respectivamente.
Uma abordagem inovadora no desenvolvimento de filmes finos sensíveis basedos em micelas organizadas de cristal líquido em liquído iónico encapsuladas numa matriz biopolimérica, usados como camadas sensíveis em sensores de gás, foram o foco desta tese. Micelas de cristal líquido como elementos sensíveis que alteram, reversivelmente, a sua orientação na presença de compostos voláteis mostraram a sua potencialidade na classificação de solventes como prova de conceito do princípio sensorial e na monitorização da qualidade de peixe Tilápia. A combinação
deste sistema óptico com o sistema elétrico deu origem a um sensor de dupla resposta, “sensor hibrido”, em que um único sensor se mostrou eficiente na quantificação de etanol em gasolina. Técnicas de microscopia de luz polarizada, AFM e SEM, usadas no estudo morfológico destas camadas, revelaram que a formação destas micelas está intimamente relacionada com o solvente onde as moléculas de cristal líquido estão arranjadas. Por QCM foram feitos estudos de interacção com compostos voláteis e a influencia do tempo de exposição, natrureza do solvente, composição e tempo de secagem do solvente. Estas camadas biopoliméricas sensíveis foram ainda usadas como base de imobilização de citocromo c para formar sensores eletroquímicos com uma resposta óptica adicional.
xi
Contents
Abstract ... vii
Resumo ... ix
Index of figures ... xv
Index of tables ... xix
List of abbreviations ... xxi
1 Literature review ... 1
1.1 Gas sensors and electronic noses ... 3
1.1.1 Perception of odours ... 3
1.1.2 Evolution ... 6
1.1.3 Concept ... 8
1.1.4 Response ... 9
1.2 Types of gas sensors ... 11
1.2.1 Principles of transduction ... 11
1.2.2 Electrical sensors ... 14
1.2.3 Optical sensors... 15
1.2.4 Future prospects... 16
2 Objectives ... 17
3 Materials and methods ... 21
3.1 Materials ... 23
3.1.1 Chemical and biochemical compounds ... 23
3.1.2 Equipment... 24
3.1.3 Software ... 25
3.2 Methods ... 27
3.2.1 Conducting polymers based sensors ... 27
3.2.1.1 Production of the sensitive layer ... 27
3.2.1.2 Construction of the sensors ... 27
3.2.1.3 Application in electrical gas sensors and electronic noses ... 28
xii
3.2.1.3.2 Discrimination among commercial flaxseed brands ... 29
3.2.2 Liquid crystal-ionic liquid-biopolymer based sensor ... 31
3.2.2.1 Production and optimization of the sensitive biolayer ... 31
3.2.2.2 Application in optical gas sensors ... 32
3.2.2.2.1 Construction of the sensor ... 32
3.2.2.2.2 Optimization of the sensor response ... 34
3.2.2.2.3 Proof of concept: Detection and classification of volatile solvents ... 35
3.2.2.2.4 Quality control of fish ... 36
3.2.2.3 Application in hybrid gas sensors ... 38
3.2.2.3.1 Construction of the sensor ... 38
3.2.2.3.2 Quantification of the ethanol in fuel ... 38
3.2.2.4 Interaction studies of biopolymeric sensitive films ... 39
3.2.2.5 Morphological studies of biopolymeric sensitive films ... 40
3.2.3 Cytochrome c based biosensor ... 41
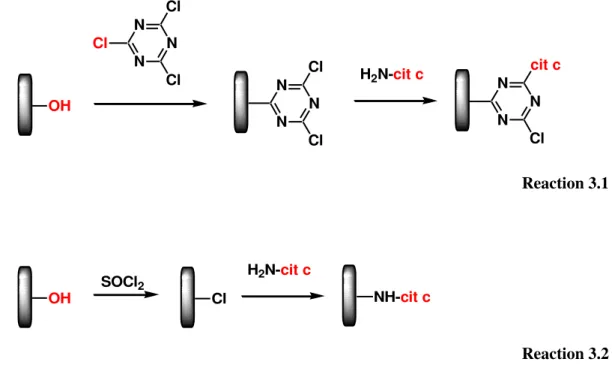
3.2.3.1 Production and optimization of the sensitive proteic biolayer ... 41
3.2.3.1.1 Immobilisation of cytochrome c by covalent binding ... 42
3.2.3.1.2 Immobilisation of cytochrome c by encapsulation ... 43
3.2.3.2 Spectroscopic studies of the proteic sensor ... 43
3.2.3.3 Electrochemical studies of the proteic sensor ... 43
3.2.3.4 Application in the detection of nitric oxide ... 44
4 Conducting polymers based sensor ... 45
4.1 Introduction ... 47
4.2 Results and discussion ... 49
4.2.1 Monitoring fragrances emitted by flowers ... 49
4.2.2 Distinction between different commercial brands of flaxseed ... 52
4.3 Conclusions ... 55
5 Liquid crystal-ionic liquid-biopolymer based sensor ... 57
5.1 Introduction ... 59
5.2 Results and discussion ... 61
5.2.1 Applications in optical gas sensors ... 61
5.2.1.1 Optimization of the sensor response ... 61
5.2.1.1.1 Composition of the sensitive films ... 61
xiii
5.2.1.2 Proof of concept: distinction of solvents ... 66
5.2.1.3 Quality control of fish ... 68
5.2.2 Applications in hybrid gas sensors ... 72
5.2.2.1 Quantification of ethanol in fuel ... 72
5.2.3 Quartz crystal microbalance studies of the interaction of the sensitive layers with volatile compounds ... 77
5.2.3.1 Influence of the exposure time ... 78
5.2.3.2 Influence of the film components ... 78
5.2.3.3 Influence of the drying time of the film ... 80
5.2.3.4 Influence of the nature of the solvent ... 81
5.2.4 Morphological studies of sensitive layers ... 82
5.2.4.1 Polarised light microscopy ... 82
5.2.4.2 Atomic force microscopy ... 83
5.2.4.3 Scanning electron microscopy ... 84
5.3 Conclusions ... 87
6 Cytochrome c based biosensor ... 89
6.1 Introduction ... 91
6.2 Results and discussion ... 93
6.2.1 Composition of the sensitive biolayer ... 93
6.2.2 Electrochemical studies ... 95
6.2.3 Spectroscopic studies ... 99
6.2.4 Application in the detection of nitric oxide ... 101
6.3 Conclusions ... 103
7 Conclusion ... 105
xv
Index of figures
Figure 1.1. The human olfactory system. Transmitting to the brain, the signal generated by
recognizing the analyte in the olfactory epithelium. Adapted from Rinaldi (6). ... 4
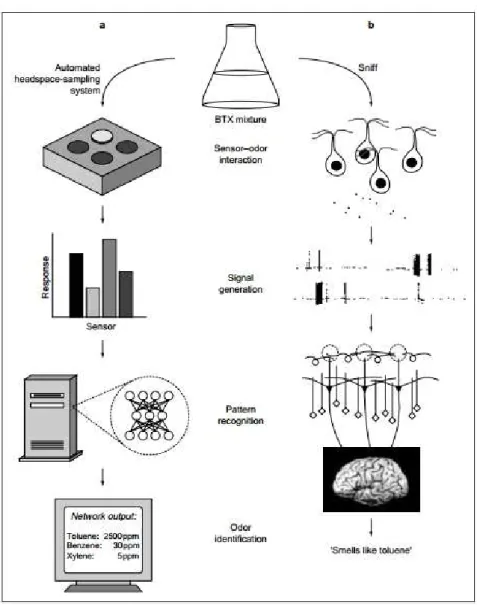
Figure 1.2. Basic analogies between artificial and biological olfaction. Volatiles from a BTX (benzene–toluene–xylene) mixture are (a) collected by an E-nose and each sensor, in response to analyte interaction, sends a signal to a computer that identifies and quantifies the compounds with a pattern recognition algorithm; (b) inhaled by human nose enabling that specific receptors bond the analyte and the information is sent to the bulb through action-potential producing patterns that are recognized and which in turn are sent to the brain, where the input information is reconstructed (9). ... 5
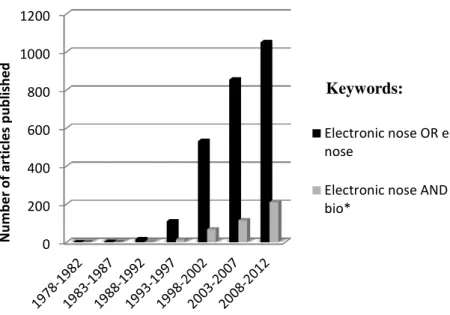
Figure 1.3. Growing number of published articles on electronic nose, estimated in the last 30 years. Source: Thomson Reuters’ Web of Science. Topics search with the words: electronic nose or E-nose (in black); electronic nose and bio* (in gray). ... 7
Figure 1.4. E-nose sensor response to an odorant. Adapted from Arshak et al. (28). ... 9
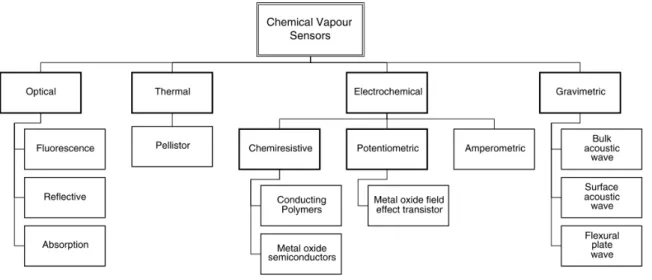
Figure 1.5. Main types of sensors applied in electronic noses (25). ... 11
Figure 2.1. Schematic diagram of the aims of this thesis. ... 19
Figure 3.1. Chemical structures of the oligomers and polymers used as sensitive layer in gas sensors: ... 27
Figure 3.2. Layout of a chrome interdigitated electrode with 1 cm2 of sensorial area and 20 m of spacing between digits. ... 28
Figure 3.3. Preferred arrangement for flower fragrance detection ... 29
Figure 3.4. Configuration of the pneumatic system used for sampling. ... 30
Figure 3.5. Optical sensor. The liquid crystal-ionic liquid-biopolymer forms a regular film onto a glass substrate. ... 32
Figure 3.6.Transducer’s unit of the optical device. ... 33
Figure 3.7. Schematic electrical circuits forming the electronic optical sensor: A) Electrical circuit for powering the LEDs circuit; 100 Ω 1/8 W (R1-R4) B) Electrical circuit for the LDRs, NSL19-M51 (LDR1-LDR4). ... 34
Figure 3.8. Electrical circuit of the stabilised 5 VDC power supply. The circuit uses a transformer 110/2x7,5 V (TR1); Two diodes 1N4002 (D1, D2), a 7805 Voltage Regulator (IC1) and three capacitors: two 2200 µF / 25 V electrolytic capacitors (C1, C3) and a 0.1 µF / 250 V polyester capacitor (C2). ... 34
Figure 3.9. Configuration of the sensor/sample box system used for long term tests. ... 36
Figure 3.10. Electrical circuit of the stabilised 5 and 12 VDC power supply and electrical circuit to control the opening / closing of the gate between sample and sensor compartments. Components are: a transformer 110/9 VAC (TR1); a 7805 voltage regulator; and three capacitors: two 2200 µF / 25 V electrolytic capacitors (C1, C3) and a 0.1 µF / 250 V polyester capacitor (C2); a 1A/400V rectifying bridge (D1); 1N4004 (D2); 5V relay (RL1); 12 V solenoid valve (SV1); 10kΩ 1/8W (R1); BC 237 (Q1); normally open press bottom switch. ... 37
Figure 3.11. Schematic diagram of the system used for the measurements with the QCM. Legend: blue arrows represent fresh air, and yellow arrows VOCs saturated air; green valves represent open valves and red valves, closed valves. ... 40
xvi
Figure 3.13. Graphite Florence Sensors (G-sensors). ... 44 Figure 4.1. Electrical admittance vs. time which represents the release of VOCs by flowers of S. Floribunda. ... 50 Figure 4.2 Admittance over time for day 1 (continuous line) and day 2 (dashed line), representing the emissions of volatile compounds by S. Floribunda flowers. ... 50 Figure 4.3. Admittance recorded in function of time in response to the fragrance emitted by S. Floribunda flowers. Data have been corrected using a control sensor. ... 51 Figure 4.4. Admittance measurements over time from four different electrical gas sensors based on conducting polymers, during analysis of sample 1. ... 53 Figure 4.5. Pattern of recognition for nine commercial brands of flaxseed by combination of the relative responses of the four electrical gas sensors used. ... 54 Figure 4.6. PCA scatter plot of nine flaxseed samples. Each number corresponds to a trademark of flaxseed meal. Odd numbers correspond to the brown variety (circled in brown) and even numbers to the golden variety (circled in yellow). ... 54 Figure 5.1. Variation of conductance obtained by optical sensors during the exposure to
chloroform vapours. A, B, C and D correspond to films with different compositions (see Table 5.1). ... 63 Figure 5.2. LDR relative response vs. wavelength of the incident light (86). ... 64 Figure 5.3. Response of an optical sensor when exposed to the light of a white LED or to
monochromatic red, green or blue LEDs (forward current of 20 mA). ... 64 Figure 5.4. Conductance response in function of the series resistor used for regulating the
luminous intensity of a white LED. Data obtained by exposing optical sensors to three
exposure/recovery cycles of ethanol vapours/fresh air, respectively. ... 65 Figure 5.5. Conductance of three optical sensors with different compositions:1) Gelatine, dextran and [BMIM][DCA]; 2) Gelatine, sorbitol and [BMIM][DCA]; 3) Gelatine, dextran and
xvii
Figure 5.17. Variation of the frequency and the dissipation over time by QCM device, for
exposures (5 s, 10 s, 20 s and extended exposure time) to acetone, ethanol and hexane vapours.. 81 Figure 5.18. Image of LC-IL-BP sensitive layers visualised in optical microscope under a) non polarised light; b) under half crossed polarisers and c) polarised light ... 83 Figure 5.19. Image of LC-biopolymeric sensitive layers without IL visualised in optical
microscope under a) non polarised light; b) under half crossed polarisers and c) polarised light .. 83 Figure 5.20. Image of gelatine and LC micelles based sensitive layers A) with and B) without IL, obtained by AFM. ... 84 Figure 5.21 SEM micrographs of the surface of the sensitive layers with IL - A) before and B) after drying; and without IL – C) before and D) after drying. C1 is a LC droplet surface (2,500×) of film without IL, before drying. ... 85 Figure 5.22. Diameter distribution of the LC micelles / droplets in biosensitive layers: A) with IL before drying, B) with IL, after drying; C) without IL before drying; and D) ) without IL, after drying... 86 Figure 6.1. Ribbon diagram of horse heart cytochrome c, based on crystallographic structure (99). ... 91 Figure 6.2. Cyclic voltammograms of sorbitol-gelatine films - control (black), and sorbitol, sorbitol-gelatine films with cytochrome c encapsulated, after 1 day (blue) and after 6 days (green). The cyclic voltammetry was performed in solid medium, using FS-1 electrodes, with graphite working and counter electrodes and a silver peseudoreference... 96 Figure 6.3. Cyclic voltammograms of FS-1 electrodes containing cytochrome c immobilised in biopolymer in the presence of oxygen (green) and in nitrogen atmosphere (blue), in solid medium. Scan rate of 50 mV s-1. ... 97
Figure 6.4. Cyclic voltammograms of FS-1 electrodes containing cytochrome c encapsulated in biopolymer, in PBS 0.1 mol L-1 pH 7.4, at several scan rates. ... 98
xix
Index of tables
xxi
List of abbreviations
5CB– 4-Pentyl-4’-cyanobiphenyl 7TM – Seven transmembrane AFM– Atomic force microscopy
[ALOCIM][CL] – 1-Allyl-3-octylimidazolium chloride APS– Ammonium persulfate
[BMIM][Br] – 1-Butyl-3-methylimidazolium bromide [BMIM][Cl] – 1-Butyl-3-methylimidazolium chloride [BMIM][DCA] – 1-Butyl-3-methylimidazolium dicyanamide [BMIM][FeCl4] – 1-butyl-3-methylimidazolium tetrachloroferrate
[BMIM][SO4] – 1-Butyl-3-methylimidazolium sulfate
BP-ANN– Back-propagation artificial neural network CFU– Colony-forming units
CP– Conducting polymers CV – Cyclic voltammetry E-nose – Electronic nose
[EMIM][DCA] – 1-Ethyl-3-methylimidazolium dicyanamide
FCT/UNL – Faculdade de Ciências e Tecnologia da Universidade Nova de Lisboa FETs– Field effect transistors
FOS– Fibre optical sensor
G-sensors – Graphite Florence Sensors IL– Ionic Liquid
xxii ipc– Cathodic peak current
IQUSP– Instituto de Química da Universidade de São Paulo ITO– Indium tin oxide
LBL – Layer-by-layer LC– Liquid crystal
LC-IL-BP – Liquid crystal - ionic liquid – biopolymer LDR– Light dependent resistor
LED– Light emitting diode
LVQ – Learning vector quantisation
MOSFET– Metal oxide semiconducting field effect transistor ORs– Odorant receptors
PBS– Phosphate buffered saline PCA– Principal component analysis PNN– Polynomial neural network QCM – Quartz crystal microbalance Ra– Relative response
SEM– Scanning electron microscopy
SERS– Surface-enhanced Raman spectroscopy SIFT-MS– Selected ion flow tube mass spectrometry TEMED– N,N, N,N- Tetramethylethylenediamine
TNT - Trinitrotoluene
1
3
1.1
Gas sensors and electronic noses
1.1.1
Perception of odours
The ability to detect chemicals in the environment is critical for the survival of most prokaryotic and eukaryotic organisms. The best indication of the importance of olfactory systems in higher eukaryotes is the significant proportion of the genome (up to 4%) that is devoted for encoding products used in building olfactory sensory tissues. The mammalian olfactory system has the extraordinary capacity to combine high sensitivity with broad-band detection and discrimination, therefore being recognized as one of the most effective sensing systems. The sense of smell is one of the most important senses for human beings, often controlling behaviour in our daily lives such as evaluating the quality of foods, drinks and cosmetics or in industries, where the control of production is made by trained people that work short periods of time.
The perception of volatile compounds has great importance, but the task of odour identification is a complicated process, since smells can be a complex mixture of many hundreds of chemical species. Often even subtle changes in the relative amounts of those odorant molecules can be detected as a change in odour. Odorant molecules are typically small, with molecular mass below 350 Da (1). The volatility of molecules is also affected by the strength of intermolecular interactions that is dependent, not only on the weight, but also on the nature of the elements, shape and charge distribution of each molecule (Table 1.1), being non-polar molecules usually more volatile than polar ones (2–4). The polar group of molecules frequently contains oxygen, nitrogen and/or sulphur moieties (1).
Table 1.1. Properties of simple organic and inorganic molecules.
Molecular formula
Dipole moment
Relative molecular mass (g mol−1)
Boiling point (ºC)
Methane CH4 0 D 16.04 -162.0
Ethane C2H6 0 D 30.07 -88.6
Butane C4H10 0 D 58.12 -0.5
Isobutane C4H10 0 D 58.12 -12
Acetone C3H6O 2.91 D 58.08 56
Water H2O 1.85 D 18.01 100.0
Ammonia NH3 1.42 D 17.03 -33.4
Hydrogen sulfide H2S 0.97 D 34.08 -60.7
4
transmembrane (7TM) (5) which are activated by the binding of the analyte. Signals generated in these neurons, in response to odorants, are relayed in well-defined micro-regions in the olfactory bulb, the glomeruli. Receptor cells of the same type converge to the same glomerulus. In the glomerulus, the receptor nerve endings excite mitral cells that forward the signal to higher regions of the brain, the olfactory cortex (6, 7).
Figure 1.1. The human olfactory system. Transmitting to the brain, the signal generated by recognizing the
analyte in the olfactory epithelium. Adapted from Rinaldi (6).
It is estimated that humans can sense as many as 10 000 to 100 000 chemicals as having distinct odour, with 1000 different olfactory receptors (OR) inserted in a highly complex system. Each OR recognize multiple odorants, each odorant can be detected by different ORs and different odorants are recognized by different combinations of ORs (7, 8).
5
Figure 1.2. Basic analogies between artificial and biological olfaction. Volatiles from a BTX (benzene– toluene–xylene) mixture are (a) collected by an E-nose and each sensor, in response to analyte interaction, sends a signal to a computer that identifies and quantifies the compounds with a pattern recognition algorithm; (b) inhaled by human nose enabling that specific receptors bond the analyte and the information is sent to the bulb through action-potential producing patterns that are recognized and which in turn are sent to the brain, where the input information is reconstructed (9).
Scientists have incorporate biological principles into the design of artificial devices however, principle, number of sensors, as well as the sensitivity and selectivity are still far from being comparable (10, 11). No correlation would be expected between the sensors response and the human odour perception because, for each case, aroma-active detectable compounds in mixtures are different(12).
6
1.1.2
Evolution
The first publication on gas sensors appeared in the 1960s when a thermistor coated with a material, such as polyvinyl chloride, gelatine or vegetable fat, was presented by Moncrieff in 1961 for monitoring odours. Then Moncrieff postulated that an array using six thermistors with non-specific coatings would be able to distinguish different smells (15). Eight different electrochemical cells to obtain different patterns of response for different odorant samples were employed, by Wilkens and Hartman in 1964 (16). However, computers available at that time were not powerful enough for the needed pattern recognition process. Despite the potential of these studies and others that have followed, only in 1982 Persuad and Dodd introduced the electronic nose concept, proposing that discriminations in olfactory system could be achieved without the use of highly specific receptors, with a device based on conducting transducers, mimicking the mammalian's nose (17).
The term “electronic nose” appeared in the literature for the first time in 1988 as a generic term for an array of chemical gas sensors incorporated into an artificial olfaction device and, in 1991, NATO conference was a landmark that has sparked interest of the scientific community by this topic (3). In 1994, Gardner and Bartllet defined electronic nose as an instrument, which comprises an array of electronic chemical sensors with partial specificity and an appropriate pattern-recognition system, capable of recognizing simple or complex odours (18). This definition is generally accepted nowadays.
In the 1990’s, the human nose was still the primary instrument used to sense smells. The
7
Figure 1.3. Growing number of published articles on electronic nose, estimated in the last 30 years. Source:
Thomson Reuters’ Web of Science. Topics search with the words: electronic nose or E-nose (in black); electronic nose and bio* (in gray).
The development of e-noses over the years has made enormous advances offering advantages such as lower analysis cost, portability, ease of use and shorter time of analysis, when compared to some classical methods such as gas chromatography, mass spectrometry and infrared spectroscopy. Descriptions of analytical methods involving e-noses can be found in books and review articles such as those of Gardner and Bartlett (1999), Pearce et al. (2003), and Rock et al. (2008) (3, 5, 13). It is now possible to solve difficult analytical problems with simple sensor arrays associated to a pattern recognition algorithm.
Many of the problems associated with e-noses such as weight, humidity and temperature dependence, the high cost, sensor poisoning, poor reproducibility and repeatability, high power consumption, relatively low sensitivity, and interference from other gases have been overcome in the last decade. However, time of response, stability, and portability are still included in the list of limitations that should be improved (9, 19, 20).
0 200 400 600 800 1000 1200 N u m b e r o f ar ticl e s p u b li sh e d
Electronic nose OR e-nose
Electronic nose AND bio*
8
1.1.3
Concept
Chemical sensors consist of transducers that incorporate a chemical detection layer and transform a chemical interaction with an analyte into a detectable physical signal, normally in real-time. E-nose is formed by a chemical gas sensor array, packed in a device, capable of sensing volatile compounds and identifying them with a pattern recognition system, simulating the human olfactory system (21). The pattern recognition algorithm associated to the e-nose extracts the signal information collected by the sensor array, comparing or associating them with known patterns stored in the memory. The fundamental idea of the electronic nose is that, although each sensor is nonspecific or has only partial selectivity to the analyte, a distinct pattern of responses produced by the sensors in the array can provide a fingerprint that allows classification and identification of odorants, showing the advantage of the cross-selectivity of the system.
There are many tools available for analysing data generated by an array of chemical sensors (22). According to Schaller et al. (1998), commercially available techniques fall into three main categories: graphical analyses, such as bar chart, profile, polar, and offset polar plots; multivariate analyses, employing statistical methods, such as principal components analysis, canonical discriminate analysis, feature weighting, and cluster analysis; and network analyses, more complex combinations, such as artificial neural network and radial basis function (23). The choice of the method depends on the available data and the type of result that is required. A comparison study of chemical sensor array pattern recognition algorithms carried out between seven algorithms and four datasets revealed that neural network–based algorithms - learning vector quantisation (LVQ), polynomial neural network (PNN), and back-propagation artificial neural network (BP-ANN) had the highest classification accuracies (24).
The interaction of the molecules with the sensor surface can occur through different binding mechanisms, such as adsorption, absorption, chemisorption and co-ordination chemistry and has important implications for the selectivity and reversibility of the sensing system. The specificity of detection is high in chemisorption and poor in adsorption while the reversibility is poor in chemisorption and high in adsorption (25).
9
robustness and durability; easy calibration; easy processable data output; small dimensions (26, 27).
An array with a large number of sensors does not necessarily imply in greater selectivity of an electronic nose. The selection of only a few sensors that generate the most independent possible responses for a collection of scents that will be analysed may guarantee the generation of unique response patterns and hence high selectivity (13). A wide variety of sensors that have been used in cross-reactive sensor arrays is presented in several review articles (21, 25).
1.1.4
Response
When a gas sensor is exposed to a reference gas, the signal obtained is considered the baseline. Changes to this signal are observed when the gas sensor is exposed to the gas in question. After replacing these volatile by the reference gas again, the signal returns to the baseline. Figure 1.4. E-nose sensor response to an odorant shows a typical exposure / recovery cycle.
Figure 1.4. E-nose sensor response to an odorant. Adapted from Arshak et al. (28).
11
1.2
Types of gas sensors
1.2.1
Principles of transduction
Several types of transduction mechanisms in sensors are categorized according to the nature of the physical signal they measure. The most common methods utilize transduction principles based on electrical measurements, including changes in current, voltage, resistance or impedance, electrical fields and oscillation frequency. Others involve measurements of mass changes, temperature changes or heat generation. Optical sensors measure the modulation of light properties or characteristics such as changes in light absorbance, polarization, fluorescence, optical layer thickness, colour or wavelength (colorimetric) and other optical properties. Figure 1.5 shows the main principles of the sensors used in e-noses.
Figure 1.5. Main types of sensors applied in electronic noses (25).
Among the most common sensors used in E-noses are metal oxide semiconductors (MOS), metal oxide semiconducting field effect transistors (MOSFET), electrochemical sensors, quartz crystal microbalance (QCM), surface acoustic wave (SAW), conducting polymers (CP) coated sensors, and optical sensors addressed in some review articles (25, 28, 29). Advantages and disadvantages of E-nose sensor types are summarized in Table 1.2.
12
Table 1.2 Summary of advantages and disadvantages of E-nose sensor types (30).
Sensor type Advantages Disadvantages
Calorimetric or catalytic bead
(CB)
Fast response and recovery time. High specificity for oxidized compounds
High temperature operation, only sensitive to oxygen-containing compounds
Catalytic field-effect sensors (MOSFET)
Small sensor size, inexpensive operating costs
Requires environmental control, baseline drift, low sensitivity to ammonia and carbon dioxide
Conducting polymer sensors
Ambient temperature operation, sensitive to many VOCs, short response time. diverse sensor coatings, inexpensive, resistance to sensor poisoning
Sensitive to humidity and temperature, sensors can be overloaded by certain analytes, sensor life is limited
Electrochemical sensors (EC)
Ambient temperature operation, low power consumption, very sensitive to many VOCs
Bulky size, limited sensitivity to simple or low molecular weight gases
Metal oxides semi-conducting
(MOS)
Very high sensitivity, limited sensing range, rapid response and recovery times for low molecular weight compounds
High temperature operation, high power consumption, sulphur and weak acid poisoning, limited sensor coatings, sensitive to humidity, poor precision
Optical sensors
Very high sensitivity, capable of identifications of individual compounds in mixtures, multi-parameter detection capabilities
Complex sensor-array systems, more expensive to operate, low portability due to delicate optics and electrical components
Quartz crystal microbalance
(QCM)
Good precision, wide range of sensor coatings, high sensitivity
Complex circuitry, poor signal-to-noise ratio, sensitive to humidity and temperature
Surface acoustic wave (SAW)
High sensitivity, good response time, many sensor coatings, small.
inexpensive, sensitive to virtually all gases
Complex circuitry, temperature sensitive, specificity to analyte groups affected by polymeric- film sensor coating
13
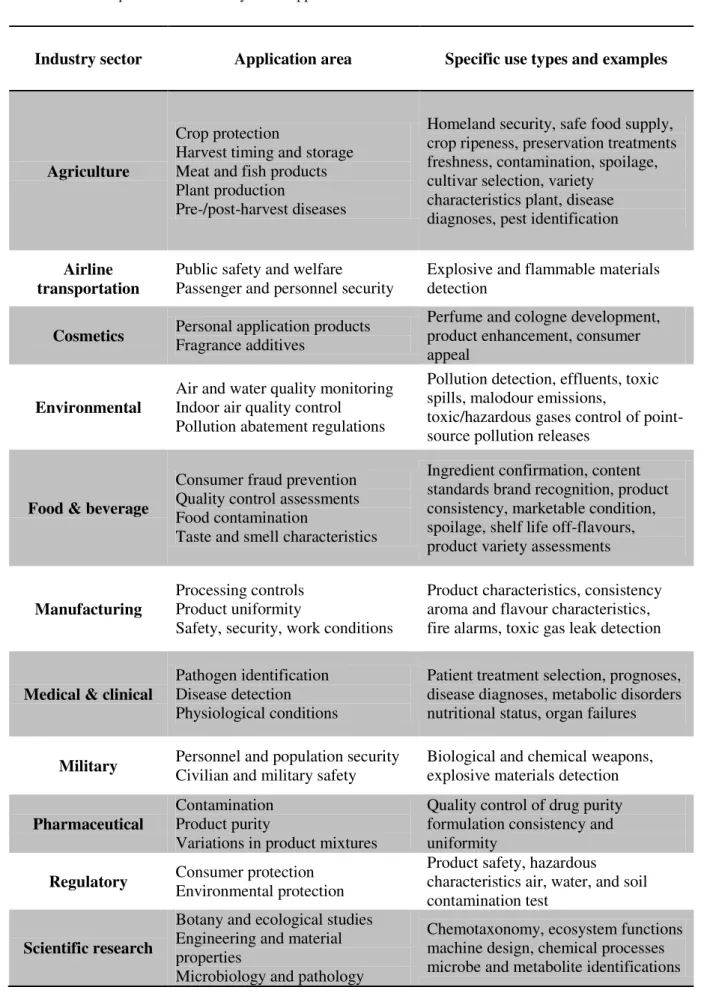
Table 1.3. Examples of some industry-based applications for electronic noses
Industry sector Application area Specific use types and examples
Agriculture
Crop protection
Harvest timing and storage Meat and fish products Plant production
Pre-/post-harvest diseases
Homeland security, safe food supply, crop ripeness, preservation treatments freshness, contamination, spoilage, cultivar selection, variety
characteristics plant, disease diagnoses, pest identification
Airline transportation
Public safety and welfare
Passenger and personnel security
Explosive and flammable materials detection
Cosmetics Personal application products Fragrance additives
Perfume and cologne development, product enhancement, consumer appeal
Environmental
Air and water quality monitoring Indoor air quality control Pollution abatement regulations
Pollution detection, effluents, toxic spills, malodour emissions,
toxic/hazardous gases control of point-source pollution releases
Food & beverage
Consumer fraud prevention Quality control assessments Food contamination
Taste and smell characteristics
Ingredient confirmation, content standards brand recognition, product consistency, marketable condition, spoilage, shelf life off-flavours, product variety assessments
Manufacturing
Processing controls Product uniformity
Safety, security, work conditions
Product characteristics, consistency aroma and flavour characteristics, fire alarms, toxic gas leak detection
Medical & clinical
Pathogen identification Disease detection Physiological conditions
Patient treatment selection, prognoses, disease diagnoses, metabolic disorders nutritional status, organ failures
Military Personnel and population security Civilian and military safety Biological and chemical weapons, explosive materials detection
Pharmaceutical
Contamination Product purity
Variations in product mixtures
Quality control of drug purity formulation consistency and uniformity
Regulatory Consumer protection Environmental protection
Product safety, hazardous
characteristics air, water, and soil contamination test
Scientific research
Botany and ecological studies Engineering and material properties
Microbiology and pathology
14
1.2.2
Electrical sensors
Processes of protonation/deprotonation, oxidation/reduction and conformational changes have a great and reversible influence on electrical properties of conducting polymers (CPs), allowing to use them as transducers. Conducting polymers are a family of materials with a wide range of physical and chemical properties that can be exploited to obtain analytical values from their electronic and electrochemical features. CPs have proved to have potential use in analytical methods for environmental monitoring with gas sensors, such as NH3, NO2 and trinitrotoluene
(TNT) detection (31).
Gases can interact with CPs through physical absorption or chemical reaction. Physical absorption of organic gases causing swelling of conducting polymers has been experimentally studied. This non-reactive process causes changes in the properties of materials that allow the detection of volatile compounds (32). In chemical reactions, the gas should be a good electron acceptor, namely it should have a higher electron affinity than the CP, changing the doping level of the polymer as, for instance, NO2 that was used as a charge carrier in polyaniline (33) and
polyaniline nanofibers (34), decreasing its resistance. Electrochemical sensors based on oxidation/reduction processes, including potenciometric, amperometric, voltammetric and chemiresistive sensors were previously reviewed by Bakker et al. (35) and Lange et al. (36), where their principles, as well as their numerous applications in gas sensors and E-noses are reported.
15
1.2.3
Optical sensors
The optical transducer may detect changes in different types of spectroscopy such as, for example, absorption, fluorescence, phosphorescence, surface-enhanced Raman spectroscopy (SERS), scattering, polarisation or refractive index (45–47), comprising a large number of explored principles that have been developed in the last decades for sensing systems. Greater availability of polymers and optoelectronic components in recent years has contributed to the development of optical sensors, useful in many different applications, in several fields, such as environmental monitoring, biotechnological processes and clinical diagnostics (48, 49). A recent progress in optical chemical sensors was reviewed by Qazi et al. (50). Several advanced individual gas detection techniques including non-dispersive infrared, spectrophotometry, tunable diode laser spectroscopy and photoacoustic spectroscopy were reviewed by Hodgkinson et al. (51).
Among the countless types of optical sensors, fibre optical sensor (FOS) has a potential market niche, since offers other interesting features, such as remote sensing, or even multiplexing sensors to measure different magnitudes in a single fibre. Dickinson et al. (1996) described a multi-analyte FOS based on the model of the olfactory system, in which dye polymeric molecules were immobilized on fibre tips giving different fluorescent response patterns, which were time dependent, allowing to distinguish VOCs (52). More recently, a study reported the FOS development, using an organometallic as sensing material, showing reversible changes in its optical properties in the presence of organic vapours, based on wavelength modulation. Specifically, it meets the conditions required to induce lossy mode resonances (LMRs) (53).
Innovations including the combination of mass spectrometers and fast flow tubes, in particular, selected ion flow tube mass spectrometry (SIFT-MS) as quantitative analytical techniques that are capable of detecting and quantifying a wide variety of VOCs was carried out, using on-line real time analyses of single breath exhalations (49). A multilayer integrated optical sensor (MIOS) using a planar polymer waveguide and based on polyaniline (PANI) was developed for ammonia detection at room temperature (54).
16
a variety of different mechanisms that can be a great promise for real-time monitoring of VOCs in air by combination of many different sensing materials in a cross-reactive sensor arrays.
1.2.4
Future prospects
The optimization of electronic platforms to achieve spatial and temporal resolution capable of detecting unimolecular processes requires the need of miniaturization, not only the active sensing elements of the sensors, but also the rest of the structures, such as electrodes, the connections and the electronic reading, as well as the need to improve the selectivity and stability of these devices that can function in complex environments such as living systems. Even deposition techniques such as ink jet printing, which enabled the printing of materials with great accuracy, as well as thin film techniques, such as Langmuir-Blodgett and layer by layer (LBL) deposition, electrochemical deposition, drop- and spincoating, thermal evaporation for the production of layers only a few nanometres thick have contributed to the improvement of sensors (32, 57).
Thus, the improvement of sensors should allow the implementation of intelligent systems for translation and transmission of chemical and/or biological signals in both directions, which will require platforms to be able to mimic, reconstruct and manipulate information in circuits of artificial environments. The search for systems increasingly cheap, rapid, sensitive and capable of monitoring analytes in situ with minimal disturbance to the sample matrix, represents a task for the scientific community. Manufacturers of commercial E-nose systems have become plentiful in recent times and produce a wide range of products utilizing different sensor types depending mainly on the applications (28). However, these E-noses are still very complex systems which entail high costs and specialized operation.
17
19 Sensor construction
Sensitive films
Conducting polymers
Liquid crystal – ionic liquid biopolymers
Study of the properties
Morphology Interaction
Optical sensor Hybrid sensor Proteic sensor Electric sensor
Electronic Nose
This thesis aim the assembly and application of chemoresistive gas sensors employing
conducting polymers, as well as, their combination in an array, forming an electronic nose. The specific objectives included the familiarization with the operation of an e-nose, as well as, its application in the detection and recognition of volatile analytes.
The main aim of this thesis was the development of a novel concept of optical gas sensor, in which liquid crystals, dispersed as a micro-emulsion within a biopolymeric network, are used as sensing element, able to detect and classify volatile organic compounds. Additionally, the conjugation of the electrical system with the optical system, should give rise to a novel gas sensor
called “hybrid sensor”. The morphology and performance of the liquid crystal - ionic liquid – biopolymer based sensitive films will be structurally characterised.
Although not part of the core objective, parallel work will be established for implementation of these sensitive biolayers in electrochemical proteic sensors, allowing simultaneous optical measurements, for detection of nitric oxide.
21
23
3.1
Materials
3.1.1
Chemical and biochemical compounds
Conducting polymers based sensors were prepared employing the conjugated oligomers (I, II) and polymers (III, IV) shown in Figure 3.1 (synthesised by members of the research group of Prof. Doutor Jonas Gruber at IQUSP (58, 59). Chloroform and dodecylbenzenesulfonic acid, were both from Sigma-Aldrich.
For the production of liquid crystal-ionic liquid-biopolymer sensitive films, the polymers used were gelatine from bovine skin from Sigma-Aldrich, agar (San Maru) and
acrylamide (BioRad) polymerised with N,N,N,N-tetramethylethylenediamine (TEMED) and ammonium persulfate (APS) from Sigma-Aldrich. The sugars used were sorbitol, gum arabic from Sigma-Aldrich and dextran from Biochemica,. The liquid crystal was 4-pentyl-4-cyanobiphenyl (5CB) from Sigma-Aldrich and the ionic liquids were 1-butyl-3-methylimidazolium dicyanamide ([BMIM][DCA]) from Solchemar, 1-butyl-3-methylimidazolium chloride ([BMIM][Cl]), 1-ethyl-3-1-butyl-3-methylimidazolium dicyanamide ([EMIM][DCA]), 1-butyl-3-methylimidazolium sulfate ([BMIM][SO4]) and
1-butyl-3-methylimidazolium tetrachloroferrate ([BMIM][FeCl4]) from Iolitec,
1-butyl-3-methylimidazolium bromide ([BMIM][Br]) from Sigma-Aldrich, 1-allyl-3-octylimidazolium chloride ([ALOCIM][Cl]), prepared by the research group of Prof. Doutor Omar A. M. B. El Seoud (60), and distilled water as solvent.
For the production of cytochrome c based sensors, cytochrome c, glutaraldehyde, cyanuric chloride and thionyl chloride from Sigma-Aldrich and ethanol and diethyl ether from Synth were used. Phosphate buffered saline (PBS) was prepared from sodium phosphate monobasic from Reagan, sodium phosphate dibasic heptahydrate from Nuclear and sodium hydroxide from Synth.
The solvents used for the prove of concept of the opto-electronic nose were: ethyl acetate, ethanol, dichloromethane, dioxane, diethyl ether, heptane, hexane, methanol and xylene from Synth, toluene from F. Maia and carbon tetrachloride from Sigma-Aldrich.
24
3.1.2
Equipment
In the production of the sensitive films, a Shimadzu AUT220 balance and a Corning PC220 stirrer were used for weighing and mixing the components. For spincoating these films a homemade spin coater (500 – 5000 rpm) was used. The sensors were cleaned in a Cole Parmer 8852 sonicator during 10 min.
Morphological studies of the sensitive films were performed by optical microscopy using a Celestron LCD Digital Microscope 44340 with polarized light, by atomic force microscopy (AFM) using a PicoSPM-LE molecular imaging system with cantilevers operating in the intermittent-contact mode (AAC mode), slightly below their resonance frequency of approximately 305 kHz in air, and by scanning electronic microscope (SEM) using a JEOL JSM-5900LV microscope. For interaction studies, a quartz crystal microbalance (QCM) QSense E4 with AT-cut 5 MHz piezoelectric quartz crystals (14 mm diameter) coated with gold (Qsense) were used.
The sensing system consisted in a gas delivery system and a sensor or an electronic nose connected to an acquisition board that transfers data to a personal computer. The delivery system used was a homemade pneumatic system or a set of compartments connected by a door, both controlled by a computer. The optical and hybrid sensor developed in this thesis and protected by a patent consists of a system assembled from electronic components: 110 VAC-5 VAC transformer, 5 mm round white LED (T-1 3/4), LDRs VT935G Excelitas Tech and copper or gold interdigitated electrodes. The sensors were connected to an I/O interface acquisition board operating with a 80 mV peak-to-peak 2 kHz triangle wave linked to a 10 bit analog to digital converters (61).
Properties and responses of the cytochrome c based sensor were studied by circular dichroism with a spectropolarimeter Jasco J-720. For registering UV-Visible spectra a Hewlett Packard 8453 spectrometer was used, and to perform cyclic voltammetry an Autolab
25
3.1.3
Software
For data acquisition during the measurements with the gas sensors and electronic nose softwares developed by Mr. Leonardo Ventura, a member of the research group of Prof. Doutor Jonas Gruber, eNose 7.0 for short period assays and eNose 9.0 for long period assays were used. For data analyses Origin 6.0 by Microcal Software, STATGRAPHICS Centurion XV by StatPoint, and Analisador 3.2, a software developed by Mr. Bruno Costa, a member associated with our rese arch group, were used.
For interaction studies performed by QCM, QSoft was used for data acquisition and QTool for data treatment, both by QSense.
Cyclic voltammetry measurements with cytochrome c based sensors were performed using General-Purpose-Electrochemical-System-Software (GPES) version 4.9.005 from Metrohm Autolab.
The images obtained from polarised light microscopy, AFM and SEM were treated with ImageJ v.1.47 by Wayne Rasband, National Institutes of Health, USA.
27
3.2
Methods
3.2.1
Conducting polymers based sensors
3.2.1.1 Production of the sensitive layer
Four different oligomers or polymers (58, 59) represented in Figure 3.1, were previously synthesised by the research group of Prof. Doutor Jonas Gruber. These polymers were doped with 10% w/w of dodecylbenzenesulfonic acid in solution and used as described below:
1. Dopant stock solution was prepared dissolving 10 mg of dopant in 5 mL of chloroform.
2. Oligomer or polymer solution was prepared dissolving 2.5 mg of the polymer in 0.4 mL of chloroform
3. Doped oligomer/polymer solution was prepared by adding 0.35 mL of the dopant stock solution to the oligomer/polymer solution.
Figure 3.1. Chemical structures of the oligomers and polymers used as sensitive layer in gas sensors:
(I)1,2-bis(9,9-dioctyl-2-fluorenyl)ethene;(II)9,9-dioctyl-2,7-bis[1,2-(9,9-dioctyl-2-fluorenyl)vinylene] fluorene; (III) poly(2-phenyl-p-xylylene); (IV) poly(4’-hexyloxy-2,5-biphenyleneethylene).
3.2.1.2 Construction of the sensors
Four different electrical sensors were obtained by spincoating 20 µL of each of the above mentioned doped oligomer/polymer solution onto interdigitated metallic electrodes (Figure 3.2).
The interdigitated metallic electrodes, as shown in Figure 3.2, were made at the Department of Electrical Engineering, Polytechnic School of the University of São Paulo, by
R1 R1
R1
R1
R1 R1
R1 R1 R1 R1 n n R2
R1 = C8H17
R2 = OC6H13
I II
28
usual lithography, in which chrome was deposited onto glass slides. The interdigitated active area
was 1 cm2 and the gaps between digits were 20 m.
Figure 3.2. Layout of a chrome interdigitated electrode with 1 cm2 of sensorial area and 20 m of spacing
between digits.
3.2.1.3 Application in electrical gas sensors and electronic noses
Conducting biopolymer based sensors have been used to sense volatile compounds. An ac voltage was applied to the interdigitated electrodes using an I/O interface board operating with a 80 mV peak-to-peak 2 kHz triangle wave and 10 bit analog to digital converters (61) for digitalising the readings that were transferred to a personal computer.
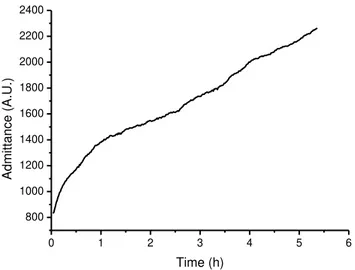
3.2.1.3.1 Monitoring fragrance emissions by flowers
Volatile organic compounds (VOCs) emitted by S. floribunda were studied using chemiresistive gas sensors, described in previous sections, with the ability to change electrical admittance upon exposure to volatiles. A description of the oligomers/polymers used as active layers in those sensors and their deposition onto the interdigitated metallic electrodes, can be found in sections 3.2.1.1 and 3.2.1.2, respectively.
29
Figure 3.3. Preferred arrangement for flower fragrance detection
Only one sensor was used to monitor the fragrances emitted by Madagascar Jasmine flowers. The test was conducted up to four days with admittance measurements obtained at a rate of one reading every two minutes.
3.2.1.3.2 Discrimination among commercial flaxseed brands
It was not possible to “smell” and distinguish different brands of flaxseed,
commercialised in the market of São Paulo, using only one gas sensor. So, it was necessary to combine the response of several sensors, forming an electronic nose, to amplify the precision of this distinction. The four sensors described in sections 3.2.1.1 and 3.2.1.2 were simultaneously connected to the data acquisition board and admittance measures were recorded at a rate of 20 readings per second.
Delivery system
30
followed by a recovery period, in which valves 1 and 2 are closed and valve 3 is open, whereby clean air from the air pump reaches directly the sensors chamber, resetting them.
Figure 3.4. Configuration of the pneumatic system used for sampling.
Conditions of the assay
For sensing volatiles released by flaxseeds, 25 g of flaxseed was placed in the sample container, kept at 35ºC. Thus, the sensor array was exposed to the sample headspace for 10 s followed by a recovery period of 120 s, in which the sensors were restored with fresh air. The airflow was maintained constant at 1 L min-1. This exposure/ recovery cycle was repeated eight
31
3.2.2
Liquid crystal-ionic liquid-biopolymer based sensor
3.2.2.1 Production and optimization of the sensitive biolayer
A biopolymeric layer was used as the sensitive layer in gas sensors. A biopolymeric matrix of gelatine served as a support to ionic liquid (IL) in the electric sensors, liquid crystal (LC) micelles in the optical sensors and both in the hybrid sensors. The liquid crystal-ionic liquid-biopolymer (LC-IL-BP) based sensors were produced by deposition of this biopolymeric mixture onto a substrate producing a thin sensitive film.
Optical sensor
The biopolymer solution used for optical sensor purpose was produced according to the general procedure described below, developed at FCT / UNL by the group of Prof. Doutora Ana Cecilia Afonso Roque and later optimized at IQUSP for applications in gas sensors.
1. A hot plate was heated to 35-45 ºC.
2. A small magnetic stirrer was placed in a small glass vial. 3. 50 µL of IL was introduced in the vial and stirred for 15 min. 4. 5 µL of LC (5CB) was added and stirred for 10 min.
5. 12.5 mg of biopolymer was added.
6. 12.5 mg of sugar was added and the mixture stirred until becoming homogenous. 7. 50 µL of warm water was added and stirred until becoming homogenous.
The composition of this mixture was optimized by testing the response of optical sensors made with different concentrations of IL, gelatine and water.
Negative controls were previously performed, removing the IL of the film’s composition, in which it was observed that the presence of IL iscrucial for the formation of robust and well organized micelles and thus a good response of the films.
Hybrid sensor
32
3.2.2.2 Application in optical gas sensors
The development of a novel optical sensor is described in this thesis. Here, the LC-IL-BP based sensitive films were employed in optical gas sensors. The sensor is formed by a sensitive layer, with optical properties due to the presence of LCs, associated with a transducer system, described in more details in the following sections.
3.2.2.2.1 Construction of the sensor
The optical sensors were assembled by the deposition of thin films on glass substrates as shown in Figure 3.5. This was achieved by a scattering technique in which a glass rod was rolled over a droplet of the stock solution, described above, placed on a glass slide, forming a regular thin film with a mean thickness of approximately 36 µm.
Figure 3.5. Optical sensor. The liquid crystal-ionic liquid-biopolymer forms a regular film onto a glass
substrate.
33
Figure 3.6.Transducer’s unit of the optical device.
Two electrical circuits compose the transduction system: the LEDs circuit and the LDRs circuit. Figure 3.7A shows the LEDs circuit, which comprises four 5 mm white LEDs, each one
connected in series with a 100 Ω resistor and powered by a stabilised 5 VDC source. The latter was assembled using a 110 VAC / 2 x 7.5 VAC / 250 mA transformer, two rectifying diodes, a 5 V three-terminal voltage regulator and three filter capacitors, as represented in Figure 3.8. The LDRs circuit, shown in Figure 3.7B, is very simple: four LDRs are connected directly to the conductivity meters of the data acquisition board.
LED LDR
Optical sensor
Printed circuit board
34
Figure 3.7. Schematic electrical circuits forming the electronic optical sensor: A) Electrical circuit for
powering the LEDs circuit; 100 Ω 1/8 W (R1-R4) B) Electrical circuit for the LDRs, NSL19-M51 (LDR1-LDR4).
Figure 3.8. Electrical circuit of the stabilised 5 VDC power supply. The circuit uses a transformer
110/2x7,5 V (TR1); Two diodes 1N4002 (D1, D2), a 7805 Voltage Regulator (IC1) and three capacitors: two 2200 µF / 25 V electrolytic capacitors (C1, C3) and a 0.1 µF / 250 V polyester capacitor (C2).
3.2.2.2.2 Optimization of the sensor response
Some parameters of the optical device were optimized in order to achieve a better response:
Composition and thickness of the sensitive film
35
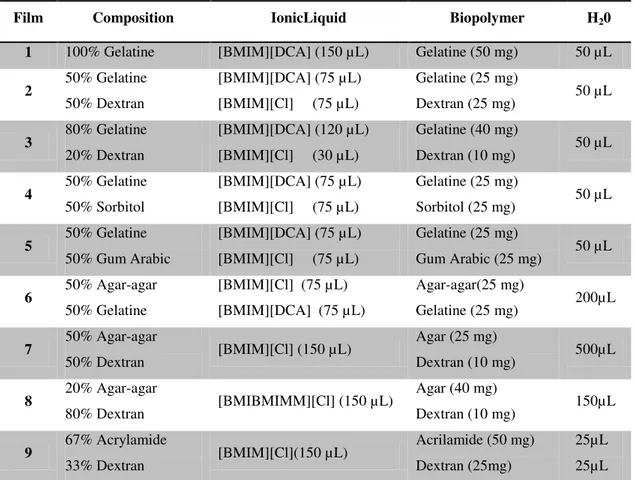
Table 3.1. Composition of sensitive films tested, to be used as sensitive layers in optical sensors.
Component Sensor A Sensor B Sensor C Sensor D
Ionic liquid (µL) 75 50 50 50
Liquid crystal (µL) 5 5 5 5
Gelatine (mg) 25 25 12.5 5
Water (µL) 25 50 50 50
The films were observed by polarised light microscopy and its optical response was evaluated using the developed optical device (section 3.2.2.2.1), where the optical sensors were exposed to chloroform vapours, kept at 35 ºC, with a flow rate of 1.7 L/min.
Wavelength and intensity of the incident light
Commercial LEDs - green, red, blue and white - with different wavelengths were tested, as well as the intensity of this light, by adjusting resistances (47 to 4700 Ω), connected in series.
3.2.2.2.3 Proof of concept: Detection and classification of volatile solvents
Several volatile solvents, which are single pure chemical substances, were smelled by the optical electronic nose in order to prove its sensing abilities. The delivery system described in section 3.2.1.3.2 was used for this purpose.
Conditions of the assay
Three films from different compositions were made according to the procedure described in section 3.2.2.1 - optical sensor: gelatine, dextran and [BMIM][DCA]; gelatine, sorbitol and [BMIM][DCA]; and gelatine, dextran and [ALOCIM][Cl] - were exposed to each of the different solvent vapours for 12 cycles. These solvents were: ethyl acetate, ethanol, dichloromethane, dioxane, diethyl ether, heptanes, hexanes, methanol, carbon tetrachloride, toluene and xylenes. The following tests were based on cycles of 6 s exposure time and 54 s recovery time, totalising 60 s per cycle. The solvents were kept in a thermostatised water bath at 36 ºC and the flow rate kept at 2 L min-1. After conducting repeated cycles of exposure and recovery, the conductance
36
3.2.2.2.4 Quality control of fish
For evaluating the quality of fresh Tilapia fish, monitoring was carried out with an optical gas sensor, as well as by parallel microbiological bench test evaluations for validation purpose.
Delivery system
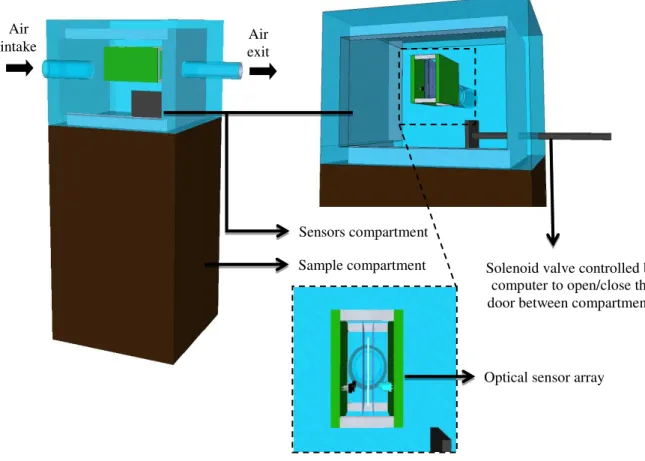
To run long term tests, as in the case of monitoring a perishable product, a system was built consisting of two closed compartments (one for the sensor(s) and one for the sample) separated by a door controlled by a computer, as shown in Figure 3.9. This system allowed alternate periods of exposure (to the volatiles from the sample) and recovery (fresh air) of the sensor through the opening and closing of the door, respectively, controlled by a software via an electromagnetic device (solenoid valve) used in car locks, whose electronic circuit and the respective power supply are shown in Figure 3.10.
Figure 3.9. Configuration of the sensor/sample box system used for long term tests. Air
intake exit Air
Sample compartment Sensors compartment
Solenoid valve controlled by computer to open/close the door between compartments
37
Figure 3.10. Electrical circuit of the stabilised 5 and 12 VDC power supply and electrical circuit to control
the opening / closing of the gate between sample and sensor compartments. Components are: a transformer 110/9 VAC (TR1); a 7805 voltage regulator; and three capacitors: two 2200 µF / 25 V electrolytic capacitors (C1, C3) and a 0.1 µF / 250 V polyester capacitor (C2); a 1A/400V rectifying bridge (D1); 1N4004 (D2); 5V relay (RL1); 12 V solenoid valve (SV1); 10kΩ 1/8W (R1); BC 237 (Q1); normally open press bottom switch.
Conditions of the assay
An optical sensor formed by biopolymer (gelatine), LC (5CB) and IL ([BMIM][Cl]), according to the procedure described in section 3.2.2.1 - optical sensor, was placed in the upper compartment. A 25 g slice of fresh fish (Tilapia) was introduced in the lower compartment. Each sampling cycle lasted 20 min: 5 min exposure to the volatiles emitted by the fish followed by 15 min of recovery period in which clean air passed through the sensor’s chamber. The fish was maintained at an average temperature of 20 °C throughout the test.
The above test was accompanied by conventional microbiological bench testing methods used to evaluate the quality of fish. Thus, eight pieces of Tilapia, weighing 25 g each, were placed in a vessel, kept under the same conditions, for periodic microbiological analysis purposes. These tests were carried out simultaneously every 2 h throughout the test. Tilapia fish samples were subjected to enumeration of mesophilic bacteria, following the method of APHA, 2001(62). In the analyses, 25 g samples in 25 mL of peptone water were subjected to serial dilutions (1:10) till the fifth dilution and subsequently inoculated into duplicate plates in standard agar culture medium for counting. The plates were incubated inverted at 37 ° C for 48 h.
Both tests - gas sensor and bench microbiological testing - aimed to assess the quality of the fish over time as tools for food security analysis. The optical gas sensor responds to the