Optimization of crude protein in diets for Nile tilapia reared in net pens:
performance, hematology, and water quality
Otimização da proteína bruta em rações para tilápias do Nilo criadas em tanques-rede: desempenho, hematologia e qualidade da água
Débora Del Puppo1 Douglas Haese1* Levy de Carvalho Gomes1 João Luís Kill2
Enrique Coelho Brugnara1 Joyce Barcellos1 Ismail Ramalho Haddade3 Nielton Cezar Ton1
ISSNe 1678-4596
INTRODUCTION
Tilapia is a fish species that has best
adapted to the intensive production system. In
addition, tilapia has a quick development cycle, firm flesh, and good acceptance in the market. However, the challenges to improve production efficiency and
reduce costs are constant.
In fish feed, protein is the nutrient that most influences the production cost. In addition, proteins can become an environmental problem if levels above the animal’s utilization capacity are used. Taking into account that fish requirements are not for protein but for a suitable amino acid ratio to form muscle protein and other body proteins, the amino acid excess will be removed by fishes in the 1Programa Pós-graduação em Ciência Animal, Universidade Vila Velha (UVV), 29102-606, Vila Velha, ES, Brasil. E-mail: [email protected]. *Corresponding author.
2Centro de Tecnologia Animal (CTA), Domingos Martins, ES, Brasil. 3Instituto Federal do Espírito (IFES), Santa Teresa, ES, Brasil.
ABSTRACT: Two experiments were conducted to evaluate the effects of reducing dietary crude protein (CP), based on the ideal protein concept for Nile tilapia reared in net pens. The experimental (isocaloric, isocalcium, and isophosphoric) diets were formulated to contain 270, 300, 330, and 360g kg-1 CP. In experiment 1, 4320 Nile tilapia (13.5±0.82g) were used to evaluate the performance and hematological
parameters. The experimental design was completely randomized and the fish were distributed in 24 net pens (1.0m3), with four diets, six
replicates, and 180 fishes per experimental unit. In experiment 2, 40 Nile tilapia (22.5±0.56g) were used to evaluate the ammonia excretion. Fish were distributed in 40 aquaria (3.0L), with one fish per aquarium (n=10). No protein reduction effect was observed in feed intake and the
hematocrit and hemoglobin values. Regarding the statistic models used in the present study, difference was observed between CP values. The
optimal level estimated by the quadratic equation first interception with the linear response plateau (LRP) as a response to CP changes in the
diet was determined for weight gain (324.3g kg-1) and feed conversion (317.8g kg-1). After reduction in the CP levels, a linear reduction was observed in the ammonia excretion in water. Based on the ideal protein concept for Nile tilapia reared in net pens, reducing the CP levels in the diets is possible, without change in the performance and hematological parameters, and with a reduction in the levels of ammonia excretion in water, since amino acids are supplemented.
Key words:amino acids, performance, statistic models, Oreochromis niloticus, environmental pollution.
RESUMO: Dois experimentos foram realizados para avaliar os efeitos da redução na quantidade de proteína bruta (PB) da ração, com base no conceito de proteína ideal para tilápias do Nilo criadas em tanques-rede. As rações experimentais (isoenergéticas, isocálcicas e isofosfóricas) foram formuladas para conter 270, 300, 330 e 360g kg-1 de PB. No experimento 1, 4320 tilápias do Nilo (13.5±0.82g) foram usadas para avaliar os parâmetros de desempenho e hematológicos. O delineamento experimental foi inteiramente casualizado e os peixes foram distribuídos em 24 tanques (1.0m³), com quatro rações, seis repetições e 180 peixes por unidade experimental. No experimento 2, 40 tilápias do Nilo (22.5±0.56g) foram usadas para avaliar a excreção de amônia. Os peixes foram distribuídos em 40 aquários (3.0L), com
um peixe por aquário (n=10). Nenhum efeito de redução proteica foi observado sobre o consumo de ração e os valores de hematócrito e
hemoglobina. Em relação aos modelos estatísticos empregados neste estudo, uma diferença foi observada entre os valores de PB. O nível ótimo, estimado através da primeira intersecção da equação quadrática com o platô do modelo Linear Response Plateau (LRP) como resposta às variações na proteína da dieta, foi determinado para ganho em peso (324.3g kg-1 de PB) e conversão alimentar (317.8g kg-1). Após a redução nos níveis de PB, foi observada uma redução linear na excreção de amônia na água. Com base no conceito de proteína ideal para tilápias do Nilo criadas em tanques-rede, é possível reduzir os níveis de PB nas rações, sem alteração nos parâmetros de desempenho e hematológicos, e com redução nos níveis de excreção de amônia na água, mediante suplementação de aminoácidos.
Palavras-chave: aminoácidos, desempenho, modelos estatísticos, Oreochromis niloticus, poluição ambiental.
form of ammoniacal nitrogen, which may promote water eutrophication, reduction in growth rate, and
increase in the production cost (FURUYA et al.,
2005; BOTARO et al., 2007; RIGHETTI et al., 2011).
Usually, the protein levels in commercial
diets for tilapia are above their needs, which means
high participation of protein ingredients in the formulation (FURUYA et al., 2001). Source of
proteins used in the formulation may be of vegetable or animal origin. However, the nutrients should promote optimal performance, reducing both costs
and environmental pollution (PEZZATO et al., 2009;
FURUYA & FURUYA, 2010b). To achieve this goal, determining the levels and availability of the
amino acids present in each ingredient is necessary.
Therefore, diets should be formulated based on
amino acid requirements (STOREBAKKEN et al., 2000; BOTARO et al., 2007; BOMFIM et al., 2008;
FURUYA & FURUYA, 2010b).
Reduction in crude protein content and
supplementation with synthetic amino acids are possible strategies for better balanced amino acid formulations in diets (FURUYA & FURUYA, 2010b). Several authors have confirmed that this strategy is effective in reducing nitrogen excretion without
impairing the general performance (BALLESTRAZZI
et al., 1994; FURUYA et al., 2005). However, most of these studies were conducted with fish in laboratory
conditions, and experiments evaluating crude protein reduction in net pens and intensive production system
are scarce. Under field conditions, factors such as density, stress, age, size, temperature, feeding, and
oxygen level can affect reduction in the amount of
protein diet, which either alone or together can affect fish performance.
Therefore, based on the ideal protein concept, the objective of this study was to evaluate
the effect of reducing the amount of crude protein provided to Nile tilapia on the performance,
hematological, and water-quality parameters using
different mathematical models.
MATERIALS AND METHODS
Two experiments were conducted with
Nile tilapia (Oreochromis niloticus; Thailand strain)
to evaluate the performance, hematological, and
water-quality parameters of fish fed diets containing
different amounts of crude protein. Treatments consisted of four experimental isocaloric, isocalcium, and isophosphoric diets containing 270, 300, 330, and 360g kg-1 of crude protein (CP). The diets (Table 1)
were formulated according to FURUYA (2010a) to
meet the minimum nutritional requirements (except
for CP), as recommended for Nile tilapia (≤100g). The CP values of the experimental diets were obtained by adjusting the amount of fish and corn flour. Synthetic
amino acids L-lysine, DL-methionine, L-threonine,
and L-tryptophan were provided as a supplement when their ratios with digestible lysine were lower than those obtained in the diet containing a higher CP level.
After the ingredients were mixed, the mixture was extruded in a company (Nutriave Alimentos) using a single screw extruder (Ferraz, E-200 model; engine power: 200hp; nominal capacity:
4.5ton h-1) followed by drying in a horizontal belt dryer (140±12°C; 22min).
In experiment 1, the performance and
hematological parameters were analyzed. The study was conducted at the Acquapeixe farm, which is
installed in the Aguiar lagoon, in the Baixo Quartel district of Linhares city, Espírito Santo State
(ES), Brazil. A total of 4320 tilapia (initial weight: 13.5±0.82g) were distributed in 24 net pens (1.0m³; 1x1x1m). The experimental design was completely randomized, with four diets, six replications, and 180 fish per experimental unit. Diets were weighed and
provided daily in three feeds (8:00, 12:00, and 16:00)
for 50 days. Thus, each meal was offered in small amounts, with repeated administration (by manual feeding) until apparent satiation, when pellet capture and regurgitation by the fish was no longer observed. Animals were weighed on a digital scale (precision: 0.01g) at the beginning and end of the experiment to determine both weight gain and feed conversion.
Water temperature in the net pens was measured daily (8:00 and 18:00) and pH and dissolved
oxygen (mg L-1) were measured (deep: 50cm) every
two weeks with a portable digital multiparameter
meter (Akso;model AK 87).
At the end of the experimental period,
six fish per replicate were used for hematological analysis. Fish were anesthetized (benzocaine; 1g 15L-1
of water) and, after complete desensitization, blood was collected by puncture of the caudal vein with a syringe (3mL) coated with 3% ethylenediamine tetra-acetic acid (EDTA). Samples were sent to the laboratory of veterinary clinical pathology (Biolabor
Veterinário®), where the values for hemoglobin,
hematocrit, and plasma protein were determined. In experiment 2, ammonia excreted by fish was determined in the Laboratory of Applied
Ichthyology, Universidade de Vila Velha (UVV).
fed (to satiation; once daily) a diet containing 270g kg-1 protein. After this period, they were anesthetized
(benzocaine solution; 0.1g L-1), weighed, and transferred to 40 individual three-liter aquariums;
(n=10) being kept under constant aeration and fed
the experimental diets (270, 300, 330, and 360g kg-1
CP) for a week. After this period, they were subjected
to fasting (48h) for excreta disposal. After fasting,
fish were again fed with the experimental diets (to
satiation) and then transferred to aquaria containing
fresh water. To calculate the amount of ammonia,
water was analyzed before receiving the fish and 24h after they were received in the new tank. Ammonia was determined by the indophenol method, and
measured using a spectrophotometer (Biospectro;
SP-220; Curitiba, PR, Brazil; l = 640nm) according to the
American Public Health Association (APHA, 1998). Total excretion was calculated using the ALTINOK
& GRIZZLE (2004) equation: Total excretion =
{[(NHf/Uf - NHi/Ui) / gtotal] / 3},where NHf/Uf is the
calculated sample final ammonia, NHi/Ui is the initial
ammonia, which is divided by the mean biomass of
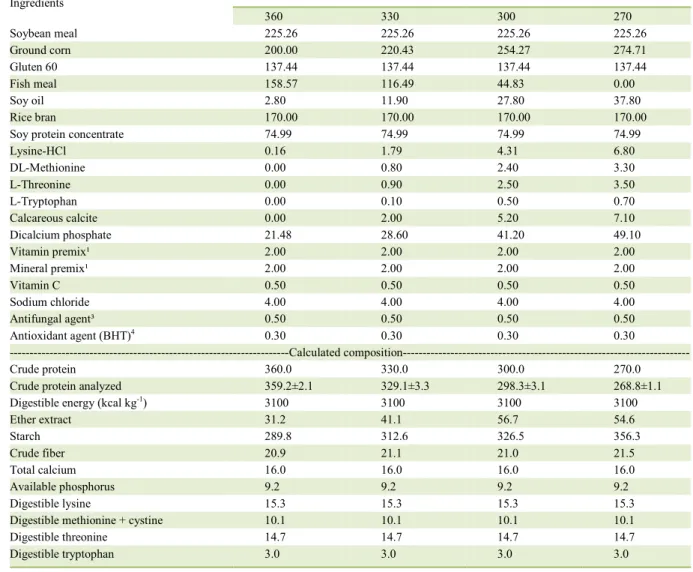
Table 1 - Percentage and chemical composition of experimental diets.
Ingredients ---Crude protein, g kg
-1
---
360 330 300 270
Soybean meal 225.26 225.26 225.26 225.26
Ground corn 200.00 220.43 254.27 274.71
Gluten 60 137.44 137.44 137.44 137.44
Fish meal 158.57 116.49 44.83 0.00
Soy oil 2.80 11.90 27.80 37.80
Rice bran 170.00 170.00 170.00 170.00
Soy protein concentrate 74.99 74.99 74.99 74.99
Lysine-HCl 0.16 1.79 4.31 6.80
DL-Methionine 0.00 0.80 2.40 3.30
L-Threonine 0.00 0.90 2.50 3.50
L-Tryptophan 0.00 0.10 0.50 0.70
Calcareous calcite 0.00 2.00 5.20 7.10
Dicalcium phosphate 21.48 28.60 41.20 49.10
Vitamin premix¹ 2.00 2.00 2.00 2.00
Mineral premix¹ 2.00 2.00 2.00 2.00
Vitamin C 0.50 0.50 0.50 0.50
Sodium chloride 4.00 4.00 4.00 4.00
Antifungal agent³ 0.50 0.50 0.50 0.50
Antioxidant agent (BHT)4 0.30 0.30 0.30 0.30
---Calculated
composition---Crude protein 360.0 330.0 300.0 270.0
Crude protein analyzed 359.2±2.1 329.1±3.3 298.3±3.1 268.8±1.1
Digestible energy (kcal kg-1) 3100 3100 3100 3100
Ether extract 31.2 41.1 56.7 54.6
Starch 289.8 312.6 326.5 356.3
Crude fiber 20.9 21.1 21.0 21.5
Total calcium 16.0 16.0 16.0 16.0
Available phosphorus 9.2 9.2 9.2 9.2
Digestible lysine 15.3 15.3 15.3 15.3
Digestible methionine + cystine 10.1 10.1 10.1 10.1
Digestible threonine 14.7 14.7 14.7 14.7
Digestible tryptophan 3.0 3.0 3.0 3.0
1Content (kg-1): Vitamin A: 1,333,333UI; Vitamin D3: 333,333UI; Vitamin E: 10,000mg; Vitamin K3: 666mg; Vitamin B1: 1666mg;
Vitamin B2: 1666mg; Vitamin B6: 1333mg; Vitamin B12: 3.33µg; Vitamin C: 35,333mg; Pantothenic acid: 2500mg; Niacin: 5200mg; Folic acid: 500mg; Biotin: 83.3mg; Choline: 83,333mg; ²Content (kg-1): Iron: 10,000mg; Copper: 1333mg; Manganese: 2500mg; Iodine: 83.3mg;
the tank, and finally divided by 3 which corresponds to the volume of water in each aquarium.
Performance data were submitted to analysis of variance. Then the data set was subjected
to regression analysis, considering the performance
parameters as the dependent variable and the CP level of the diet as the independent variable. The following models were used: quadratic polynomial model, where Yi = β0 + β1PBi + β2Lis3i2 + ei, where Y = is
the dependent variable; β0 = intercept; β1 = linear-component parameter; and β2 = quadratic-linear-component
parameter. Linear response plateau (LRP): Yi = β0±β1PBi to estimate the straight line and Yi = β2
to estimate the plateau; where: β2 = estimate of the
performance parameters. Point of intersection of the straight lines was obtained by: PB = (β2-β0)/β1.
The estimate of CP optimal level needed
to improve performance based on the LRP was obtained by the intercept of the straight line with
the plateau. Regarding the quadratic polynomial, its estimate was obtained by equalizing to zero
the first derivative of the equation. The optimal level, as estimated by the exponential model, was obtained considering 95% of the asymptotic response as calculated by the expression (ln 0.05)/ C+D (SAKOMURA & ROSTAGNO, 2007). The first intersection of the quadratic equation with the LRP plateau was obtained by the equation L = β0+β1PBi + β2PBi
2, and the CP level corresponding
to the intersection was calculated by the expression (-β1+(β1
2 - 4 β
2 (β0 - L)) 1/2)/(2β
2).
Hematologic data were analyzed by comparing the mean values while using the Tukey test. Data were analyzed using the procedures for
analysis of variance and regression contained in the System for Statistical and Genetic Analysis (SAEG; Universidade Federal de Viçosa, UFV, 2000; v. 9.0).
Probability values less than 0.05 were considered significant in all statistical procedures.
RESULTS AND DISCUSSION
Mean values were calculated for
temperature (24.5±2.6°C), dissolved oxygen in
the water (5.15±1.2mg L-1), and pH in the lagoon
(6.7±0.3). These values remained within the range recommended by POPMA & GREEN (1990) for
proper performance of tilapia.
The CP requirements for different performance parameters varied depending on the mathematical models used in the study. Regarding
weight gain, an increase (P<0.05) was observed
in the value estimated for CP (353.1g kg-1) when
the quadratic regression model was used (Table 2). However, other values were estimated for a greater weight gain as a function of CP when the LRP
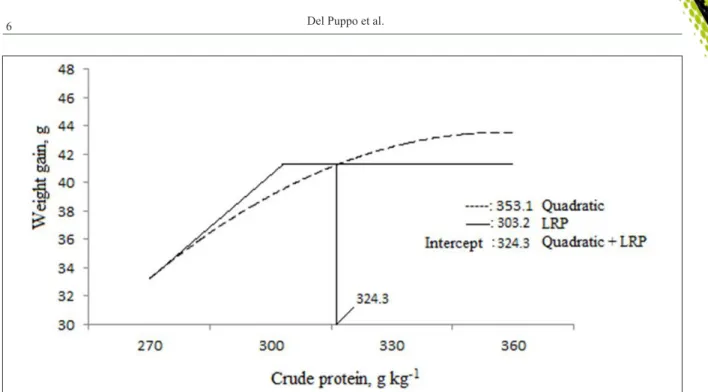
model (303.2g kg-1) and LRP quadratic model (324.3g kg-1) were used (Table 3). In this study, the quadratic
model applied to the LRP allowed a better fit to the data, resulting in an estimate intermediate between those obtained with the quadratic and LRP models.
The LRP model alone tends to
underestimate the optimal level because it does not take into account the biological law of decreasing return, and the plateau is then obtained once the maximum
response is achieved. Conversely, quadratic model tends to overestimate the optimum level. Therefore,
a combined (LRP and quadratic) model, which provides intermediate values between the models
alone, is recommended to determine requirements in dose-response experiments (SAKOMURA & ROSTAGNO, 2008).
The CP value (324.3g kg-1) estimated
for weight gain indicated that an improvement
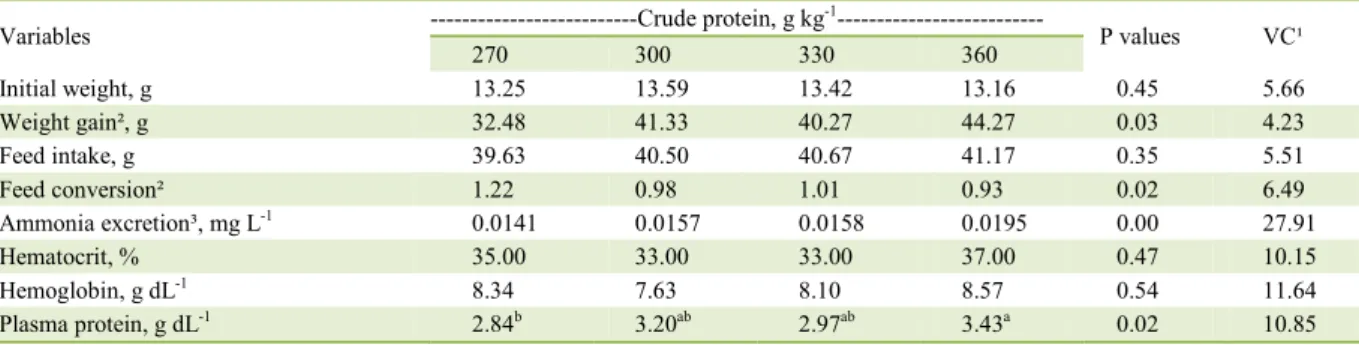
Table 2 - Performance, ammonia excretion, and values for hematocrit, hemoglobin, and plasma protein.
Variables ---Crude protein, g kg-1--- P values VC¹
270 300 330 360
Initial weight, g 13.25 13.59 13.42 13.16 0.45 5.66
Weight gain², g 32.48 41.33 40.27 44.27 0.03 4.23
Feed intake, g 39.63 40.50 40.67 41.17 0.35 5.51
Feed conversion² 1.22 0.98 1.01 0.93 0.02 6.49
Ammonia excretion³, mg L-1 0.0141 0.0157 0.0158 0.0195 0.00 27.91
Hematocrit, % 35.00 33.00 33.00 37.00 0.47 10.15
Hemoglobin, g dL-1 8.34 7.63 8.10 8.57 0.54 11.64
Plasma protein, g dL-1 2.84b 3.20ab 2.97ab 3.43a 0.02 10.85
Mean values labeled with different letters in the same row are different (P<0.05) by the Tukey test.
occurred in protein efficiency, with a reduction in
protein content from the maximum value (360g kg-1) as used in the experiment (Figure 1). This effect
can be attributed to the decrease in the amount of amino acids exceeding fish requirements, which did not participate in body protein formation and were then excreted (BOMFIM et al., 2008). The
CP value estimated in the present study (297.3g kg-1; for tilapia post-reversion up to 100g of body
weight) were above those reported by FURUYA (2010a). However, BOTARO et al. (2007) evaluated
the effect of different protein concentrations in the diet (291-245g kg-1) based on the concept of ideal
protein for tilapia, and they observed no significant difference between the effects on weight gain after
reducing protein in the diet.
As expected, reduction in the CP values had no effect on feed consumption, since the diets
were isocaloric and the fish were fed to satiation. This
result confirmed the study of BONFIM et al. (2008), who observed that feed consumption in fish was regulated by energy intake.
In the present study, feed conversion
was influenced (P<0.05) by reduction in the CP levels in the feed. With regard to the best feed conversion, the best CP value was estimated by the
quadratic regression (343.3g kg-1), and a different value (301.1g kg-1) was estimated by the LRP
model. However, an intermediate value (317.8g
kg-1) was obtained for the best feed conversion
when the quadratic regression was combined with
the LRP plateau. As feed conversion is directly related to effectiveness in deposition of nutrients
ingested and feed intake was not different (P>0.05) between the treatments, it can be
concluded that improvement in feed conversion
(P<0.05) occurred due to weight gain provided by
the levels of protein in the feed.
Ammonia excretion (Table 2) was significantly influenced (P<0.05) by the CP values in the diet. Regression analysis showed
that ammonia excretion decreased linearly
(Y=-0.00210625+0.000577317x; r2=0.81) with the decrease
in the CP value. As difference between feed intake (P>0.05) was not observed in the treatments, reduced ammonia excretion occurred by a decrease in nitrogen consumption as the CP levels were reduced. FURUYA et al. (2005) also reported a lower nitrogen excretion with reduction in the amount of protein in the feed.
Reduction in the CP value in the diet
associated with supplementation of synthetic amino acids allowed the reduction in nitrogen excretion by the fish without any negative effect on the weight gain
until value of 324.3g kg-1 CP. In intensive production systems, such as net pens, this is an important
finding because the possibility of reducing ammonia excretion without impacting performance results is important for a sustainable tilapia culture.
Difference was not reported (P>0.05) between the respective hemoglobin and hematocrit values. However, the values obtained in the present study remained within the reference range
(7.0-9.8g dL-1 and 27-37%, respectively), as described by
HRUBEC & SMITH (2010). A statistical difference (P<0.05) was observed between the lowest and
highest values for plasma protein as a response to
treatments containing the lowest and highest protein values. According to STOCKHAM & SCOTT (2011), most plasma proteins are composed of albumins and globulins, and they can be decreased in conditions
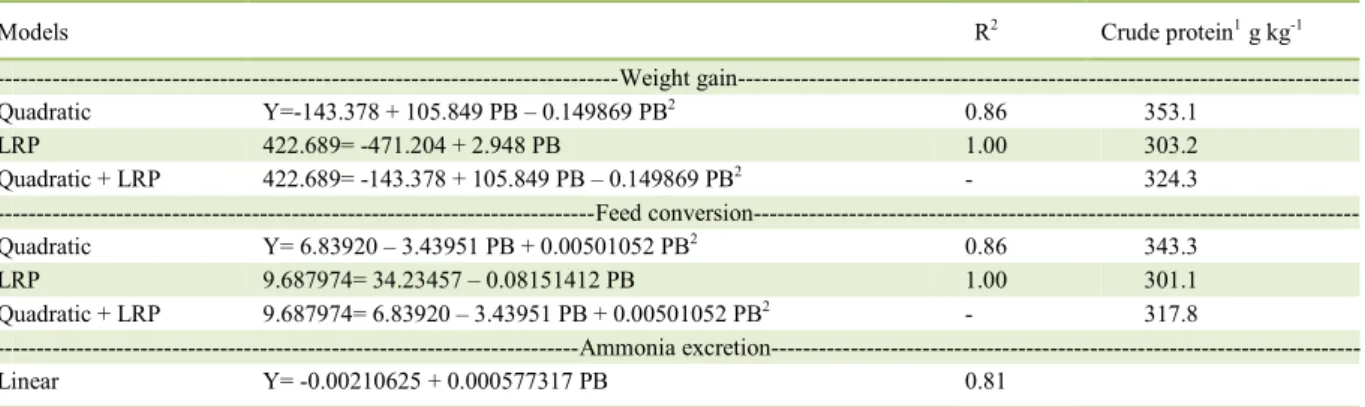
Table 3 - Equations adjusted for weight gain and feed conversion as a function of crude protein levels.
Models R2 Crude protein1 g kg-1
---Weight gain---
Quadratic Y=-143.378 + 105.849 PB – 0.149869 PB2 0.86 353.1
LRP 422.689= -471.204 + 2.948 PB 1.00 303.2
Quadratic + LRP 422.689= -143.378 + 105.849 PB – 0.149869 PB2 - 324.3
---Feed conversion---
Quadratic Y= 6.83920 – 3.43951 PB + 0.00501052 PB2 0.86 343.3
LRP 9.687974= 34.23457 – 0.08151412 PB 1.00 301.1
Quadratic + LRP 9.687974= 6.83920 – 3.43951 PB + 0.00501052 PB2 - 317.8
---Ammonia excretion---
Linear Y= -0.00210625 + 0.000577317 PB 0.81
such as severe hepatic dysfunction or poor nutrition. According to MARTINS (2011), protein restriction in the diet can cause hypoproteinemia in monogastric
animals. The lowest level of plasma protein seen after
intake of the diet containing 260g kg-1 CP may be
related to a deficiency in amino acids that were not
supplemented, especially the non-essential ones, that are also important for the synthesis of plasma proteins.
CONCLUSION
The values of 324.3 and 317.8g kg-1 for
crude protein in the diets promote the best results in weight gain and feed conversion, respectively, for
Nile tilapia (ca. 14g) bred in net pens. Reduction in
crude protein to the level estimated in this study and
supplementation with synthetic amino acids, based on the ideal protein concept, reduce the ammoniacal
nitrogen excretion in water and did not alter the hematological parameters in fish.
BIOETHICS AND BIOSECURITY COMMITTEE APPROVAL
This study was submitted to and approved by the Ethics Committee (Process No. 004-3/2012; UVV).
ACKNOWLEDGEMENTS
The first author is grateful for the scholarship granted by the Fundação de Amparo à Pesquisa e Inovação do Espírito
Santo (FAPES). We also acknowledge Nutriave Alimentos® for their help in the production of experimental diets and Centro de Tecnologia Animal for the financial support for the study.
REFERENCES
ALTINOK, I.; GRIZZLE, J.M. Excretion of ammonia and urea by phylogenetically diverse fish species in low salinities.
Aquaculture, v.238, p.499-507, 2004. Available from: <http:// dx.doi.org/10.1016/j.aquaculture.2004.06.020>. Accessed: Nov. 22, 2015. doi: 10.1016/j.aquaculture.2004.06.020.
APHA (AMERICAN PUBLIC HEALTH ASSOCIATION, AMERICAN WATER WORKS ASSOCIATION, Water Environment Federation). Standard methods for the examination of water and wastewater. 18.ed. New York, 1998. 1050p.
BALLESTRAZZI, R. et al. The effect of dietary protein level and source on growth, body composition, total ammonia and reactive phosphate excretion of growing sea bass (Dicentrarchus labrax).
Aquaculture, v.127, p.197-204, 1994. Available from: <http://
dx.doi.org/10.1016/0044-8486(94)90426-X>. Accessed: Nov. 25, 2015. doi: 10.1016/0044-8486(94)90426-X.
BOMFIM, M.A.D. et al. Reduction of crude protein with amino acid supplementation, based on ideal protein concept, in diets for Nile tilapia fingerlings. Revista Brasileira de Zootecnia, v.37, n.10, p.1713-1720, 2008. Available from: <http://dx.doi. org/10.1590/S1516-35982008001000001>. Accessed: Dec. 21, 2015. doi: 10.1590/S1516-35982008001000001.
BOTARO, D. et al. Dietary protein reduction based on ideal protein concept for Nile Tilapia (Oreochromis niloticus) cultured
in net pens. Revista Brasileira de Zootecnia, v.36, n.3, p.517-525, 2007. Available from: <http://dx.doi.org/10.1590/S1516-35982007000300001>. Accessed: Dec. 19, 2015. doi: 10.1590/ S1516-35982007000300001.
FURUYA, W.M. Tabelas brasileiras para a nutrição de tilápias. Toledo: GFM, 2010a. 100p.
FURUYA, W.M. et al. Ideal protein concept for dietary protein reduction of juvenile Nile tilapia (Oreochromis niloticus).
Revista Brasileira de Zootecnia, v.34, n.5, p.1433-1441, 2005. Available from: <http://dx.doi.org/10.1590/S1516-35982005000500002>. Accessed: Dec. 20, 2015. doi: 10.1590/ S1516-35982005000500002.
FURUYA, W.M.; FURUYA, V.R.B. Nutritional innovations on amino acids supplementation in Nile tilapia diets.
Revista Brasileira de Zootecnia, v.39, Suppl. spe, p.88-94, 2010b. Available from: <http://dx.doi.org/10.1590/S1516-35982010001300010>. Accessed: Dec. 02, 2015. doi: 10.1590/ S1516-35982010001300010.
FURUYA, W.M. et al. Digestibility Coefficients and Digestible Amino Acids Values of Some Ingredients for Nile Tilapia (Oreochromis niloticus). Revista Brasileira de Zootecnia, v.30,
n.4, p.1125-1131, 2001.
HRUBEC, T.C.; SMITH, S.A. Hematology of fishes. In: WEISS, D.J.; WARDROP, K.J. Schalm’s veterinary hematology. 6.ed. Iowa: Ames, 2010. 1206p.
MARTINS, G.P. Soja crua em dietas para a tilápia-do-nilo (Oreochromis niloticus). 2011. 79 f. Dissertação (Mestrado em Aquicultura) – Universidade Estadual Paulista, Jaboticabal, SP.
PEZZATO, L.E. et al. Valor nutritivo dos alimentos utilizados na formulação de rações para peixes tropicais. Revista Brasileira de Zootecnia, v.38, supl. esp. p.43-51, 2009.
POPMA, T.J.; GREEN, B.W. Sex reversal of tilapia in earthen ponds. Aquaculture production manual. Alabama: Auburn University,
Alabama Research and Development, 1990. 15p. (Series 35).
RIGHETTI, J.S. et al. Protein reduction in diets for Nile tilapia by amino acids supplementation based on the ideal protein concept. Revista Brasileira de Zootecnia, v.40, n.3, p.469-476, 2011. Available from:
<http://dx.doi.org/10.1590/S1516-35982011000300002>. Accessed: Dec. 10, 2015. doi: 10.1590/S1516-35982011000300002.
SAKOMURA, N.K.; ROSTAGNO, H.S. Método dose-resposta para determinar exigências nutricionais. In: MÉTODOS DE PESQUISA EM NUTRIÇÃO DE MONOGÁSTRICOS, 2007, Jaboticabal, SP. Jaboticabal, SP: Funep, p.156-194.
STOCKHAM, S.L.; SCOTT, M.A. Fundamentos de patologia clínica veterinária. 2.ed. Rio de Janeiro: Guanabara Koogan, 2011. 729p.
STOREBAKKEN, T. et al. Digestibility of macronutrients, energy and amino acids, absorption of elements and absence of intestinal enteritis in Atlantic salmon, Salmo salar, fed diets with wheat
gluten. Aquaculture, v.184 p.115-132, 2000.