R E S E A R C H A R T I C L E
Open Access
An assessment on epitope prediction methods
for protozoa genomes
Daniela M Resende
1,2†, Antônio M Rezende
4,5†, Nesley JD Oliveira
4,5,6, Izabella CA Batista
2, Rodrigo Corrêa-Oliveira
2,
Alexandre B Reis
2,3and Jeronimo C Ruiz
4,7*Abstract
Background:Epitope prediction using computational methods represents one of the most promising approaches to vaccine development. Reduction of time, cost, and the availability of completely sequenced genomes are key points and highly motivating regarding the use of reverse vaccinology. Parasites of genusLeishmaniaare widely spread and they are the etiologic agents of leishmaniasis. Currently, there is no efficient vaccine against this pathogen and the drug treatment is highly toxic. The lack of sufficiently large datasets of experimentally validated parasites epitopes represents a serious limitation, especially for trypanomatids genomes. In this work we highlight the predictive performances of several algorithms that were evaluated through the development of a MySQL database built with the purpose of: a) evaluating individual algorithms prediction performances and their combination for CD8+ T cell epitopes, B-cell epitopes and subcellular localization by means of AUC (Area Under Curve) performance and a threshold dependent method that employs a confusion matrix; b) integrating data from experimentally validated andin silicopredicted epitopes; and c) integrating the subcellular localization predictions and experimental data. NetCTL, NetMHC, BepiPred, BCPred12, and AAP12 algorithms were used forin silicoepitope prediction and WoLF PSORT, Sigcleave and TargetP forin silicosubcellular localization prediction against
trypanosomatid genomes.
Results:A database-driven epitope prediction method was developed with built-in functions that were capable of: a) removing experimental data redundancy; b) parsing algorithms predictions and storage experimental validated and predict data; and c) evaluating algorithm performances. Results show that a better performance is achieved when the combined prediction is considered. This is particularly true for B cell epitope predictors, where the combined prediction of AAP12 and BCPred12 reached an AUC value of 0.77. For T CD8+ epitope predictors, the combined prediction of NetCTL and NetMHC reached an AUC value of 0.64. Finally, regarding the subcellular localization prediction, the best performance is achieved when the combined prediction of Sigcleave, TargetP and WoLF PSORT is used.
Conclusions:Our study indicates that the combination of B cells epitope predictors is the best tool for predicting epitopes on protozoan parasites proteins. Regarding subcellular localization, the best result was obtained when the three algorithms predictions were combined. The developed pipeline is available upon request to authors.
* Correspondence:[email protected] †
Equal contributors 4
Laboratório de Parasitologia Celular e Molecular, Instituto René Rachou, Av. Augusto de Lima, 1715, Barro Preto, Belo Horizonte, MG 30190-002, Brazil 7Centro Universitário UNA, Instituto de Ciências Biológicas e da Saúde (ICBS),
R. Guajajaras, 175, Centro, Belo Horizonte MG 30180-100, Brazil Full list of author information is available at the end of the article
Background
Reverse vaccinology uses the genome sequences of viral, bacterial or parasitic pathogens of interest rather than the cells as starting material for the identification of novel antigens, whose activity should be subsequently confirmed by experimental biology approaches [1]. In general, the aim of this approach is the identification of genes potentially encoding pathogenicity factors and secreted or membrane-associated proteins. In this con-text, specific algorithms suitable for thein silico identifi-cation of novel surface-exposed and, thus, antibody accessible proteins mediating a protective immune re-sponse are used [2].
Pizza and co-workers in collaboration with The Insti-tute for Genomic Research (TIGR) provided the first ex-ample of a successful application of the reverse vaccinology approach [3]. They described that in silico
identification of vaccine candidates against Neisseria meningitides serogroup B, which is the major cause of sepsis and meningitis in children and young adults, could be effective, while conventional approaches to ob-tain a vaccine had failed for decades.
New powerful genomic technologies have increased the number of diseases that can be addressed by vaccin-ation, and have reduced the time of discovery research and vaccine development [1]. Nowadays, it costs US$ 200–400 million to research, develop, manufacture and launch a new vaccine on the global market [4]. With the use of reverse vaccinology, time and cost spent on the search of new vaccine targets are significantly reduced.
Immunoinformatics is an emerging application of bio-informatics techniques that focuses on the structure, function, and interactions of the molecules involved in immunity. One of its main goals is the in silico predic-tion of immunogenicity at epitope level. Recently devel-oped in silico tools and databases can be used to identify, characterize or predict antigen epitopes recog-nized by T- and B-lymphocytes, cells that play significant roles in infection and protective immunity [5].
Epitopes are the minimal essential units of information derived from self and nonself proteins that stimulate cellular (T-cell) and humoral (B-cell) immune responses. T-cells recognize T-cell epitopes that are derived from endogenous and exogenous proteins and presented in the cleft of MHC class I or MHC class II molecules at the surface of antigen presenting cells to the T-cell re-ceptor. After the activation of CD8+ T cells or CD4+ T cells, respectively, cellular events, such as citotoxicity and cytokine secretion, will occur. B-cells also recognize epitopes, but generally intact proteins. B-cell epitopes can be linear, contiguous amino acids, or discontinuous amino acids that are brought together in folded proteins. After activation, B-cells differentiate into plasmocytes and start secreting antibodies. B- and T-cell responses
are called humoral and cellular adaptive immune responses, respectively, and they inform the immune system that a bacteria, virus, or parasite is present [6].
The subcellular localization of the protein is also im-portant to investigate, as immunogenic proteins have to be in contact with T- and B-cells in order to elicit a pro-tective immune response. In other words, correct sub-cellular localization is of great significance to the functional analysis of proteins [7]. Therefore, various prediction methods have been developed to predict pro-teins’subcellular location in the recent decades [8]. Pre-diction methods to identify the subcellular location of proteins can be classified into two categories: one is based on the recognition of protein N-terminal sorting signals [9] and the other is based on amino acid com-position [10]. The predictors then combine these fea-tures with machine-learning techniques to decide which is the most probable location [11,12].
A large variety of machine-learning techniques are commonly used in bioinformatics, including artificial neural networks (ANNs) [13], hidden Markov models (HMMs) [14] and support vector machines (SVMs) [15]. ANNs and SVMs are ideally suited to recognize non-linear patterns, which are believed to contribute to, for instance, peptide-HLA-I interactions [16]. In an ANN, information is trained and distributed into a computer network with an input layer, hidden layers and an output layer all connected in a given structure through weighted connections [13]. Finally, HMMs are well suited to char-acterized biological motifs with an inherent structural composition, and have been used in the field of immun-ology to predict peptide binding to major histocompati-bility complex (MHC) class I molecules [17].
The use of database system has been constant in the life of researchers and professionals in several fields. Conceptually, a database should be able to provide an easy access to experimental results and lexical surveys, preventing redundancy and wasteful duplication of re-search data. A well-designed database should also be able to provide support to researchers, facilitating guided searches for novel correlations in data. On the other hand, a poorly designed database makes the data mining process difficult and the new data integration infeasible for regular users [18] and in this perspective, the rebuilding and redesigning processes are frequent [18,19].
stages or different facets of biological phenomena [20]. Also, biological data present a particularity: they are highly complex when compared with data from most of other applications. Thus, definitions of such biological data must be able to represent a complex substructure of data as well as their relationships, and also ensure that no information is lost during the biological data modeling. The data model must be able to represent any level of complexity in any data schema, relationship, or schema substructure and not just in a hierarchical, bin-ary, or tabular data format [21].
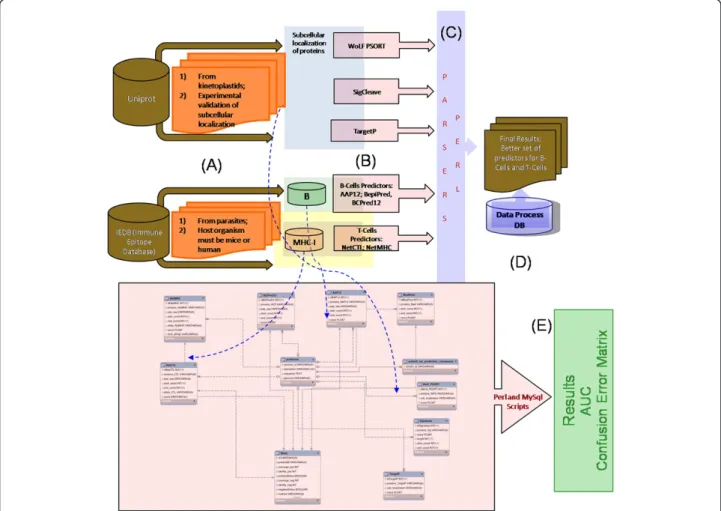
The main objective of this present work was to build a database-driven epitope prediction method capable of accurately predicting parasite B- and T-cell epitopes, as well as subcellular localization of parasites proteins (Figure 1). The interface language used was standard SQL (Standard Query Language) and several built-in functions were implemented, but are not limited to, the following: a) parse algorithms predictions and storage of
experimental validated and predicted data; and b) evalu-ation of algorithm performances.
Results
MHC-I epitopes prediction
Several approaches that predict peptide binding to MHC molecules have been published [22]. In this study we opt for two currently available algorithms, NetCTL [22] and NetMHC [23]. Our choice for these MHC class I epitope prediction algorithms was made in terms of ISI citation indexes and regarding their availability for download and local machine implementation.
When possible, in order to establish the ideal settings for protozoan epitope prediction, the algorithms para-meters were scanned and evaluated in terms of AUC values. In this framework, the NetCTL score threshold parameter was ranged from 0.50 to 0.90. The NetCTL and NetMHC algorithms outputs were parsed and the data of 3,906 in silico predicted epitopes loaded into
MySQL database. In order to evaluate the algorithm per-formances, predicted epitopes [see Additional file 1 and Additional file 2] were aligned against the consensus ex-perimentally validated dataset for MHC class I epitopes. Figure 2 presents an overview of the benchmark ap-proach undertaken in this study (see Methods Section for more details). In addition, we carried out a combined performance analysis using the best score threshold found for each methodology (Table 1).
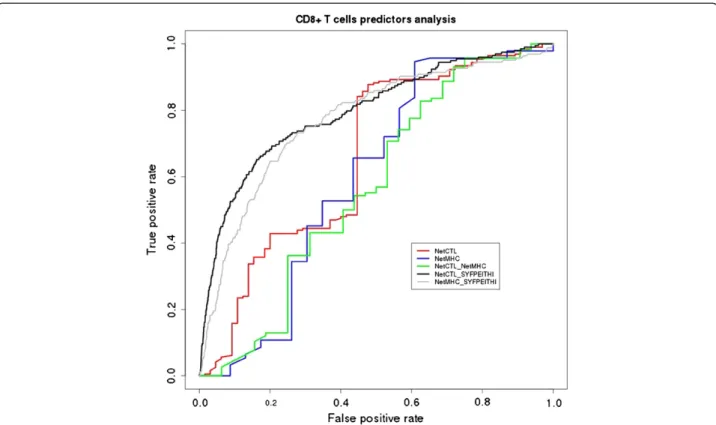
The AUC performance measure obtained for NetCTL was 0.66 (for a score threshold of 0.50) and for NetMHC was 0.60 (score thresholds cannot be modified by the user). On the other hand, the combined performance of these algorithms produced an AUC value of 0.64 (Table 1, Figure 3).
B-cell epitopes prediction
Following the same rational described above for MHC I algorithm selection, three currently available algorithms were chosen, BepiPred [24], BCPred12 [25] and AAP12 [26]. When possible, in order to establish the ideal set-tings for protozoan epitope prediction, the algorithms parameters were scanned and then evaluated in terms of AUC values. In this framework, the score thresholds par-ameter ranged from 0.15 to 0.90 for BepiPred and from 0.50 to 0.90 for AAP12 and BCPred12.
Using the developed pipeline, the default algorithms outputs were parsed and the data of 187,187 in silico
predicted epitopes [see Additional file 3, Additional file 4 and Additional file 5] loaded into the MySQL data-base. In order to evaluate the algorithm performances, predicted epitopes were aligned against the consensus experimentally validated dataset for B cell epitopes. Fur-thermore, we carried out a combined performance ana-lysis using the best score threshold found for each methodology (Table 1, Figure 4).
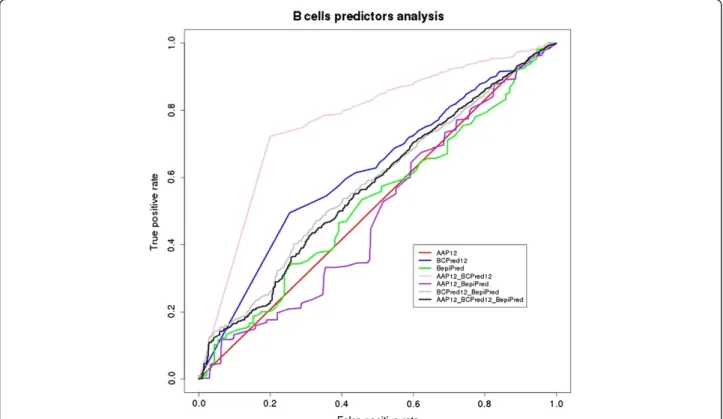
The AUC performance measure obtained was: 0.53 for BepiPred using a threshold of 0.40; 0.52 for AAP12 using a threshold of 0.80; and 0.62 for BCPred12 using a threshold of 0.90 (Table 1). Regarding the combined per-formance analysis performed for these algorithms, the following results were found: 0.77 for AAP12 and BCPred12; 0.49 for AAP12 and BepiPred; 0.58 for BCPred12 and BepiPred; and 0.57 for AAP12, BCPred12 and BepiPred.
Subcellular localization of proteins prediction
Regarding prediction of subcellular localization of pro-teins, three currently available algorithms were selected, WoLF PSORT [27], Sigcleave [28] and TargetP [11]. Using the developed pipeline, the default algorithms out-puts were parsed and the data of 538in silicopredictions loaded into the MySQL database. In order to evaluate the algorithms performances, an experimental validated
Figure 2Strategy employed to assess the predictors’performance.The scale bar represents the sequence of a theoretical protein of 120 amino acids. Dark blue rectangles represent one single epitope or a consensus of overlapping epitopes that were experimentally validated according to IEDB (Positive exp.); light blue rectangles represent one single non-immunogenic region or a consensus of overlapping
non-immunogenic regions that were experimentally validated according to IEDB (Negative exp.); red rectangles represent the predicted epitopes from evaluated algorithms. For B cell prediction the predicted epitopes were considered true positive if they aligned with minimum coverage of 50% and 100% of identity with a Positive Exp. Region; for CD8+ T cell prediction the predicted epitopes were considered true positive if they aligned with minimum coverage of 87% and 100% of identity with a Positive Exp. region (Prediction 1, Prediction 2, Prediction 3 and Prediction 11). For B cell prediction the predicted epitopes were considered false positive if they aligned with minimum coverage of 50% and 100% of identity with a Negative Exp. Region; for CD8+ T cell prediction the predicted epitopes were considered false positive if they aligned with minimum coverage of 87% and 100% of identity with a Negative Exp. region (Prediction 6, Prediction 7, Prediction 8 and Prediction 13). Predictions were not considered during the analysis if they did not align with the parameters cited above (Prediction 4, Prediction 5, Prediction 9 and Prediction 10) or if they aligned with both Positive exp. and Negative exp. (Prediction 12).
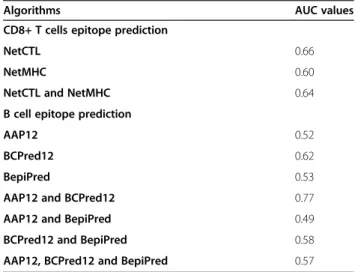
Table 1 Algorithms performance evaluation for B cell epitope prediction and CD8+ T cells epitope prediction
Algorithms AUC values
CD8+ T cells epitope prediction
NetCTL 0.66
NetMHC 0.60
NetCTL and NetMHC 0.64
B cell epitope prediction
AAP12 0.52
BCPred12 0.62
BepiPred 0.53
AAP12 and BCPred12 0.77
AAP12 and BepiPred 0.49
BCPred12 and BepiPred 0.58
dataset of 180 proteins with described subcellular localization was loaded in addition to in silico predic-tions. Results show that WoLF PSORT was capable of correctly predicting 27/44 (61.36%) secreted proteins, Sigcleave, 30/44 (68.18%), and TargetP, 32/44 (72.73%), showing that the proportion of correctly predicted bin-ders (sensitivity) was similar between the three algo-rithms (Table 2). Files containing predictions made by each algorithm are available as Additional files [see for WoLF PSORT, Additional file 6; for Sigcleave, Additional file 7; for TargetP, Additional file 8].
The evaluation of the intersecting portion of predic-tions made by the tested algorithms showed that, from 40 protozoan proteins with extracellular localization ex-perimentally determined, 19 (~48%) were correctly pre-dicted by all three algorithms (Figure 5).
Discussion
Despite of being a major public health problem in sev-eral countries, the life-threatening diseases caused by protozoan parasites represent a challenge in terms of vaccine development and nowadays there is no efficient vaccine against these parasites.
Epitope prediction by computational methods repre-sents one of the most promising approaches to vaccine
development, but there are several drawbacks in the process regarding trypanosomatid genomes. In this con-text, the lack of sufficiently large datasets of experimen-tally validated protozoan epitopes represents a serious limitation for validation of parasite in silico epitope prediction.
Several prediction methods were developed, but none of them had protozoan parasites data as training dataset (for some of them, protozoan parasites proteins represent only about 10% of the training dataset [24,25,29-32]) and, consequently, these results can be biased and should be treated with a grain of salt. The general wisdom is that the performance of epitope pre-diction methods critically depends on the dataset used for training and also on protein compositional bias. In addition, it is influenced by the evaluation criteria. Regarding epitope prediction in parasite genomes, these drawbacks are noteworthy considering that these organ-isms have a genome content that reflects proteins with a particular physicochemical profile and that are underre-presented in training datasets.
For this reason, we do not try to rank various predic-tion methods. Rather, we focus on the key concepts and ideas in the field. Thus, we evaluated algorithm perfor-mances focusing on parasites genomes. Comparison
between algorithms was made in the basis of AUC (area under a ROC curve) values, which represent the probability that a randomly selected positive instance will score higher than a randomly selected negative instance [33].
Aiming at identifying a good set of tools for protozoan parasites epitope prediction and subcellular localization of proteins, we developed, in this work, a database ap-proach in order to integrate and evaluate the combined performances of some open source currently available algorithms for MHC class I and B-cell epitope predic-tion, as well as for subcellular localization using proto-zoan parasites proteins and epitopes experimentally identified.
Figure 4ROC (Received Operating Characteristics) curve representing the performance of B cells epitope predictors analyzed (AAP12, BCPred12 and BepiPred), from protozoan proteins database, and their combination.
Table 2 Analyzed parameters for subcellular location of proteins
Subcellular location of proteins
WoLF PSORT Sigcleave TargetP
Sensitivity 61.36% (27/44) 68.18% (30/44) 72.73% (32/44)
Specificity 93.38% (127/136) 76.47% (104/136) 79.41% (108/136)
PPV 74.29% (26/35) 48.39% (30/62) 53.33% (32/60)
NPV 88.11% (126/143) 88.14% (104/118) 90% (108/120)
Accuracy 85.39% (152/178) 74.44% (134/180) 77.78% (140/180)
Concerning the epitope prediction, a database schema was developed and implemented integrating experimen-tal validated data together with the information related to MHC I prediction (NetCTL and NetMHC algorithms) and B-cells prediction (BepiPred, AAP12 and BCPred12 algorithms).
The main source of experimental data was “Immune
Epitope Database and Analysis Resource”(IEDB) (http:// www.immuneepitope.org/) [34], that currently repre-sents the main source of linear and conformational epi-topes data. Besides, IEDB uses a metric that takes into account the number of references, number of positive assays, and total number of assays for each epitope which is crucial to extract an experimentally validated epitope subset with a high level of confidence for the benchmark.
Regarding MHC I prediction, our AUC results indicate a little difference in the performances related with NetCTL and NetMHC algorithms, 0.66 and 0.60 re-spectively. If we consider that it is reported that the MHC class I prediction methods have achieved an ac-curacy that in many cases allows for AUC values in the range 0.95-0.99 [22], both algorithms didn0t achieve the
expected performance. In fact, this is not the first time that underperformance of prediction algorithms is reported in literature. In a recent study, 167 9mer pep-tides fromInfluenza A virus were predicted as potential binders by NetMHC, and just 89 of them (53% of the pool) were confirmed as real binders [35]. Furthermore, the underrepresentation of protozoan proteins in the training datasets in general and the compositional bias certainly have a deep impact on epitope prediction methods and also in the benchmark. In fact, to highlight the different performances of tested algorithms in front of different datasets and exclude the influence of ap-proach undertaken, we evaluated the algorithm perfor-mances under the same framework but with the human proteins dataset available for download from NetCTL website [36-38]. The results for both NetCTL and NetMHC algorithms were considerably better than the results obtained for protozoan dataset. The AUC value for NetCTL was 0.80 and for NetMHC was 0.77 (Figure 3). In addition, our performance evaluation does not include MHCII prediction since experimental data was insufficiently represented (data not shown). In prac-tice, the prediction of MHC-peptide binding is far from perfect, but this fact does not preclude all the advances made in the last years in the field [21].
Regarding B-cell epitope prediction, our AUC results indicate a better performance for BCPred12 algorithms when compared to AAP12 and BepiPred (Table 1). Again the observed performances were inferior from those currently observed for B-cell epitope predictions [24]. This difference might be explained by same reasons
which were just discussed for MHCI prediction. Also for B-cell epitope prediction, this is not the first report in literature of low epitope prediction performance [39].
Lafuente and Reche (2009) believe launching a Critical Assesment of Techniques for Epitope Prediction will benefit the field. Under this program, computational methods will be used for blind de novo prediction of peptides that are immunogenic from query proteins that,
for evaluation purposes, has been experimentally
screened [21]. Considering that and the results obtained by us, we do believe this approach will be useful to bring advances to epitope prediction area.
Despite of the shortcomings cited above, the combined performance analysis seems to be a promising approach. For B-cell algorithms, when the combined performance analysis was made, the best combination performance was found for AAP12 and BCPred12 that reached an AUC value of 0.77, which is within the expect range reported [24].
Seen in the light of the results obtained, the developed approach calls attention to several points: a) The general prediction models used by currently available algorithms cannot be used with the same performance for different protein subsets (especially true for protozoan parasites); b) The need for studies in which the algorithm perfor-mances are evaluated for underrepresented and compos-itional biased proteins subsets; and c) The combinatorial prediction approach can improve the epitope prediction performance.
Concerning the subcellular localization prediction, the database schema developed also integrated experimental and predicted data for subcellular localization of pro-teins. Experimental data was obtained from UniProt (http://www.uniprot.org), and the in silico predictions made by WoLF PSORT, Sigcleave and TargetP algo-rithms. The result shows that there is not much differ-ence, in terms of percentage of matches, between the tested algorithms. Nevertheless, the Venn diagram ana-lysis related to true positives (extracellular localization) result shows that the tested algorithms match different proteins in the dataset, and the consensus prediction of the three algorithms would better define a protein located in the extracellular compartment.
Conclusions
Considering the public health importance of the studied organisms and the lack of studies specifically addressing epitope and subcellular localization prediction in these parasites, our results suggest that the algorithm
com-binatorial approach employed in the developed
speed up the process of data mining analysis and predic-tion of potential candidates for vaccine development.
Methods
Databases of experimentally tested epitopes
Two datasets of experimentally tested epitopes were built, one of B-cell epitopes and another of MHC-I epi-topes. Parasite proteins experimental datasets where extracted from Immune Epitope Database and Analysis Resource (IEDB) [34,40,41]. The following criteria were adopted for epitope selection: a) from protozoan para-sites; b) host organism must be mice or human. Selected epitopes were minimal epitopes, experimentally vali-dated as immunogenic [see Additional file 9 and Add-itional file 10, for B and T-cell epitopes, respectively] or non-immunogenic [see Additional file 11 and Additional file 12, for B and T-cell non-immunogenic regions, respectively].
Furthermore, several overlapping epitopes anchored in the same protein region were observed. In order to have a non-redundant set of experimentally validated regions for each protein from dataset, make sense for us to use what we call “the consensus validated region”, which consists to cluster the overlapping epitopes in a unique consensus region called “experimentally validated con-sensus region”.
Thus, the dataset of B-cell experimental epitopes ended up with 312 proteins and 866 experimentally vali-dated consensus regions including immunogenic and non-immunogenic [see Additional file 13 and Additional file 14, respectively]; for MHC-I epitopes, 81 proteins and 224 experimentally validated consensus regions in-cluding immunogenic and non-immunogenic assign-ments [see Additional file 15 and Additional file 16, respectively]. Furthermore, these data were used as input for the formatdb program (BLAST package) which pre-pares the sequences to be aligned as subject by the BLAST algorithm [42].
Database of proteins with experimentally validated subcellular localization
Proteins with experimentally validated subcellular
localization were obtained from UniProt. The search was done with the term “trypanosomatidae”, with the field “subcellular location” set to the confidence“ experimen-tal”, which retrieved 180 proteins with subcellular localization described experimentally [see Additional file 17 and Additional file 18]. This dataset was used to evaluate the three selected algorithms for subcellular localization prediction.
Selection of prediction tools
The prediction algorithms were selected taking into ac-count the possibility of being installed locally, and the
reliability of their predictions reported on literature. The predictions of the following algorithms were evaluated: a) for MHCI epitope prediction: NetCTL [22,32,43] and NetMHC [23,31,44]; b) for B-cell epitope prediction: BepiPred [24] and BCPreds [25,26,29], which included two methodologies, AAP12 and BCPred12; c) for protein subcellular localization prediction, WoLF PSORT [27], Sigcleave [28] and TargetP [11].
Score thresholds and allele used
Score thresholds used for CD8+ T cell epitope predictors ranged from 0.50 to 0.90 for NetCTL. We did not set the threshold value for NetMHC because this parameter is not variable in the NetMHC command line mode, so a unique value (0.426) was used for NetMHC. Concern-ing B cell epitope predictors, the score thresholds ranged from 0.50 to 0.90 for AAP12 and BCPred12 and from 0.15 to 0.90 for BepiPred.
For CD8+ T cell epitopes prediction, the human super-type A2 was the allele model used to scan MHC binding affinity. Other HLA alleles are present in IEDB, but regarding the protozoan proteins they are underrepre-sented in the non-redundant database used (see previous section). In addition, the supertype HLA-A2 is included in a group which is expressed in 88% of the population, what illustrates the relevance of the supertype used in this work.
Development of parsers and algorithms
Parsers and algorithms were developed in PERL and SQL languages in order to extract the results obtained after running the programs and help to integrate all the results in the relational database.
Construction of relational database
To aggregate all information generated during the devel-opment of the project we used MySQL as a Relational Database Management System (RDBMS) (http://www. mysql.com). The use of a database system in this work represents a manner of getting a data receptacle or con-ceptual repository from which was possible to extract data correlation and results. The MySQL GUI Tools (http://dev.mysql.com/downloads/gui-tools/5.0.html) were used as a graphical user interface for our MySQL data-base. The entity-relational model (ERM) was built using MySQL Workbench (http://wb.mysql.com). For automatic data parsing and to load information into database, Perl scripts using DBI and BioPerl modules were developed. An overview of implemented workflow is presented in Figure 1.
Analysis of the epitopes results
AUC performance analyses. After the identification of the regions of the source proteins which were assigned as consensus experimentally validated regions (im-munogenic or non-im(im-munogenic), and with the results of the predictions made by the tested algorithms stored on the constructed relational database, we iden-tified the True Positives (TP) and False Positives (FP) hits. This information was employed in the AUC per-formance analysis.
In our methodology, we classified the predicted epi-topes as TP or FP using the results produced from BLAST algorithm [42]. The following parameters were utilized to decide if a prediction was going to be consid-ered as TP: 1) the local alignment between an epitope prediction (query) and an immunogenic consensus ex-perimentally validated region (subject) had to have min-imal query coverage (50% for B cell prediction and 87% for CD8+ T cell). In addition, the coverage cutoff was established based on a minimum size of B cell and CD8 + T cell found in the experimental epitopes database used (IEDB) which are 6 and 8 amino acids respectively. The NetCTL and NetMHC algorithms predict epitopes with 9 amino acids, thus 87% of coverage guarantees the minimum epitope alignment size of 8 amino acids. By the other hand, the AAP12 and BCPred12 algorithms predict epitopes with 12 amino acids, therefore 50% of coverage guarantees the minimum epitope alignment size of 6 amino acids. Regarding the BepiPred algorithm, since it predicts epitopes with variable sizes, only those with at least 6 amino acids were considered in the ana-lysis. Specifically for predictions ranging from 6 to 11 amino acids, the coverage cutoff varied to guarantee a minimal amino acid alignment length of 6 residues. 2) The local alignment between an epitope prediction and a consensus experimentally validated region (immuno-genic) had to have 100% of identity. This parameter was used to confirm that a given subject extracted from an alignment exactly matches with the real query. 3) Finally, in order to guarantee subject and query reciprocity the query name and the subject name must be the same. Using the same rational a prediction was considered FP, but the alignment analyses were made using as subject
the non-immunogenic consensus experimentally vali-dated region. Predicted epitopes that did not align with the parameters cited just above or if they aligned with both immunogenic and non-immunogenic consensus experimentally validated region were not considered for further analysis.
Algorithms combined predictions
To perform the combined prediction we adopted the fol-lowing rational: 1) for a given protein, the experimental regions are indexed and so, considering a protein (P) with three experimental validated regions, they would be named P1, P2 and P3; 2) if a given algorithm A predicts an epitope that matches with P2 for instance and an-other algorithm B predicts an epitope that also matches with P2 they are considered a combined prediction; 3) if a given algorithm A predicts an epitope that matches with P2 and another algorithm B predicts an epitope that matches with P1 or P3 they are not considered as a combined prediction.
Based on the above rules, the combined prediction score was calculated as the mean of the individual nor-malized scores of the original predictions. The score normalization was done as follows:
NS=(PS-MLS)/((MHS-MLS)/100), where:
NS = normalized score; PS = prediction score;
MLS = methodology lowest score; MHS = methodology highest score.
Accuracy evaluation
A non-parametric performance measure was used to avoid the influence of arbitrary thresholds. In order to carry out an accuracy evaluation, we used the area under the ROC curve, or simply AUC, that aggregates the model’s behavior for all possible decision thresholds. The nonparametric estimate of the AUC [45] was calcu-lated through an implemented GNU R package called ROCR [33].
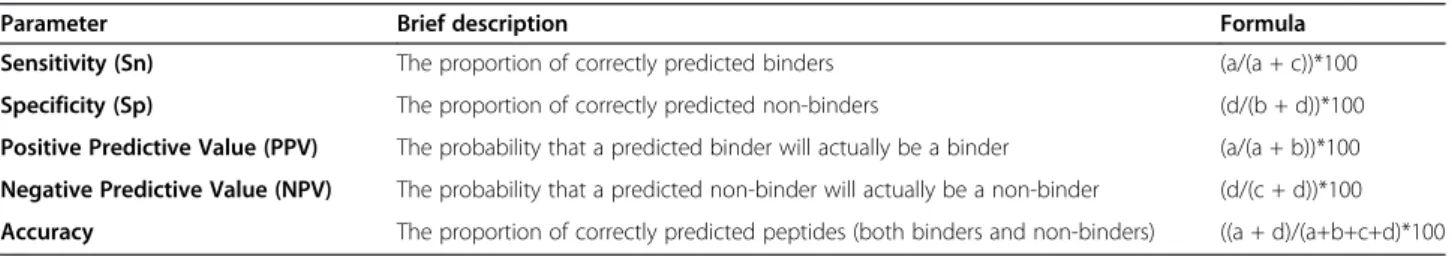
Table 3 Parameters used in the analysis of the results
Parameter Brief description Formula
Sensitivity (Sn) The proportion of correctly predicted binders (a/(a + c))*100
Specificity (Sp) The proportion of correctly predicted non-binders (d/(b + d))*100
Positive Predictive Value (PPV) The probability that a predicted binder will actually be a binder (a/(a + b))*100
Negative Predictive Value (NPV) The probability that a predicted non-binder will actually be a non-binder (d/(c + d))*100
Accuracy The proportion of correctly predicted peptides (both binders and non-binders) ((a + d)/(a+b+c+d)*100
Analysis of the subcellular localization results
In order to analyze the subcellular localization predic-tion results, we determined the True Positives (TP), True Negatives (TN), False Positives (FP) and False Negatives (FN). This information was incorporated into a confus-ing error matrix that allowed the determination of parameters: sensitivity (Sn), specificity (Sp), positive pre-dictive value (PPV), negative prepre-dictive value (NPV) and accuracy (Table 3).
Additional files
Additional file 1:Epitopes predicted by NetCTL.This file in fasta format contains 2,657 epitopes predicted by NetCTL.
Additional file 2:Epitopes predicted by NetMHC.This file in fasta format contains 1,249 epitopes predicted by NetCTL.
Additional file 3:Epitopes predicted by BepiPred.This file in fasta format contains 5,450 epitopes predicted by BepiPred.
Additional file 4:Epitopes predicted by AAP12.This file in fasta format contains 138,987 epitopes predicted by AAP12.
Additional file 5:Epitopes predicted by BCPred12.This file in fasta format contains 42,750 epitopes predicted by BCPred12.
Additional file 6:Predictions made by WoLF PSORT.This file contains predictions made by WoLF PSORT.
Additional file 7:Predictions made by Predictions made by Sigcleave.This file contains predictions made by Sigcleave.
Additional file 8:Predictions made by TargetP.This file contains predictions made by TargetP.
Additional file 9:B-cell minimal epitopes experimentally validated extracted from IEDB.This file in fasta format contains 3,021 B-cell minimal epitopes from parasite proteins experimentally validated as immunogenic extracted from IEDB.
Additional file 10:CD8+ T cell minimal epitopes experimentally validated extracted from IEDB.This file in fasta format contains 228 CD8+ T cell minimal epitopes from parasite proteins experimentally validated as immunogenic extracted from IEDB.
Additional file 11:B-cell non-immunogenic regions experimentally validated extracted from IEDB.This file in fasta format contains 3,039 B-cell non-immunogenic regions from parasite proteins experimentally validated extracted from IEDB.
Additional file 12:CD8+ T cell non-immunogenic regions experimentally validated extracted from IEDB.This file in fasta format contains 166 CD8+ T cell non-immunogenic regions from parasite proteins experimentally validated extracted from IEDB.
Additional file 13:B-cell immunogenic consensus regions experimentally validated.This file in fasta format contains 607 B-cell immunogenic consensus regions from parasite proteins experimentally validated.
Additional file 14:B-cell non-immunogenic consensus regions experimentally validated.This file in fasta format contains 243 B-cell non-immunogenic consensus regions from parasite proteins experimentally validated.
Additional file 15:CD8+ T cell immunogenic consensus regions experimentally validated.This file in fasta format contains 140 CD8+ T cell immunogenic consensus regions from parasite proteins
experimentally validated.
Additional file 16:CD8+ T cell non-immunogenic consensus regions experimentally validated.This file in fasta format contains 84 CD8+ T cell cell non-immunogenic consensus regions from parasite proteins experimentally validated.
Additional file 17:Trypanosomatid proteins with experimentally validated subcellular localization extracted from Unitprot.This file contains a list of 180 trypanosomatid proteins with its subcellular localization experimentally validated extracted from Uniprot.
Additional file 18:Trypanosomatid proteins in fasta format with experimentally validated subcellular localization.This file in fasta format contains 180 trypanosomatid proteins with its subcellular localization experimentally validated.
Competing interests
The authors declare that they have no competing interests.
Authors’contributions
DMR obtained the experimental tested epitopes and source proteins, selected the algorithms to be tested, run the selected algorithms, participated in the analysis of the results, and wrote the manuscript. AMR developed the algorithms for prediction performance analyses, participated in the analysis of the results and in the writing process of the manuscript. NJDO constructed and populated the relational database, developed algorithms in SQL language and participated in the analysis of the results; DMR, AMR and JCR developed parsers in PERL language that made possible results extraction and load the data into the relational database. ICAB monitored the analysis of the selected algorithms. ABR was involved with the conceptual design the study and RCO provided useful discussions for this work. JCR was involved in the drafting process of the manuscript and in the experimental and conceptual design of the study. All authors read and approved the final manuscript.
Acknowledgements
We thank for the following institutions and agencies for their past and current support for our research: FAPEMIG (Fundação de Amparo à Pesquisa do Estado de Minas Gerais; CNPq (Conselho Nacional de Desenvolvimento Científico e Tecnológico); Instituto René Rachou (IRR/FIOCRUZ Minas); Universidade Federal de Ouro Preto (UFOP); Programa de Pós-graduação em Ciências Farmacêuticas (CiPharma) Pontifícia Universidade Católica (PUC-MG) and Centro Universitário UNA. Grants FAPEMIG (PRONEX 503/07 and PPP APQ-04554-10), CNPq (GENOPROT 560943/2010-5 and Universal 478100/ 2011-6) and CAPES (PNPD 2009). JCR is also supported by the following grants: CNPq 476898/2008-0 and 476539/2010-2; FAPEMIG APQ-02382-10 and APQ-01835-10. Fellowships were provided by CNPq to ABR, RCO, RT and PCR, by CAPES to DMR and by FAPEMIG to ICAB. We would like to thank Patrícia Cássia Ruy and Raul Torrieri for the comments given at the beginning of this work.
Author details
1Programa de Pós-graduação em Ciências Farmacêuticas (CiPharma),
Laboratório de Pesquisas Clínicas, Escola de Farmácia, Universidade Federal de Ouro Preto, Campus Morro do Cruzeiro, Ouro Preto, MG 35400-000, Brazil. 2Laboratório de Imunologia Celular e Molecular, Instituto René Rachou, Av.
Augusto de Lima, 1715, Barro Preto, Belo Horizonte, MG 30190-002, Brazil. 3Laboratório de Imunopatologia, Núcleo de Pesquisas em Ciências
Biológicas, Universidade Federal de Ouro Preto, Campus Morro do Cruzeiro, ICEB II, Ouro Preto, MG 35400-000, Brazil.4Laboratório de Parasitologia Celular e Molecular, Instituto René Rachou, Av. Augusto de Lima, 1715, Barro Preto, Belo Horizonte, MG 30190-002, Brazil.5Departamento de Bioquímica e Imunologia, Instituto de Ciências Biológicas, Universidade Federal de Minas Gerais, Av. Antônio Carlos, Pampulha, 662731270-901 Belo Horizonte, MG, Brazil.6Pontifícia Universidade Católica, R. Rio Comprido, 4580, Monte Castelo, Contagem, MG 32285-040, Brazil.7Centro Universitário UNA, Instituto de Ciências Biológicas e da Saúde (ICBS), R. Guajajaras, 175, Centro, Belo Horizonte MG 30180-100, Brazil.
Received: 15 March 2012 Accepted: 11 November 2012 Published: 21 November 2012
References
1. Bambini S, Rappuoli R:The use of genomics in microbial vaccine development.Drug DiscovToday2009,14(5–6):252–260.
3. Pizza M, Scarlato V, Masignani V, Giuliani MM, Arico B, Comanducci M, Jennings GT, Baldi L, Bartolini E, Capecchi B,et al:Identification of vaccine candidates against serogroup B meningococcus by whole-genome sequencing.Science2000,287(5459):1816–1820.
4. Andre FE:Overview of a 5-year clinical experience with a yeast-derived hepatitis B vaccine.Vaccine1990,8(Suppl):S74–S78.
5. Korber B, LaBute M, Yusim K:Immunoinformatics comes of age.
PLoSComputBiol2006,2(6):e71.
6. Borja-Cabrera GP, Cruz Mendes A, Paraguai De Souza E, Hashimoto Okada LY, De ATFA, Kawasaki JK, Costa AC, Reis AB, Genaro O, Batista LM,et al:
Effective immunotherapy against canine visceral leishmaniasis with the FML-vaccine.Vaccine2004,22(17–18):2234–2243.
7. Emanuelsson O, von Heijne G:Prediction of organellar targeting signals.
BiochimBiophysActa2001,1541(1–2):114–119.
8. Feng ZP:An overview on predicting the subcellular location of a protein.
In SilicoBiol2002,2(3):291–303.
9. Bannai H, Tamada Y, Maruyama O, Nakai K, Miyano S:Extensive feature detection of N-terminal protein sorting signals.Bioinformatics2002,
18(2):298–305.
10. Cedano J, Aloy P, Perez-Pons JA, Querol E:Relation between amino acid composition and cellular location of proteins.JMolBiol1997,
266(3):594–600.
11. Emanuelsson O, Nielsen H, Brunak S, von Heijne G:Predicting subcellular localization of proteins based on their N-terminal amino acid sequence.
JMolBiol2000,300(4):1005–1016.
12. Hua S, Sun Z:Support vector machine approach for protein subcellular localization prediction.Bioinformatics2001,17(8):721–728.
13. Baldi P, Atiya AF:How delays affect neural dynamics and learning.IEEE TransNeural Netw1994,5(4):612–621.
14. Hughey R, Krogh A:Hidden Markov models for sequence analysis: extension and analysis of the basic method.ComputApplBiosci1996,
12(2):95–107.
15. Vapnik V, Vashist A:A new learning paradigm: learning using privileged information.Neural Netw2009,22(5–6):544–557.
16. Lundegaard C, Lund O, Kesmir C, Brunak S, Nielsen M:Modeling the adaptive immune system: predictions and simulations.Bioinformatics 2007,23(24):3265–3275.
17. Mamitsuka H:Predicting peptides that bind to MHC molecules using supervised learning of hidden Markov models.Proteins1998,
33(4):460–474.
18. Shekhar S, Chawla S:Spatial databases: a tour. Upper Saddle River: Prentice-Hall; 2002.
19. Elmasri RA, Navathe SB:Fundamentals of databases systems. New York: Addision-Wesley Pubishing; 2000.
20. Markowitz VM:Biological data management in a dataspace framework: biological data management and technology center. Philadelphia: Lawrence Berkeley National Laboratory; 2006.
21. Ostell JM, Wheelan SJ, Kans JA:The NCBI Data Model. In: Bioinformatics: A Practical Guide to the Analysis of Genes and Proteins. In. 2nd edition Edited by Baxevanis AD, Ouellette BFF. New York: John Wiley & Sons Publishing; 2001:19–44.
22. Larsen MV, Lundegaard C, Lamberth K, Buus S, Lund O, Nielsen M: Large-scale validation of methods for cytotoxic T-lymphocyte epitope prediction.BMC Bioinforma2007,8:424.
23. Nielsen M, Lundegaard C, Worning P, Hvid CS, Lamberth K, Buus S, Brunak S, Lund O:Improved prediction of MHC class I and class II epitopes using a novel gibbs sampling approach.Bioinformatics2004,20(9):1388–1397. 24. Larsen JE, Lund O, Nielsen M:Improved method for predicting linear
B-cell epitopes.ImmunomeRes2006,2:2.
25. El Manzalawy Y, Dobbs D, Honavar V:Predicting linear B-cell epitopes using string kernels.JMolRecognit2008,21(4):243–255.
26. Chen J, Liu H, Yang J, Chou KC:Prediction of linear B-cell epitopes using amino acid pair antigenicity scale.AminoAcids2007,33(3):423–428. 27. Horton P, Park KJ, Obayashi T, Fujita N, Harada H, Adams-Collier CJ, Nakai K:
WoLF PSORT: protein localization predictor.Nucleic Acids Res2007,
35(Web Server issue):W585–W587.
28. von Heijne G:A new method for predicting signal sequence cleavage sites.Nucleic Acids Res1986,14(11):4683–4690.
29. El Manzalawy Y, Dobbs D, Honavar V:Predicting flexible length linear B-cell epitopes.ComputSystBioinformatics Conf2008,7:121–132.
30. Nielsen M, Lund O:NN-align. An artificial neural network-based alignment algorithm for MHC class II peptide binding prediction.BMC Bioinforma2009,10:296.
31. Nielsen M, Lundegaard C, Worning P, Lauemoller SL, Lamberth K, Buus S, Brunak S, Lund O:Reliable prediction of T-cell epitopes using neural networks with novel sequence representations.Protein Sci2003,
12(5):1007–1017.
32. Peters B, Bulik S, Tampe R, Van Endert PM, Holzhutter HG:Identifying MHC class I epitopes by predicting the TAP transport efficiency of epitope precursors.JImmunol2003,171(4):1741–1749.
33. Wu S, Flach P:A scored AUC metric for classifier evaluation and selection, ROCML workshop at ICML. Bonn: Citeseer; 2005.
34. Vita R, Zarebski L, Greenbaum JA, Emami H, Hoof I, Salimi N, Damle R, Sette A, Peters B:The immune epitope database 2.0.Nucleic Acids Res2009,
38(Database issue):D854–D862.
35. Wang M, Lamberth K, Harndahl M, Roder G, Stryhn A, Larsen MV, Nielsen M, Lundegaard C, Tang ST, Dziegiel MH,et al:CTL epitopes for influenza A including the H5N1 bird flu; genome-, pathogen-, and HLA-wide screening.Vaccine2007,25(15):2823–2831.
36. NetCTL: http://www.cbs.dtu.dk/suppl/immunology/CTL-1.2.php. 37. NetCTL SYFPEITHI dataset: http://www.cbs.dtu.dk/suppl/immunology/
CTL-1.2/syf.data.fsa.
38. Larsen MV, Lundegaard C, Lamberth K, Buus S, Brunak S, Lund O, Nielsen M:
An integrative approach to CTL epitope prediction: a combined algorithm integrating MHC class I binding, TAP transport efficiency, and proteasomal cleavage predictions.Eur J Immunol2005,35(8):2295–2303. 39. Sebatjane S, Pretorius A, Liebenberg J, Steyn H, Van Kleef M:In vitro and
in vivo evaluation of five low molecular weight proteins of ehrlichia ruminantium as potential vaccine components.Vet Immunol Immunopathol2010,137(3–4):217–225.
40. Vita R, Peters B, Sette A:The curation guidelines of the immune epitope database and analysis resource.Cytometry A2008,73(11):1066–1070. 41. Vita R, Vaughan K, Zarebski L, Salimi N, Fleri W, Grey H, Sathiamurthy M,
Mokili J, Bui HH, Bourne PE,et al:Curation of complex, context-dependent immunological data.BMC Bioinforma2006,7:341.
42. Altschul SF, Gish W, Miller W, Myers EW, Lipman DJ:Basic local alignment search tool.JMolBiol1990,215(3):403–410.
43. Nielsen M, Lundegaard C, Lund O, Kesmir C:The role of the proteasome in generating cytotoxic T-cell epitopes: insights obtained from improved predictions of proteasomal cleavage.Immunogenetics2005,57(1–2):33–41. 44. Buus S, Lauemoller SL, Worning P, Kesmir C, Frimurer T, Corbet S,
Fomsgaard A, Hilden J, Holm A, Brunak S:Sensitive quantitative predictions of peptide-MHC binding by a‘Query by Committee’artificial neural network approach.Tissue Antigens2003,62(5):378–384.
45. Sing T, Sander O, Beerenwinkel N, Lengauer T:ROCR: visualizing classifier performance in R.Bioinformatics2005,21(20):3940–3941.
doi:10.1186/1471-2105-13-309
Cite this article as:Resendeet al.:An assessment on epitope prediction methods for protozoa genomes.BMC Bioinformatics201213:309.
Submit your next manuscript to BioMed Central and take full advantage of:
• Convenient online submission
• Thorough peer review
• No space constraints or color figure charges
• Immediate publication on acceptance
• Inclusion in PubMed, CAS, Scopus and Google Scholar
• Research which is freely available for redistribution