www.scielo.br/aabc
How a simple and stereotyped acoustic signal transmits
individual information: the song of the White-browed Warbler
Basileuterus leucoblepharus
THIERRY AUBIN1, NICOLAS MATHEVON1, MARIA LUISA DA SILVA2 JACQUES M.E. VIELLIARD3∗ and FREDERIC SEBE1
1Equipe Communications Acoustiques, NAMC CNRS UMR 8620, Université Paris-Sud, Bât. 446 91405 Orsay Cedex, France
2Centro de Ciências Biológicas, Universidade Federal do Pará, Campus Universitário do Guamá 66075-110 Belém, PA, Brasil
3Laboratório de Bioacústica, Instituto de Biologia, Universidade Estadual de Campinas Cx. Postal 6109, 13083-970 Campinas, SP, Brasil
Manuscript received on January 15, 2004; accepted for publication on February 5, 2004.
ABSTRACT
The White-browed WarblerBasileuterus leucoblepharus, a common bird of the Brazilian Atlantic forest, emits only one distinct song type in the context of territorial defense. Individual or neighbor-stranger recognition may be more difficult when birds share similar songs. In fact, the analysis of songs of different individuals reveals slight differences in the temporal and the frequency domains. Effectively, a careful examination of the signals of different individuals (21) by 5 complementary methods of analysis reveals first, that one or two gaps in frequency occur between two successive notes at different moments of the song, and second, that their temporal and frequency positions are stereotyped for each individual. Playback experiments confirm these findings. By propagation experiments, we show that this individual information can be only transmitted at short range(<100 m)in the forest. In regard to the size and the repartition of territories, this communication process appears efficient and adaptive.
Key words:bird acoustic communication, individual information, tropical forest.
INTRODUCTION
In tropical forests, visual communication is lim-ited by obstacles and birds use mainly the acous-tic channel to communicate at long range (Chap-puis 1971, Marten et al. 1977, Waides and Narins 1988). However, in a dense vegetation, sounds are strongly modified during transmission over distance (Wiley and Richards 1982, Michelsen and Larsen 1983, Heuwinkel 1990, Dabelsteen et al. 1993). To
*Member of Academia Brasileira de Ciências Correspondence to: Thierry Aubin
E-mail: [email protected]
be effective, information transfer may rely upon pa-rameters resistant to degradation (Gish and Morton 1981, Brenowitz 1982, Mathevon and Aubin 1997, 2001).
A typical and abundant understory bird of the Brazilian Atlantic forest, the White-browed Warbler
to the degradation, the slow decreasing frequency modulation, and ignore parameters sensitive to prop-agation. With this common and stereotyped feature, birds transmit specific information at long range. But how are individuals able to distinguish each other with a so simple signal and in a so constrain-ing environment? To answer this question, we have made (1) acoustic analysis of songs of several indi-viduals to bring out the different possibilities of vo-cal signatures, (2) propagation experiments to eval-uate the active space of the information, and (3) playback experiments to understand the individual coding-decoding process.
MATERIALS AND METHODS
Subjects and Location
The experiments were performed in an Atlantic for-est of South-eastern Brazil, at Morro Grande State Reserve, during November 2000 and 2001, i.e. dur-ing the peak of the breeddur-ing season of the White-browed Warbler.
In the forest, the birds were distributed in patches of two to ten more or less contiguous territories. Male territories were first spotted and then mapped by a global positioning system (GPS) and territorial songs of the corresponding birds were recorded. According to our observations, the terri-tories corresponded roughly to a circle of 100 m diameter.
Recording and Playback Instrumentation Songs were recorded using an ultra-directional Sennheiser MKH 816 microphone and a Sony TCD-D10 DAT recorder (sampling frequency: 48 kHz; frequency response: flat within the range 20-20000 Hz) and subsequently digitized at a sampling fre-quency of 22 kHz. For propagation and playback experiments, the emission chain was constituted of a Sony TCD-D7 DAT recorder connected to an autonomous 10W amplifier equipped with an Au-dax loudspeaker (frequency response 100-8600 Hz ±2.5 dB). As reception chain for propagation
exper-iments, we used an omni-directional Beyer Dynamic
M-69 microphone (±2dB for frequency range 150-15000 Hz) connected to a Sony TCD-D10 DAT recorder.
Methods of Analysis
To identify the acoustic parameters likely to carry in-formation on individual identity, we have analyzed the songs of 21 individuals using 5 complemen-tary methods of analysis: a classification by arti-ficial neural network (ANN), a coefficient of vari-ation calculvari-ation (Cv), a principal component anal-ysis (PCA), an entropy calculation (2H) and a time and spectral decomposition examination.
ANN: this method is now widely used as a pow-erful classification technique in bioacoustics (Reby et al. 1997). In the present study, we have used a ZiscLab system (Durr and Sarton 2001) consisting of a fully classical parallel architecture with 3 lay-ers. The principle was to analyze the shape of the instantaneous frequency, calculated with the Hilbert transform (see Mbu Nyamsi et al. 1994, for the method), of the entire song of different individuals. A learning phase was first computed by an algorithm updating the connection weights between neurons so as to obtain the correct discrimination of a set of signals for which the identity of the individual was known. Once the learning phase was achieved, connection weights were definitively fixed and the classification by ANN could run with a set of test songs.
1 2 3 4 s 2
4 6 8 10 kHz
1
Fmax Fn1 Fn2 Fn 3
FaGap
Fmin FbGap TotDur
TGap
Tn2
Tn1
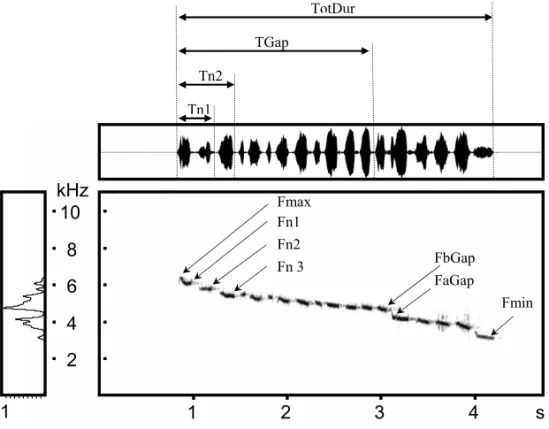
Fig. 1 – Typical territorial song ofBasileuterus leucoblepharusand measures done in the temporal and frequency domains (abbreviations: see text).
note before the main gap (FbGap), the frequency of the first note after the main gap (FaGap), the fre-quencies of the first (Fn1), second (Fn2) and third (Fn3) notes, and the frequency value of the main gap (FGap); (3) in both domains: the total number of notes (Totn), the number of notes before the main gap (nGap), the mean slope of the whole song (Tot-Slope), and the mean slope of the song before the gap (GapSlope).
Coefficients of variation for mean values of each acoustic feature were calculated for each indi-vidual (mean CVi). An inter-individual coefficient of variation (CVb) was also calculated using mean characteristics of the songs from each of the individ-uals analyzed. CViand CVb were calculated from the formula CV=100∗(1+1/4n)∗sd/x (Scherrer 1984). Ratios CVb/mean CViwere then calculated.
2H: on the basis of the theory of information
(Shan-non and Weaver 1949), Beecher (1982, 1989) de-veloped a method to assess the efficiency of a vocal signature in animal communication systems. The
aim of this method, mainly based upon the analysis of variances made on acoustic parameters, was to provide an information capacity measure (H) of an individual signature. H is expressed as:
H =log2 σ
b σi
=log2
Fn(k−1)
k(n−k)
with F corresponding to the ANOVA Fisher’s value, n to the number of calls and k to the number of individuals.
Then, 2H gives a theoretical estimate of the number of potential signatures achievable for a given parameter.
and Efi, for respectively the temporal and the fre-quency domains) were compared to those coming from different individuals (Etb and Efb). The advantage of this method is that no acous-tic parameters were ‘‘a priori’’ selected by the observer, except the temporal and frequency band-widths (frames) used in calculation.
Propagation Procedure
To assess the modifications of signals during prop-agation through the natural habitat, a typical song of the species was broadcast repetitively (10 signals separated by 6 s of silence) and recorded at different distances. The test sequence was transmitted along a 100 m transect through an area representative of the natural habitat of the White-browed Warbler. The speaker and microphone heights (6 m) were chosen so as to represent the natural song perches and re-ceiver locations. Four microphone-loudspeaker dis-tances were tested: 1.5 m, 25 m, 50 m, 100 m. These distances represent common distances between in-teracting birds. The signal was broadcast at a natu-ral Sound Pressure Level (SPL), i.e. on average 90 dBSPLmeasured at 1m from the loudspeaker.
Among the ten propagated signals, recorded songs with overlapping foreign signals in the vicin-ity of the microphone were first eliminated. Then, among the remaining signals, only 3 were chosen at random for subsequent analysis. The spectrograms corresponding to the 3 selected signals were aver-aged using Avisoft SasLab Pro software and the av-eraged spectrograms corresponding to the different distances of propagation were then compared.
Playback Procedure
Before playback experiments, two loudspeakers were positioned, one at the center of the territory near the main song post of the territory holder and the second 25 m ahead, inside the territory. The song of a stranger was broadcast by the first loud-speaker in order to attract the bird towards the cen-ter of his cen-territory. Five minutes lacen-ter, another sig-nal (the song of a neighbor or the modified song
of this neighbor) was played-back with the second loudspeaker and the behavior of the bird was noted. Typically, in natural conditions, a territory holder replies to the song of a stranger by a song followed by an approach to the song source. When it heard a neighbor’s song from the neighbor’s territory, the territory holder being tested sometimes sang in reply and sometimes not, but did not approach the sound source. In our playback experiments, the first be-havior, typical when hearing a stranger’s song, was indicated by ‘‘+’’ and the second behavior, corre-sponding to hearing the neighbor’s song, was indi-cated by ‘‘–’’ when the tested bird sang and ‘‘– –’’ when it did not sing. To avoid habituation, each tested bird received only one treatment. Moreover, neighbors were tested with different experimental songs. To minimize the effect of possible eaves-dropping (Dabelsteen et al. 1997), neighbors were subjected to playback on different days. As for the propagation experiments, signals were played-back at the natural intensity level of 90 dBSPL.
RESULTS
Song Analysis
ANN:with 20% of the signals learned (17 signals), the ANN is able to correctly classify 92% of the songs, i.e. to attribute a given signal to the right individual.
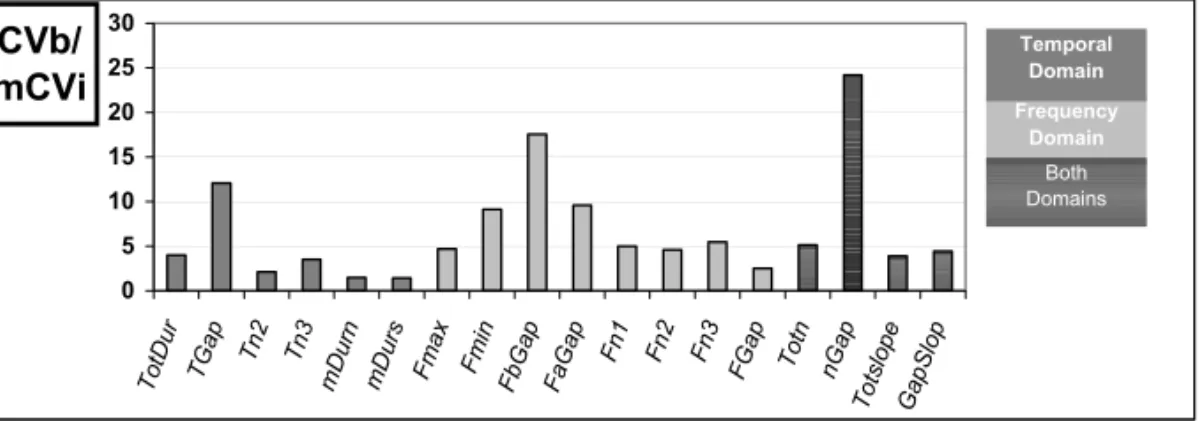
CV:the CVs have been calculated for each of the 18 selected parameters (Fig. 2). All frequency and temporal parameters appear to be specific to the in-dividual (CVb/meanCVi>1, ranging from 1.42 to 24.18). The higher values are obtained for parame-ters depicting the main frequency gap: Tgap, FaGap, nGap.
CVb/ mCVi 0 5 10 15 20 25 30 To tDu r TGa p Tn 2 Tn 3 mD urn mD urs Fm ax Fm in Fb Ga p Fa Ga p Fn 1 Fn 2 Fn 3 FGa p To tn nGa p To tslo pe Ga pS lop Frequency Domain Temporal Domain Both Domains
Fig. 2 – Results corresponding to the ratio between the inter-individual coefficient of variation (CVb) and the mean intra-individual coefficient of variation (mean CVi) calculated for 18 acoustic parameters of the song. Higher values correspond to parameters linked to the main gap: Tgap, FaGap, nGap.
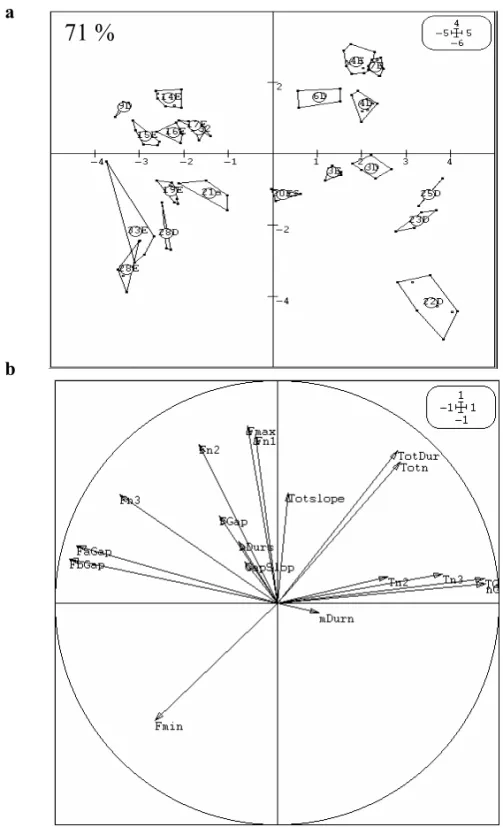
PCA still separated 71% of the 21 individuals an-alyzed. A further analysis by a correlation circle (Fig. 3b) allows identification of the acoustic pa-rameters which may support the individual signa-ture. The axis corresponding to factor 1 (responsible of 33% of the total variance) is strongly correlated or inversely correlated to the variables describing the main gap: TGap, nGap, FaGap, FbGap. Other correlation values are relatively high if factors 1 and 2 are considered together. They correspond to the parameters describing the secondary gaps situated at the beginning of the signal: Fmax, Fn2, Fn3.
2H: the number of individuals that could be
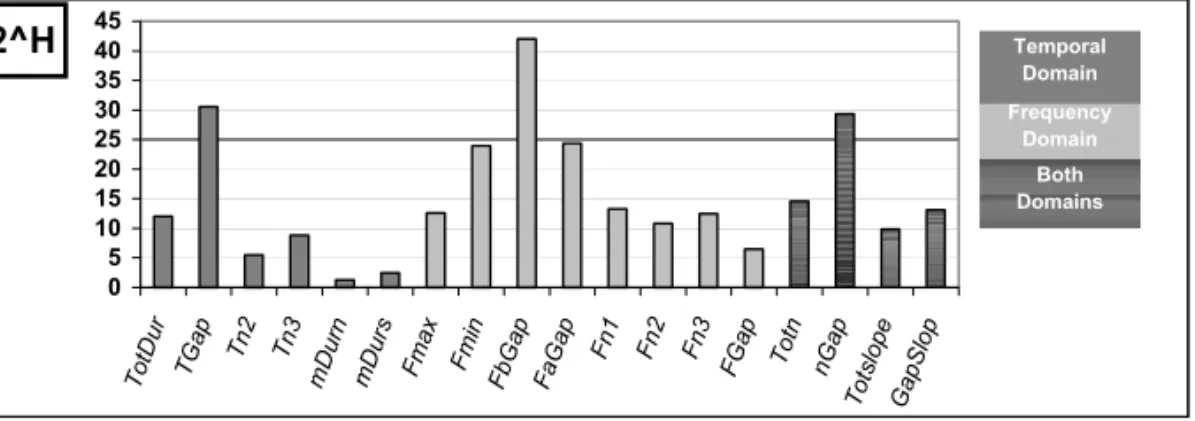
poten-tially discriminated was calculated for each of the studied parameters. The higher values obtained are 41 for FbGap and 29 for Tgap (Fig. 4). However, the 2H values of the various measured parameters cannot be summed, since they are not always fully independent from each other, and the calculation of the quantity of information would be overestimated.
Time and frequency decomposition:the ratio be-tween the mean energy profiles of the population (the 21 individuals studied) and the mean energy profiles of each individual was calculated for the en-velopes and for the spectra. Their values are respec-tively: Etb/Eti= 1.28, Efb/Efi = 3.70. That means that the envelope, and consequently the shape of the amplitude modulation of the song, seems to contain
less potential for individual coding, than the spec-trum.
Song Propagation
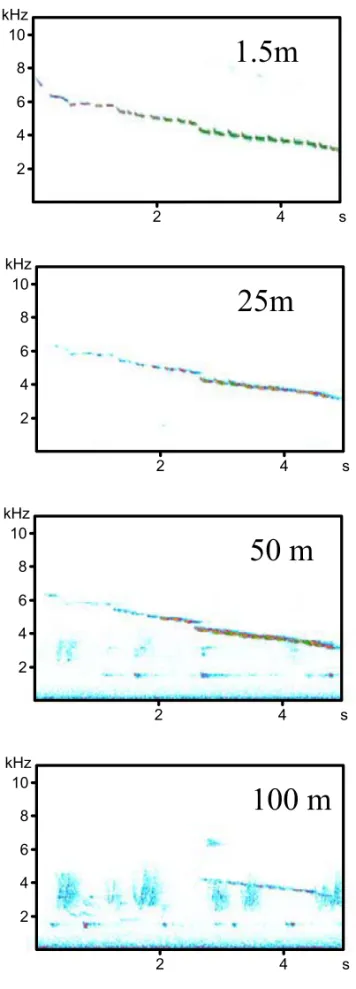
The examination of the averaged spectrograms cor-responding to the signals recorded at different dis-tances of propagation (Fig. 5) reveals that the first third of the signal, corresponding to the higher fre-quencies, is embedded in the background noise after only 50 m of propagation. This proportion grows to more than half the song after 100 m of propagation.
Playback Experiments
The responses of birds to a neighbor’s song, whose main gap was shifted in time or frequency, is given on Table I. For both modifications, it appears that the signal is perceived as the song of a stranger and not of a neighbor by the birds living in the immediate vicinity.
DISCUSSION AND CONCLUSION
a
b
71 %
Fig. 3 – PCA analysis taking into account 2 factors (54% of the total variance) and based upon 18 acoustic parameters. On this basis, the PCA (a) separates 71% of the 21 individuals analyzed (each number corresponds to 1 individual). A correlation circle (b) identifies the parameters responsible for these variances.
when birds of a given species share similar songs, as it is the case for the species studied here. This would mean that species having single song reper-toires are sensitive to relatively subtle differences
sep-2^H
0 5 10 15 20 25 30 35 40 45
To tDu
r
TG ap
Tn 2
Tn 3
mD urn
mD urs
Fm ax
Fm in
Fb Ga
p
Fa Ga
p Fn
1 Fn
2 Fn
3
FG ap
To tn
nGa p
To tslo
pe
Ga pS
lop
Frequency Domain Temporal
Domain
Both Domains
Fig. 4 – Number of individuals that can be potentially discriminated for each of the 18 parameters of the song. Calculation was realized on the basis of the 2Hmeasure (with H: quantity of information). Higher values are obtained with parameters linked to the main gap: Tgap, FbGap, nGap.
TABLE I
Responses of territorial malesBasileuterus leucoblepharusto a neighbor song or to a neighbor signal with the main frequency gap modified in the time domain (n=6) or in the frequency domain (n=4).
Frequency gap Signals Intensity of responses
Shifted in time Neighbor – – – – – – – – – –
Modified + + + + + +
Shifted in frequency Neighbor – – – – – – –
Modified – + + +
+ : song in reply and approach; – : song in reply but no approach; – – : no song, no approach.
arate with success the different individuals. Further analysis allows detection of the parameters respon-sible of these differences between individuals. A first analysis with the coefficients of variation (CV) reveals that the differences between individuals are mainly due to a gap in frequency between two suc-cessive notes occurring at the end of the first half of the signal. Another analysis by frequency and time decomposition of the energy of the song shows that, contrary to the frequency gaps, the shape of the amplitude modulation of the song contains a low po-tential for individual coding. An analysis by PCA confirms these findings and reveals also that smaller frequency gaps, situated at the beginning of the song, could be responsible for the inter-individual
differ-ences. Thus, it appears that the individual recog-nition process could be multi-parametric, i.e. not based upon only one key parameter. Nevertheless, if we take into account only the main gap in frequency, the quantity of information calculation (2H) reveals that it is possible to distinguish at least 40 individ-uals. This value seems low in regard to those esti-mated for other species with wide repertoires (Silva et al. 2000), but seems quite sufficient in regard to the spatial distribution of territories observed in the field and consequently in regard to the number of potential neighbors.
2 4 s 2
4 6 8 10 kHz
1.5m
2 4 s
2 4 6 8 10 kHz
25m
2 4 s
2 4 6 8 10 kHz
50 m
2 4 s
2 4 6 8 10 kHz
100 m
Fig. 5 – Averaged (n=3) spectrograms of a song played-back and recorded at 4 distances in the forest.
A study on two other songbird species (Elfström 1990) also found that the features used in individ-ual recognition are at the beginning of a song, while those used in species recognition are at the end. This organization of the information could be consid-ered as an adaptation, if territorial defense requires fast individual recognition of con-specific neighbors rather than fast species recognition. Such an orga-nization has another consequence: the privacy of the individual information. Effectively, in the case of the White-browed Warbler, we have shown by experiments, that after more than 100 m of propaga-tion, the first half of the signal, and consequently the potential vocal signature, disappears into the back-ground noise. A short range propagation of the in-dividual information seems fully adapted to the size and the distribution of the territories for this species. It also reduces aggressive responses to unfamiliar birds and consequently limits useless energy con-sumption in territorial defense.
Knowing that it is possible to distinguish the songs of individuals statistically does not tell us how birds do it. By playback experiments, we have demonstrated that there not only exists a neighbor-stranger song discrimination (males responding non-aggressively to neighbors and aggressively to unfamiliar song), but also a discrimination between songs of neighbors. By moving the main frequency gap back and forth in the temporal domain or up and down in the frequency domain, and by playing-back these synthetic songs, it is possible to impede the recognition of neighbors. Thus, the gaps in fre-quency distributed along the signal support the in-dividual identity in this species.
simple and stereotyped single song.
ACKNOWLEDGMENTS
Financial and logistic supports were provided by the BIOTA-FAPESP program and FMB/FUNAMP fund in Brazil and the CNRS in France. Special thanks to Danilo Boscolo and Alexandre Uezu for their help in the field.
RESUMO
O Pula-pula-assobiadorBasileuterus leucoblepharus, um pássaro comum da Mata Atlântica, emite um único e
dis-tintivo tipo de canto para defesa territorial. O
reconhe-cimento individual ou entre vizinho e estranho pode ser
mais difícil quando as aves compartilham cantos
seme-lhantes. De fato, a análise dos cantos de diferentes
indiví-duos revelou ligeiras diferenças nos domínios temporal e
das freqüências. Efetivamente, um exame cuidadoso dos
sinais de 21 indivíduos diferentes por 5 métodos
comple-mentares de análise revelou que, primeiro, um ou dois
espaços na série tonal ocorrem entre duas notas
suces-sivas em determinados momentos do canto e, segundo,
ocupam posições em tempo e freqüência estereotipadas
para cada indivíduo. Experiências de ‘‘play-back’’
con-firmam esses dados. Através de experiências de
propa-gação, mostramos que esta informação individual pode ser
transmitida somente a curta distância(<100 m)na mata. Considerando o tamanho e a repartição dos territórios, este
processo de comunicação mostra-se eficiente e bem
adaptado.
Palavras-chave: comunicação acústica em aves,
infor-mação individual, floresta tropical.
REFERENCES
Aubin T, Mathevon N, Vielliard JME and Silva ML. 2004. How an inadequate acoustic signal succeeds in the extreme environment of a tropical forest? The song of the White-browed Warbler. Acta Zoologica Sinica (in press).
Beecher MD.1982. Signature systems and kin recog-nition. Amer Zool 22: 477-490.
Beecher MD.1989. Signalling systems for individual recognition: an information theory approach. Anim Behav 18: 465-482.
Brenowitz EA.1982. Long-range communication of species identity by song in the Red-winged Black-bird. Behav Ecol Sociobiol 10: 29-38.
Chappuis C.1971. Un exemple de l’influence du milieu sur les émissions vocales des oiseaux: l’évolution des chants en forêt équatoriale. Terre et Vie 118: 183-202.
Dabelsteen T, Larsen O and Pedersen SB. 1993. Habitat-induced degradation of sound signals: quan-tifying the effects of communication sounds and bird location on blur ratio, excess attenuation, and signal-to-noise ratio in Blackbird song. JASA 93: 2206-2220.
Dabelsteen T, McGregor PK, Holland J, Tobias JA and Pedersen SB. 1997. The signal function of overlapping singing in male Robins. Anim Behav 53: 249-256.
Durr B and Sarton B.2001. ZiscLab. Alès: Synetic Press, 50p.
Elfström ST. 1990. Individual and species-specific song patterns of Rock and Meadow Pipits: physi-cal characteristics and experiments. Bioacoustics 2: 227-301.
Falls JB. 1982. Individual recognition by sounds in birds. In: Kroodsma DE and Miller EH.(Eds), Acoustic communication in birds (Vol. 1). NewYork: Academic Press, p. 237-278.
Gish SL and Morton ES.1981. Structural adaptation to local habitat acoustics in Carolina Wren songs. Z Tierpsychol 56: 74-84.
Heuwinkel H.1990. The effect of vegetation on the transmission of songs of selected European Passeri-formes. Acta Biol Benrodis 2: 133-150.
Lambrechts MM and Dhondt AA.1995. Individual voice discrimination in birds. In:Power DM.(Ed), Current Ornithology (Vol. 12). New York: Plenum Press, p. 115-139.
Lengagne T, Lauga J and Jouventin P. 1997. A method of independent time and frequency de-composition of bioacoustic signals: inter-individual recognition in four species of penguins. CR Acad Sci 320: 885-891.
Mathevon N and Aubin T.1997. Propagation of bird acoustic signals: comparative study of Starling and Blackbird distress calls. CR Acad Sci 320: 869-876.
Mathevon N and Aubin T.2001. Sound-based species-specific recognition in the BlackcapSylvia atricapilla
shows high tolerance to signal modifications. Be-haviour 138: 511-524.
Mbu Nyamsi RG, Aubin T and Brémond JC.1994. On the extraction of some time dependent param-eters of an acoustic signal by means of the analytic signal concept. Its application to animal sound study. Bioacoustics 5: 187-203.
Michelsen A and Larsen ON.1983. Strategies for acoustic communication in complex environments. In:Hubert F and Markl H.(Eds), Neuroethology and behavioral physiology. Berlin: Springer-Verlag, p. 321-331.
Reby D, Lek S, Dimopoulos I, Joachim J, Lauga J and Aulagnier S.1997. Artificial neural networks as a classification method in the behavioural science. Behav Process 40: 35-43.
Scherrer B.1984. Biostatistique. Québec: Gaëtan-Morin Press, 850p.
Shannon CE and Weaver W.1949. The mathemati-cal theory of communication. Urbana: University of Illinois Press, 249p.
Silva ML, Piqueira JRC and Vielliard JME.2000. Using Shannon entropy on measuring the individ-ual variability in the Rufous-bellied ThrushTurdus
rufiventrisvocal communication. J theor Biol 207:
57-64.
Stoddard PK.1996. Vocal recognition of neighbors by territorial passerines. In: Kroodsma DE and Miller EH.(Eds), Ecology and Evolution of Acous-tic Communication in Birds. Ithaca: Cornell Univer-sity Press, 356-374.
Waides RB and Narins PM.1988. Tropical forest bird counts and the effect of sound attenuation. Auk 105: 296-302.