A longitudinal study
of neurological soft
signs from late
childhood into early
adulthood
Isabel Martins MD; PhD, Language Research Laboratory, Neurology;
Martin Lauterbach* MD; PhD, Language Research Laboratory, Neurology, University of Lisbon;
Peter Slade PhD, Formerly the University of Liverpool, now at Edad, UK;
Henriques Luís MS, Faculty of Dental Medicine, University of Lisbon;
Timothy DeRouen PhD, Department of Dental Public Health Sciences and Biostatistics;
Michael Martin DMD; PhD, Department of Oral Medicine and Department of Epidemiology, University of
Washington;
Alexandre Caldas MD PhD;
Jorge Leitão, Instituto de Ci~encias de San´de, Universidade Católica Portuguesa, Lisbon;
Gail Rosenbaum MS, Regional Epilepsy Center; Brenda Townes PhD, Department of Psychiatry and Behavioral Sciences, University of Washington, WA, USA.
*Correspondence to second author at Laboratório de Estudos de Linguagem, Centro de Estudos Egas Moniz, Faculdade de Medicine de Lisbon, 1649-028 Lisbon, Portugal.
E-mail: [email protected]
DOI: 10.1111/j.1469-8749.2008.03043.x
Neurological examination of children includes the screening for soft neurological signs (NSS). There is little knowledge about their evolution during adolescence, except that their lasting presence has been associated with developmental, psychological, and cognitive disorders.We report the results of a NSS exam (assessing gross and fine motor function and the presence of hyperactivity and motor impersistence) over a 5-year period, among a group of healthy children who were followed annually as part of a dental study. Their ages ranged from 11 to 15 years at onset to 14 to 18 years at the end. Participants were divided into four groups by age (younger and older) and sex.At the first evaluation there were 191 males and 150 females. NSS score diminished both with increasing age and follow-up time in both groups, but at different rates in males and females. Females reached the lowest scores two years before the younger subgroup of males.These results show that NSS change rapidly in adolescence and at different rates in males and females, which must be taken into account in clinical contexts. The evolution of NSS suggests that they are a signature of neural development.
Poor coordination, speed or accuracy of limb or axial move-ments, including those required to keep the balance, are often found during the clinical examination of young children and are generically described as ‘soft’ neurological signs (NSS). Implicit to that designation is their benign nature, as opposed to the classical ‘hard’ localizing signs. While the latter point to specific loci of structural lesions or dysfunction and are, by definition, pathological in nature (for instance, motor weakness, spas-ticity or meningeal signs), soft signs are often symmetrical and are interpreted as an evidence of immaturity of the nervous system.
NSS are traditionally screened in the clinical exami-nation of young children and there are different opera-tional scales to classify and quantify them,1–3 sometimes subdividing them into motor and sensory signs, which have different reliabilities.4Yet, in spite of their widespread use, the neural basis and the clinical significance of NSS are still a matter of debate. NSS have been associated with a variety of neurodevelopmental and biological disorders in children, such as a low IQ, low birth weight, autism, and learning disabilities*5–7 and are also found in young adults with psychosis at an age when they are expected to be absent.8–10 These associations between NSS and pathology raise the question of their value as screening signs, or risk factors, for psychological and cognitive abnormalities.
Although there are detailed studies about test–retest and interobserver reliability of the different NSS3,4,11 and studies on their particular association with developmental disorders6,7or cognitive abilities,12with a few exceptions,11 there is little knowledge about their evolution beyond late childhood. This is an essential piece of information to define the boundaries of normality, i.e., the age beyond which they are expected to disappear and to understand their natural evolution, assuming that their presence during a certain phase can be interpreted as a sign of normal development.
In this study we report the results obtained by a sample of healthy children, taking part in a dental study, who were observed yearly between ages 11 to 18 years, well beyond the ages when these signs are usually sought. Our aim was to describe the normal progression of these signs during adolescence, and to study the influence of age, sex, and IQ on their occurrence, in this particular age group.
Methods
PARTICIPANTS
As part of a clinical trial on the safety of dental treatments with amalgams containing mercury, 507 children were ran-domly assigned to receive dental treatment with amalgam or composite and were annually compared on a number of clin-ical, neurobehavioral, and biochemical measures for a follow-up period of 7 years. The study design has been previ-ously described in detail.13–15Participants were students of the Casa Pia school system in Lisbon, Portugal, aged 8 to 12 years (at the beginning of the study in January 1997), who had at least one carious lesion in a permanent tooth, no pre-vious exposure to amalgam treatments, an IQ (as obtained
by the Comprehensive Test of Nonverbal Intelligence)16‡67, and no interfering health conditions. Since there was no sig-nificant difference between the two treatment groups on the presence of localizing ‘hard’ neurological signs at baseline, or on the hard or NSS score at each year of follow up17nor in any other neurobehavioral measure13this cohort is analyzed as a single body of data.
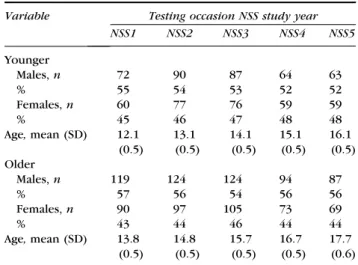
For the purpose of the present study, participants were divided into two age groups: younger (range 11–12y 11mo) and older children (range 13–14y 11mo) at the first time NSS were introduced in the assessment battery. Demographic characteristics of the four groups are shown in Table I. As there were some drop-outs since the dental study began, the number of children included in the present report has fewer participants than those of the initial cohort included in the dental study.
PROCEDURES
With Institutional Review Board and parental or guardian approval, neurological examinations (performed either by IPM or ML) were obtained prior to the onset of dental treat-ment and yearly for 7 subsequent years.
The assessment of NSS was introduced in follow-up year 3 of the study and continued for 4 subsequent years. Thus, since the baseline assessment of this cohort and the follow-up years of the dental study began 3 years before the screening of NSS, and in order to avoid confusion between the follow-up years of both, in the present study we shall designate by NSS-1 the first time these signs were assessed and by NSS-2, NSS-3, NSS-4, and NSS-5 their subsequent evaluations.
The NSS evaluation was adapted from the examination described by Peters et al.1Six items of that examination have shown, on a previous study18a high correlation with cogni-tive performance and school achievement and were conse-quently selected for the present study. All selected items were motor signs which are known to have a better interrater and test–retest reliability than sensory tasks, in different stud-ies.4These were the presence of mirror movements, synkine-sias, clumsiness on fine finger movements, clumsiness on heel-to-toe walking, motor impersistence, and motor
restlessness. Each item was scored from 0 (absent) to 3 (max-imum deviation) points, depending on the degree of devia-tion observed. Scores were the presence or absence of any NSS, and an overall NSS Score calculated by summing the score of the six individual items. The latter ranged from 0 to 18 points, with higher scores corresponding to the presence of more, or more evident, soft signs than lower scores. A detailed description of NSS evaluation has been reported elsewhere.17
Neurological examinations and examination for NSS were performed at the children’s schools. Variability in the num-ber of children examined in different study years (Table I) was due to a number of factors. Sometimes it was not possi-ble for participants to leave their school duties, or they were not present at the time of examination; there were also some drop-outs from the study, which account for a decreased number of children over time. In NSS-1 the severity of the individual NSS was not recorded for 39 participants; this explains the smaller number of NSS Total Scores compared to the number of participants examined. However, there were no systematic drop-outs by sex or ethnicity within groups over the 5-year period.
In NSS 5 the Block Design and Matrix Reasoning subtests of the Wechsler Abbreviated Scale of Intelligence (WASI)19were also administered to all participants, as part of their cognitive evaluation, and a prorated performance IQ was calculated.
STATISTICAL ANALYSIS
All statistical analyses were carried out using SPSS Version 15. Categorical data are presented as frequencies and per-centages. Where the data are interval in nature (NSS Total Score), means and standard deviations were calculated to obtain descriptive and normative information. The signifi-cance of group differences in NSS Total Score was evaluated by means of Repeated Measures analysis of variance (ANOVA). This was used in preference to other statistical tests as it has the greatest power to reject the null hypothesis when the null hypothesis is false.20 Descriptive data analysis on the NSS Total Score showed that it was positively skewed. Although ANOVA is reasonably robust in the face of devia-tions from normality, Tabachnick and Fidell21 suggest the use of appropriate data transformation as the safest strategy. We therefore performed a square root transformation on NSS Total Score prior to carrying out the Repeated Measures ANOVA. Post hoc comparisons were subsequently made using Tukey’s HSD test, which is one of the longest-estab-lished and conservative in nature.22Finally, Pearson product moment correlation coefficients were calculated to assess the relationship between NSS Total Score and Comprehensive Test of Nonverbal Intelligence (CTONI) and Wechsler Abbre-viated Scale of Intelligence (WASI IQ) scores, using pair-wise deletion to offset the problem of missing data.
Results
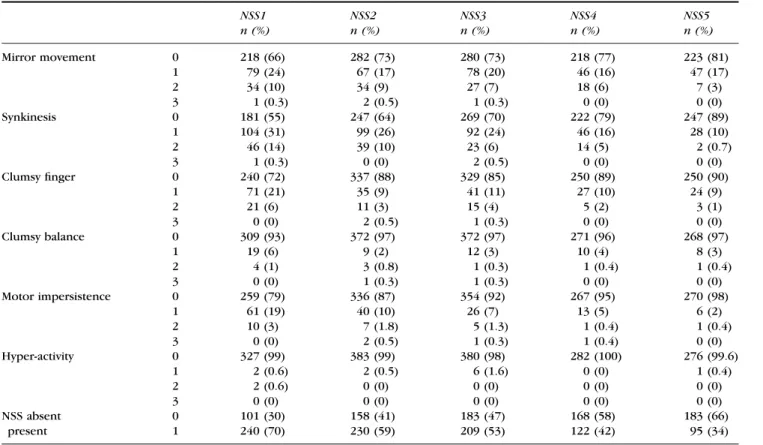
The results of the soft signs’ examination during follow-up are presented in Table II. The number of children with higher values (meaning more evident signs) on each of the six NSS tested decreases over time.
From NSS 1 to NSS 5, children’s mean ages were 13, 14, 15, 16, and 17 years respectively. During this period the pres-ence of any NSS decreased with increasing age for the sample as a whole – 70, 59, 53, 43, and 34% (Table II).
Table I: Demographic data on sex and age of sample in follow-up years 3 (NSS1) through 7 (NSS5)
Variable Testing occasion NSS study year NSS1 NSS2 NSS3 NSS4 NSS5 Younger Males, n 72 90 87 64 63 % 55 54 53 52 52 Females, n 60 77 76 59 59 % 45 46 47 48 48 Age, mean (SD) 12.1 (0.5) 13.1 (0.5) 14.1 (0.5) 15.1 (0.5) 16.1 (0.5) Older Males, n 119 124 124 94 87 % 57 56 54 56 56 Females, n 90 97 105 73 69 % 43 44 46 44 44 Age, mean (SD) 13.8 (0.5) 14.8 (0.5) 15.7 (0.5) 16.7 (0.5) 17.7 (0.6) NSS, soft neurological signs.
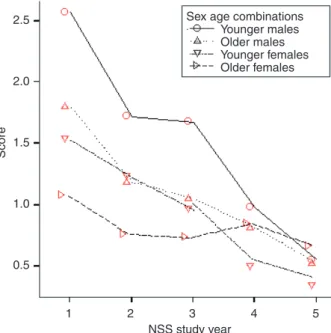
Participant’s NSS Total Scores by sex (males and females), age group (younger and older) and examination year are depicted in Figure 1.
Differences between groups were evaluated by means of a Repeated Measures ANOVA on the transformed (square root) NSS Total Scores. In terms of tests for nor-mality, the highly sensitive Box’s M test for homogeneity of the variance-covariance matrices21 was non-significant (degrees of freedom [df]= 45, 28680; F=1.03, p>0.41); as was Mauchly’s test of sphericity23 (df=9; Mauchly’s W=0.917, p>0.24).
There was a highly significant within-subjects effect for study year (df=4,540; F=29.86; p<0.001); a significant between-subjects effect for sex-age subgroups (df=3,135; F=6.56; p<0.001); and a significant interaction between study year and sex-age subgroups (df=12,540; F=2.97; p<0.001). Post hoc Tukey tests showed that younger males had significantly higher NSS Total Scores than the other three groups in NSS 1 to 3. Normative data for sex-age subgroups on the NSS Total Score are shown in Table III.
Finally, Pearson product moment correlations were calcu-lated between IQ measures taken at baseline (CTONI IQ) and in NSS 5 (WASI performance IQ) and NSS Total Score in NSS1-5. These are presented in Table IV. No significant rela-tionships were found between the NSS Total Score and CTONI IQ during any of the follow-up years. Low, but signifi-cant negative relationships were found between WASI IQ scores and NSS Total Score in NSS1 (r=).17), NSS 2 (r=0.18) and NSS 3(r=0.14); this accounted, at the utmost, for 3% of the variance (Table IV).
Discussion
This study provided a unique opportunity to investigate a large group of healthy children, through clinical neurological examination, over a long period of time associated with rapid physical, cognitive, and emotional development, i.e. that of puberty and adolescence. The results obtained showed that: during this period of development there are marked changes of gross and fine motor functions, that can be detected on a simple and rapid physical examination; that by age 15 to 18 years, most children will reach motor maturity as evidenced by the absence of soft neurological signs; that the rate of development is different between males and females; and that not all NSS change at the same rate.
We shall discuss these findings and their clinical and theo-retical implications.
The age at which NSS are expected to be absent, or con-sidered pathological, has not been established, since most published large cohorts of typically developing children include participants below their 11th birthday6,18and there are few longitudinal studies beyond that age.11,12
In the present study the incidence of NSS was highest before puberty and declined between 11 and 17 years. From their first to their last evaluation, children’s mean ages were 13 and 17 years respectively and the incidence of soft signs decreased from 70% the first time they were tested to 34% at the last assessment. In addition, there was a decline in the NSS total score, which means that whenever present, those signs become more subtle with age. Persistent and conspicu-ous NSS after the age of 18 are therefore unusual and proba-bly represents atypical forms of motor development. The
Table II: Results of NSS examinations during study years 1 to 5
NSS1 n (%) NSS2 n (%) NSS3 n (%) NSS4 n (%) NSS5 n (%) Mirror movement 0 218 (66) 282 (73) 280 (73) 218 (77) 223 (81) 1 79 (24) 67 (17) 78 (20) 46 (16) 47 (17) 2 34 (10) 34 (9) 27 (7) 18 (6) 7 (3) 3 1 (0.3) 2 (0.5) 1 (0.3) 0 (0) 0 (0) Synkinesis 0 181 (55) 247 (64) 269 (70) 222 (79) 247 (89) 1 104 (31) 99 (26) 92 (24) 46 (16) 28 (10) 2 46 (14) 39 (10) 23 (6) 14 (5) 2 (0.7) 3 1 (0.3) 0 (0) 2 (0.5) 0 (0) 0 (0) Clumsy finger 0 240 (72) 337 (88) 329 (85) 250 (89) 250 (90) 1 71 (21) 35 (9) 41 (11) 27 (10) 24 (9) 2 21 (6) 11 (3) 15 (4) 5 (2) 3 (1) 3 0 (0) 2 (0.5) 1 (0.3) 0 (0) 0 (0) Clumsy balance 0 309 (93) 372 (97) 372 (97) 271 (96) 268 (97) 1 19 (6) 9 (2) 12 (3) 10 (4) 8 (3) 2 4 (1) 3 (0.8) 1 (0.3) 1 (0.4) 1 (0.4) 3 0 (0) 1 (0.3) 1 (0.3) 0 (0) 0 (0) Motor impersistence 0 259 (79) 336 (87) 354 (92) 267 (95) 270 (98) 1 61 (19) 40 (10) 26 (7) 13 (5) 6 (2) 2 10 (3) 7 (1.8) 5 (1.3) 1 (0.4) 1 (0.4) 3 0 (0) 2 (0.5) 1 (0.3) 1 (0.4) 0 (0) Hyper-activity 0 327 (99) 383 (99) 380 (98) 282 (100) 276 (99.6) 1 2 (0.6) 2 (0.5) 6 (1.6) 0 (0) 1 (0.4) 2 2 (0.6) 0 (0) 0 (0) 0 (0) 0 (0) 3 0 (0) 0 (0) 0 (0) 0 (0) 0 (0) NSS absent 0 101 (30) 158 (41) 183 (47) 168 (58) 183 (66) present 1 240 (70) 230 (59) 209 (53) 122 (42) 95 (34) NSS, soft neurological signs.
steady decline of these signs during repeated neurological examinations suggests that they represent an evidence of the progressive maturity of the nervous system and allow us to interpret them as late motor milestones, i.e. another signa-ture of neural development.
NSS in young adults have been associated with a number of neuropsychiatric and behavioural disorders, such as psy-chosis, obsessive-compulsive disorder23 and also in condi-tions of atypical development, like autism and learning disability.5,7–9There is evidence that this may occur through two possible ways: either those signs persist beyond the expected age, and may constitute evidence of a more vulner-able nervous system (an eventual predictor of psychiatric or neurological impairment) or, instead, that NSS can appear de novo and may represent some loss of inhibition akin to that observed in the archaic reflexes of dementia. Indeed there are studies associating the persistence of NSS with a low IQ in young children, an evidence of atypical develop-ment,7 and one longitudinal study demonstrated that in some cases they can appear de novo along a 10-year observa-tion period.11
This late disappearance of NSS, compared to the rapid development of more elementary motor functions (strength, tone, tendon reflexes) may indicate the partici-pation of the latest developing nervous structures such as the prefrontal cortex in their evolution. A correlation anal-ysis with performance on tests of executive functions or with functional brain imaging, thus, needs to be explored. Only a few studies correlated NSS scores with a broader neuropsychological or neuroanatomical assessment.12,23 In the study of Fellick et al.,12 higher NSS score correlated with worse outcome on Movement ABC, WISC-III, and Connors’ Rating Scale. However, the authors stressed that NSS score does not allow predicting the outcome on the other scales. Sanders et al.,23underline the fact that even slight changes in the neurological exam are reliable, but
that the correlation to psychiatric entities has yet to be established. Voxel-based morphometry of structural MR-imaging is a way to look if high NSS scores are related to anatomical changes. Dazzan et al.24found that smaller grey matter volume of cortical and subcortical structures of the sensorimotor system might be correlated to persistent NSS in young adults.
All NSS tested declined with age, but some of them, like the observation of hyperactivity, were not prevalent when NSS were first tested in this cohort. This may indicate that they tend to disappear before the age their observation began. Of the individual soft signs, synkinesias (movement overflow; 40%) and mirror movements (30%) have the high-est incidence at the younger ages (NSS1), while hyperactivity (1%) has the lowest. Clumsiness on finger movements (24%), motor impersistence (19%), and clumsy balance (6%) have intermediate values. This suggests that the ability to inhibit unnecessary movements (to restrict motor activation to
Table III: NSS total scores for sex-age subgroups
NSS Study Year NSS1 n (%) NSS2 n (%) NSS3 n (%) NSS4 n (%) NSS5 n (%) Younger males Score: 0 7 (10) 24 (27) 23 (26) 32 (50) 40 (64) 1 16 (22) 20 (22) 26 (30) 17 (27) 14 (22) 2 19 (26) 19 (21) 15 (17) 7 (11) 6 (10) 3+ 30 (42) 27 (30) 23 (26) 8 (13) 3 (5) Older males Score: 0 27 (23) 53 (43) 55 (44) 56 (60) 55 (63) 1 32 (27) 37 (30) 39 (32) 17 (18) 24 (28) 2 29 (24) 16 (13) 16 (13) 12 (13) 4 (5) 3+ 31 (26) 18 (15) 14 (11) 9 (10) 4 (5) Younger females Score: 0 19 (32) 29 (38) 41 (54) 37 (63) 44 (75) 1 16 (27) 19 (25) 17 (22) 16 (27) 12 (20) 2 11 (18) 18 (23) 12 (16) 5 (9) 1 (2) 3+ 14 (23) 11 (14) 6 (8) 1 (2) 2 (3) Older females Score: 0 48 (53) 52 (54) 64 (61) 43 (59) 44 (64) 1 15 (17) 27 (28) 26 (25) 16 (22) 15 (22) 2 14 (16) 14 (14) 9 (9) 8 (11) 8 (12) 3+ 13 (14) 4 (4) 6 (6) 6 (8) 2 (3) NSS, soft neurological signs.
Table IV: Correlations between NSS total scores and measures of intelligence for follow-up years 3 to 7
Soft sign scores
NSS1 NSS2 NSS3 NSS4 NSS5 IQ measure: CTONI NIQ (baseline) 0.02 )0.00 )0.00 )0.04 )0.05 N 341 388 392 290 278 WASI IQ (year 5) )0.17a )0.18a )0.14b )0.10 )0.12 N 251 302 318 264 274 a
p<0.01.bp<0.05. NSS, soft neurological signs; CTONI NIQ, Comprehensive Test of Nonverbal Intelligence; WASI, Wechsler Abbreviated Scale of Intelligence.
Score 2.5 2.0 1.5 1.0 0.5 1 2 3 4 5 NSS study year
Sex age combinations Younger males Older males Younger females Older females
Figure 1: Mean soft neurological signs (NSS) total score by age and sex.
circumscribed cortical⁄ subcortical regions) develops slowly over time.
Although all children improved their NSS score with age, there was a significant difference between males and females. Younger males lagged behind other groups, eventually catch-ing up with them by the end of the study. Therefore, sex must be taken into account in clinical practice and whenever normative data is necessary. In some studies12 results are only controlled for age and sex is not mentioned. Sex differ-ences are recognized, in different domains, in the cognitive performance of normally developing children.25,26 In this very same cohort it was found, at baseline (ages 8–11y) that females had higher scores on rote verbal memory, speed of information processing, and psychomotor speed, and made fewer errors on a test of cognitive flexibility (TMT-B) while males were better at visual memory, visuospatial tasks, motor speed, and coordination.15The sex effects observed in NSS suggest a different maturation of fine motor abilities between males and females, more precisely a delayed maturation in males, since scores become identical by age 15 to 17 years. The functions underlying NSS are not clear but probably multifactorial and may depend upon the maturation of differ-ent structures at differdiffer-ent time points. While visuomotor skills are required for a good coordination and could give an advantage to the males, development of executive functions is also probably necessary, such as the capacity to inhibit motor overflow and accessory involuntary movements, which could give advantage to females. Since these changes do occur during puberty and puberty begins earlier in females28,29they may reflect the effect of hormonal changes and other neurobiological aspects associated with sexual differentiation.
An alternative explanation for the finding that males have more NSS than females, at any given age before age 17 years, could be related to obstetric complications. It is recognized that males have a higher incidence of those than females do and, indeed, there is evidence that children with low birth-weight and prematurity have more NSS.6 To explore that hypothesis we compared the variances of NSS between males and females. In the first year of the study the variance of NSS score was smaller for males than for females; in the sub-sequent 4 study years the NSS score showed a reversed pat-tern. This suggests that the males’ NSS score was not skewed, from the beginning by a subgroup with a lower score. This may indicate that the maturation of motor systems is more heterogeneous and runs over a longer period in males than in females. In addition, if NSS were a result of cerebral anoxia they would be less likely to behave as developmental signs, lagging behind but improving steadily with age at a later stage. Furthermore males, in this group (as mentioned above) had higher scores in other aspects of development15 than females, which is against a general cognitive⁄ neural impairment. The reasons for this phenomenon should be the topic of further investigations.
The relation between NSS and cognition is less clear. NSS score did not correlate with IQ measures obtained 3 years before their examination. However they were significantly correlated to the WASI performance IQ scores obtained by the end of the study. The correlation was in the expected direction; i.e., lower IQ scores were associated with higher NSS Total Scores. This finding corroborates previous findings in healthy children.15The loss of such association in the past
2 years of study may be explained by the fact that NSS reaches a low score in the majority of children by their late teens. Interestingly, in the study by Shafer et al.11 children who maintained NSS (as a delayed motor milestone) had a lower IQ than those who never exhibited NSS or those who lost them over time. On the contrary, participants who developed NSS de novo had IQ values identical to the latter, implying somehow that those were not developmental signs but new acquired signs unrelated to general development.
The neural basis of NSS is not fully understood. Their interpretation is controversial among clinicians. The present study indicates that NSS evolve in time like any other devel-opmental manifestation and may be considered as a motor milestone to be sought in older children and adolescents. A more detailed analysis of their pathogenesis, namely the rea-son for their disappearance, persistence, or reappearance, may clarify their association with some disorders of childhood and early adulthood.
Accepted for publication 16th January 2008. References
1. Peters JE, Romine JS, Dykman RA. A special neurological examination of children with learning disabilities. Dev Med Child Neurol 1975; 17: 63–78.
2. Denckla MB. Minimal brain dysfunction and dyslexia: beyond diagnosis by exclusion. In: Blaw ME, Rapin I, Kinsbourne M, eds. Topics in Child Neurology. New York: Spectrum, 1977; 243–61.
3. Stokman JC, Shafer SQ, Shaffer D, Ng SK, O’Connor PA, Wolff RR. Assessment of neurological soft signs in adoles-cents: reliability studies. Dev Med Child Neurol 1986; 28: 428–39.
4. Pine DS, Scott MR, Busner C, Davis M, Fried JA, Parides M, Shaffer D. Psychometrics of neurological soft signs. J Am Acad Child Adolesc Psychiatry 1996; 35: 509–15.
5. Foodman A, McPhillips K. ADD and soft signs. J Am Acad Child Adolesc Psychiatry 1996; 35: 841–42.
6. Breslau N, Chilcoat HD, Johnson EO, Andreski P, Lucia VC. Neurologic soft signs and low birthweight: their association and neuropsychiatric implications. Biol Psychiatry 2000; 47: 71–79.
7. Mandelbaum DE, Stevens M, Rosenberg E, Wiznitzer M, Steinschneider M, Filipek P, Rapin I. Sensorimotor performance in school-age children with autism,
developmental language disorder, or low IQ. Dev Med Child Neurol 2006; 48: 33–39.
8. Pine DS, Wasserman GA, Fried JE, Parides M, Shaffer D. Neurological soft signs: one-year stability and relationship to psychiatric symptoms in boys. J Am Acad Child Adolesc Psychiatry 1997; 36: 1579–86.
9. Dickstein DP, Garvey M, Pradella AG, Greenstein DK, Sharp WS, Castellanos FX, et al. Neurologic examination abnormalities in children with bipolar disorder or
attention-deficit⁄ hyperactivity disorder. Biol Psychiatry 2005; 58: 517–24.
10. Tani P, Lindberg N, Appelberg B, Nieminen-von Wendt T, von Ewendt L, Porkka-Heiskanen T. Clinical neurological abnor-malities in young adults with Asperger syndrome. Psychiatry Clin Neurosci 2006; 60: 253–55.
11. Shafer SQ, Stokman JS, Shaffer D, Ng SK, O’Connor PA, Schonfeld IS. Ten-year consistency in neurological test perfor-mance of children without focal neurological deficit. Dev Med Child Neurol 1986; 28: 417–27.
12. Fellick JM, Thomson APJ, Sills J, Hart CA. Neurological soft signs in mainstream pupils. Arch Dis Child 2001; 85: 371–74. 13. DeRouen TA, Martin MD, Leroux BG, Townes BD, Woods JS,
Leitão J, et al. Neurobehavioral effects of dental amalgam in children: a randomized clinical trial. JAMA 2006; 295: 1784–92.
14. DeRouen TA, Leroux BG, Martin MD, Townes BD, Woods JS, Leitão J, et al. Issues in design and analysis of a ran-domized clinical trial to assess the safety of dental amalgam restorations in children. Controlled Clinical Trials 2002; 23: 301–20.
15. Martins IP, Castro-Caldas , Townes BD, Ferreira G, Rodrigues P, Marques S, et al. Age and sex differences in neurobehavioral performance: a study of Portuguese elementary school children. Int J Neuroscience 2005; 115: 1687–1709.
16. Hammill DD, Pearson NA, Wiederholt JL. C-TONI Compre-hensive Test of Nonverbal Intelligence Manual. Circle Pines, MN: American Guidance Serivce, Austin, TX: Pro-Ed 1997. 17. Lauterbach M, Martins IP, Castro-Caldas A, Bernardo M, Luís
H, Amaral H, et al. Neurological outcomes in children with⁄ without mercury exposure from amalgam: seven years of observation in a randomized trial,J Am Dent Assoc2008; 139: 138–145.
18. Martins IP, Fernandes T. Avaliação cognitiva e neurológica numa população recém- escolarizada. Psychologica 2003; 34: 187–214.
19. The Psychological Corporation. Wechsler Abbreviated Scale of Intelligence-Manual. San Antonio, TX: Harcourt Brace & Company, 1999.
20. Murphy KR, Myors B. Statistical power analysis. Lawrence Erlbaum Associates: New Jersey and London, 2004. 21. Tabachnick BG, Fidell LS. Using multivariate statistics. Third
Edition. Harper Collins: California State University, Northridge, 1996.
22. Howell DC. Statistical methods for psychology. Fifth Edition. Thomson Wadsworth: Belmont, California, 2002.
23. Sanders RD, Keshavan MS. The neurologic examination in adult psychiatry: from soft signs to hard science. J Neuro-psychiatry Clin Neurosci 1998; 10: 395–404.
24. Dazzan P, Morgan KD, Chitnis X, Suckling J, Morgan C, Fearon P, et al. The structural brain correlates of neurological soft signs in healthy individuals. Cereb Cortex 2006; 16: 1225– 31.
25. Halpern DF. Sex differences in cognitive abilities (2nd ed.). Hillsdale, NJ: Lawrence Erlbaum Associates, Inc., 2002. 26. Meurling AW, Tonning-Olsson I, Levander S. Sex differences
in strategy and performance on computerized neuropsycho-logical tests as related to sex identity and age at puberty. Scand J Psychol. 2000; 41: 81–90.
27. Strand S, Deary IJ, Smith P. Sex differences in cognitive abili-ties test scores: a UK national picture. Br J Educ Psychol 2006; 76: 463–80.
28. Castellino N, Bellone S, Rapa A, Vercellotti A, Binotti M, Petri A, Bona G. Puberty onset in Northern Italy: a random sample of 3597 Italian children. J Endocrinol Invest 2005; 28: 589–94. 29. Sisk CL, Foster DL. The neural basis of puberty and
adoles-cence. Nat Neurosci 2004; 7: 1040–47.
30. Mauchly JW. Significance test for sphericity of a normal in variate distribution. Annuals of Mathematical Statistics 1940; 11: 204–9.