www.ccarevista.ufc.br ISSN 1806-6690
Use of remote sensing to identify areas at risk of degradation in the
semi-arid region
1Utilização de sensoriamento remoto para identificação de áreas em risco de
degradação na região semiárida
Deodato do Nascimento Aquino2*, Odílio Coimbra da Rocha Neto3, Maurício Alves Moreira4, Adunias dos Santos
Teixeira5 and Eunice Maia de Andrade5
ABSTRACT - One of the most effective procedures in the evaluation of degraded areas has been the use of remote sensing.
The aim of this work was to evaluate the temporal dynamics of the NDVI and rainfall in detecting the degradation of natural resources in a semi-arid region of Brazil. The area under study is located to the west of the district of Tauá, in the State of Ceará, with a predominance of shrub-like caatinga forest. Rainfall data was obtained from FUNCEME. Ten images (dry season) were acquired from a 27-year historical series (1985-2011) from the TM/LANDSAT5 sensor, later converted to surface reflectance using the FLAASH/ENVI extension; NDVI indices were obtained and divided into six classes corresponding to land usage and occupation. The mean values of the NDVI classes were submitted to statistical analysis and compared by T-test (p<0.05) and the Pearson correlation matrix. It was found that in the years with rainfall above the historical average (1985-1993 and 1996-2004) there was a significant increase in degraded areas, represented by low values for the NDVI (between 0 and 0.4), due to more land being used for subsistence farming. However, during periods of drought (1993-1996 and 2004-2011), the opposite behaviour was seen, characterised by the natural regeneration of the woody stratum due to agricultural areas being abandoned; behaviour that was evidenced by increases of up to 1,807% in the moderately high class of the NDVI (between 0.6 and 0.8). The spatial and temporal dynamics of the NDVI and the rainfall therefore played a part in detecting evidence of the process of degradation of the caatinga biome in an area of the district of Tauá, in the State of Ceará.
Key words: NDVI. Caatinga. Landsat TM5. Desertification.
RESUMO - Um dos procedimentos mais eficazes na avaliação de áreas degradadas tem sido o uso do sensoriamento remoto. Este trabalho objetivou avaliar a dinâmica temporal do NDVI e da precipitação pluviométrica na detecção de degradação dos recursos naturais em uma região semiárida do Brasil. A área estudada localiza-se a oeste do município de Tauá, estado do Ceará, com predomínio de floresta caatinga arbustiva. As informações de precipitação foram obtidas junto à FUNCEME. Foram adquiridas 10 imagens (estação seca) de uma série histórica de 27 anos (1985-2011) do sensor TM/LANDSAT5, posteriormente convertidas em reflectância de superfície por meio da extensão FLAASH/ENVI e obtidas os índices NDVI, segmentados em 6 classes conforme o uso e ocupação do solo. Os valores médios das classes de NDVI foram submetidos à análise estatística e confrontados pelo Teste T (p<0,05) e matriz de correlação de Pearson. Observou-se que nos anos com precipitação pluviométrica acima da média histórica (1985-1993 e 1996-2004) houve significativo acréscimo de áreas degradas representadas por baixo NDVI (entre 0 e 0,4), decorrentes do avanço de terras incorporadas à agricultura de subsistência. No entanto, em períodos de estiagem (1993-1996 e 2004-2011), constatou-se comportamento inverso, caracterizado pela regeneração natural do estrato arbustivo-arbóreo em decorrência do abandono das áreas agrícolas, comportamento evidenciado por incrementos de até 1.807% da classe de NDVI moderadamente alta (entre 0,6 e 0,8). Portanto, a dinâmica espaço-temporal do NDVI e da precipitação pluviométrica contribuíram para detecção de evidências do processo de degradação do bioma caatinga numa área no município de Tauá, estado do Ceará.
Palavras-chave: NDVI. Caatinga. Landsat TM5. Desertificação. DOI: 10.5935/1806-6690.20180047
*Author for correspondence
Received for publication on 26/02/2015; approved on 29/08/2017
1Trabalho do Projeto Casadinho/Procad/UFC/INPE, oriundo da parceria firmada entre o Programa de Pós-Graduação em Engenharia Agrícola da UFC e o Programa de Pós-Graduação em Sensoriamento Remoto/PGSER do Instituto Nacional de Pesquisas Especiais/INPE
2Instituto Nacional de Colonização e Reforma Agrária/INCRA - Av. Américo Barreira, 4700, Fortaleza-CE, Brasil, Tel. (85) 3299 1587, [email protected] .
3Centro de Ciências Agrárias, Universidade Federal do Ceará/UFC, Fortaleza-CE, Brasil, [email protected]
4Instituto Nacional de Pesquisas Espaciais/INPE, Jardim da Granja, São José dos Campos-SP, Brasil, [email protected]
INTRODUCTION
Tropical and subtropical forests occupy about 40% of the Earth’s surface and provide a habitat for more than 1 billion human beings (REYNOLDS; SMITH, 2002); among these are dry forests, which include the Caatinga and cover 42% (MOREIRA et al., 2006). The
semi-arid region of northeastern Brazil, where the dry forests stand out, comprises an area of approximately 982,563 km² (BRAZIL, 2014; PEREIRA JÚNIOR, 2007). In this region, different vegetation typologies develop, with a predominance of caatinga, in an area of approximately 844,453 km2, equal to 70% of the north-eastern region
and 11% of the territory of the country (ARAÚJO; ALBUQUERQUE; CASTRO, 2007; BRASIL, 2014; RODAL; MARTINS; SAMPAIO, 2008).
The Caatinga Biome presents floristic diversity, a result of varied phyto-ecological conditions. The natural landscape has almost lost its primary ecological characteristics due to the inappropriate use of socio-economic activity. In the last few decades, the scenario has been greatly modified by intense anthropic action, mainly expressed by the emergence and/or intensification of such biophysical processes as soil erosion, increased water deficit, microclimatic change, a reduction in biodiversity and consequently, an increase in areas susceptible to desertification (TRIGUEIRO; OLIVEIRA; BEZERRA, 2009).
Land located in semi-arid regions is prone to the process of desertification; recently, the most accepted definition being that desertification refers to degradation of the ground in sub-humid, semi-arid and arid areas resulting from several factors, among the most important being changes in climate and anthropic activity (REYNOLDS; SMITH, 2002). Soil erosion, silting and the permanent absence of vegetation cover have therefore been used as the main indicators of a state of degradation (LE HOUEROU, 2006).
One of the most effective procedures in assessing desertification has been through remote sensing. Remote sensing data are important tools that, when used to study changes in the environment, offer elements that can provide information that make it possible to plan and detect changes occurring in certain scenarios (SANTOS; SANTOS, 2010). This technique is an aid to understanding the internal mechanisms, and spatial and temporal differences, in areas that are vulnerable to the process of desertification (SUN WU, 2000). Surveys in arid regions have focused on the use of optical satellite images and on geoprocessing techniques. The number of studies that evaluate degraded areas in the Brazilian Northeast using remote sensing techniques is significant; worthy of note are those carried out by Costa et al.
(2009), Sá et al. (2008), Sá et al. (2010), Lopes et al.
(2010), Silva et al. (2010) and Nascimento, Lima and
Lima (2014).
Two main approaches are generally followed: image classification and the use of image vegetation indices (DAWELBAIT; MORARI, 2008). Many vegetation indices presented in the literature are related to various vegetation parameters, among them the NDVI (Normalised Difference Vegetation Index) which is an indicator of the vegetation in a specific area of interest of the terrestrial surface. The Normalised Difference Vegetation Index varies from -1 to 1: the closer to 1, the greater the vegetation vigour, the denser the vegetation cover and the greater the photosynthetic activity (LIRA
et al., 2011).
In view of the above, the aim of this work was to evaluate the temporal dynamics of the NDVI and rainfall in detecting evidence of the process of degradation of natural resources in an area of the district of Tauá, in the State of Ceará, Brazil.
MATERIAL AND METHODS
Study area
The study area is located to the west of the district of Tauá, in the southwest of the State of Ceará, approximately 337 km from the capital Fortaleza, and centred on the coordinates: 6º00’11” S and 40º17’34” W (Figure 1).
According to IPECE (2013), the climate of the region is characterised as hot tropical semi-arid, with an annual rainfall of 597 mm, and a rainy season from February to May. The average temperature in the region varies between 26 and 28 ºC, and the predominant vegetation is thorny deciduous forest, open shrub-like caatinga.
Image acquisition
Orthorectified images were obtained from the TM sensor of the LANDSAT 5 satellite, with a spatial resolution of 30 m, except for the image in the TM6 band (120 m). The acquired products consisted of surface radiance images acquired with the Earth Explorer acquisition platform of the USGS (United States Geological Survey).
Figure 1 - Location of the district of Tauá
Image processing and rainfall data
For this research, the radiance values were first converted to surface reflectance using the FLAASH extension of the ENVI software. Following this procedure, the NDVI images were obtained as per Equation 1.
(1)
where: NIVP and NV are measurements of spectral
reflectance values in the near-infrared (Band TM4) and visible (Band TM3) regions of the electromagnetic spectrum respectively.
The NDVI varies from -1.0 to 1.0; however, targets on the Earth’s surface vary from 0.0 to 1.0. The closer to zero, the lower the presence of vegetation in a given area. The NDVI images were exported and geoprocessed with the Q.GIS 2.4 software. The images were segmented and classified into six classes of usage and occupation, as established by Aquino and Oliveira (2012). It was therefore possible to establish the areas for each spectral class for the respective years under study, relative to the protection offered by the vegetation cover (Table 1).
Rainfall data were obtained from the database of the Ceará Foundation for Meteorology and Water Resources (FUNCEME). Annual averages from 1983 to 2014 (August to July) were tabulated. The rainfall relative to each year of image acquisition was represented by the arithmetic moving average, as per equation 2, using the year in question and the two previous years.
(2)
where: MMAp - arithmetic moving average of the rainfall;
P is the rainfall in the reference year,P
n-1 represents the
first year prior to the reference year and P
n-2the second
year prior to the reference year;n is the number of years.
(In this specific case 3.)
The moving average was applied with the idea of smoothing the temporal effect of the rainfall on changes in the classes of land capacity and usage (Figure 2).
The values for the moving average of the rainfall and the percentage contribution of each class in the NDVI image were processed with the MATLAB software to obtain the correlation matrix. Due to the values for the
Table 1 - Description and NDVI class interval for vegetation cover
Class Classification criterion Bare soil and/or water NDVI ≤ 0 Very Low 0< NDVI ≤ 0.2
Low 0.2< NDVI ≤ 0.4
Moderately Low 0.4< NDVI ≤ 0.6 Moderately High 0.6< NDVI ≤ 0.8
NDVI class being non-parametric and the number of samples being low, Spearman’s correlation was applied (Equation 3).
(3)
where:ρis the correlation obtained between variables X and Y (NDVI class interval and rainfall),di is the difference
for the ranking of each value corresponding to X and Y, andn is the number of the pair of values.
The mean values for the area of each class of usage capacity and occupation, from August 1985 to August 2011, were tested using the SPSS 16.0 software for Windows, and compared by T-test (p<0.05); priority was given to this test as the number of samples was less than 30. In addition, box-plot graphs were used to aid and facilitate interpretation of the results of the spatial and temporal variability of the NDVI class intervals.
RESULTS AND DISCUSSION
According to the results obtained in Figure 3 and Table 2, it is evident that the predominant classes of usage and occupation during 1985, 1993 and 1996, express values that represent low vegetation indices in terms of phytomass volume, with a predominance of NDVI levels below 0.4; the lowest values being seen during 1993, as shown in Figure 3 and Table 2.
For the NDVI, values between 0 and 0.2 correspond to urban targets, deforested areas or rocky outcrops, which have an absorption area in the near-infrared range, while areas represented by an NDVI between -1 and 0 correspond to shadows and water sources.
The NDVI values estimated for the western region of the district of Tauá were classified into six classes according to the protection offered the soil by the vegetation cover; these are: shadows and/or water sources (NDVI less than or equal to 0), bare soil and/or urban targets, very low (NDVI between 0 and 0.2), low (NDVI between 0.2 and 0.4), moderately low (NDVI between 0.4 and 0.6), moderately high (NDVI between 0.6 and 0.8) and high (NDVI between 0.8 and 1.0). Table 2 and Figure 4 both show the spatial and temporal variability of these classes and the mean area occupied by the NDVI values from August 1985 to August 2011, a month that characterises the dry season in the study area.
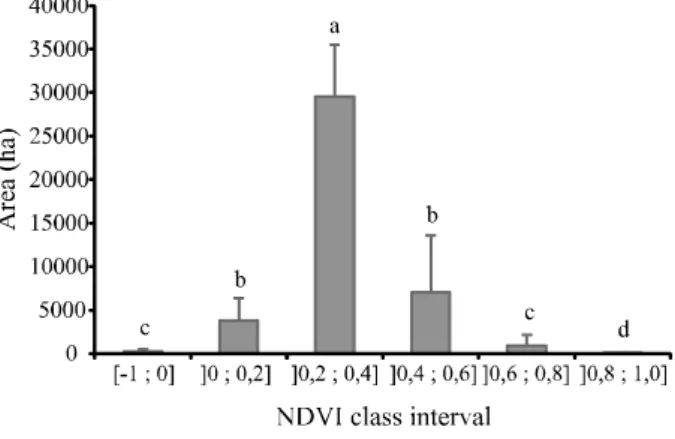
According to Table 2 and the histogram shown in Figure 4, it can be seen that in the western region of the district of Tauá there is a predominance of the NDVI class with low values (between 0.2 and 0.4) (p<0.05), occupying a mean area of approximately 29,494.84 ha (standard deviation ± 5.971 ha), corresponding to 71% of the monitored area; reduced protection is therefore offered the soil by the vegetation cover of this region, as seen by the predominance of classes with low NDVI values. This result agrees with those of Ferreiraet al. (2012) who, when
studying the dynamics of caatinga vegetation in the town of Petrolina, in the State of Pernambuco during August 2009, noticed the predominance of caatinga with NDVI values below 0.301, they found that the NDVI varied from 0.201 to 0.300, and corresponded to 49.32% of the total municipal area, a condition explained by the low rainfall during that and the previous month.
Further in Figure 4, the lower presence of the moderately high (0.6 to 0.8) and high (0.8 to 1.0) classes of NDVI are evident, contributing only 2.2 and 0.01% of the total area under study respectively. Similar behaviour was seen by Nascimento, Lima and Lima (2014), when they used the NDVI to monitor degradation of the Caatinga along the Alto Paraíba River, a vegetation cover similar to that of the western region of Tauá. They concluded that this region of the Paraíba Cariri has undergone several processes of environmental degradation since the beginning of colonisation.
Another factor that probably contributed to the reduced presence of the moderately high (between 0.6 and 0.8) and high (between 0.8 and 1.0) classes of NDVI in the studied images (Figure 4) is related to the collection time of the data. This argument can be justified, because the images of all the years being monitored are representative of the dry period, from August to October, and as deciduous species predominate in the caatinga biome, leaf fall is intensified with the increase in water deficit during this period, thereby creating spatial vegetation mosaics with reduced green foliage during the dry season (JUSTINIANO; FREDERICKSEN, 2000). Accordingly,
Figure 3 - NDVI class maps for 1985 (a), 1993 (b) and 1996 (c)
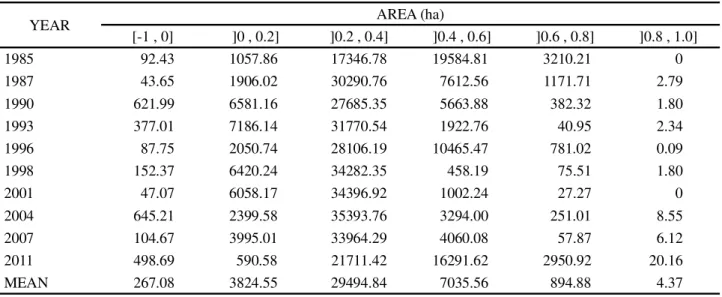
Table 2 - Temporal variability for the mean occupied area by NDVI class value from August 1985 to August 2011 in the western region of Tauá, Ceará
YEAR AREA (ha)
[-1 , 0] ]0 , 0.2] ]0.2 , 0.4] ]0.4 , 0.6] ]0.6 , 0.8] ]0.8 , 1.0]
1985 92.43 1057.86 17346.78 19584.81 3210.21 0
1987 43.65 1906.02 30290.76 7612.56 1171.71 2.79
1990 621.99 6581.16 27685.35 5663.88 382.32 1.80
1993 377.01 7186.14 31770.54 1922.76 40.95 2.34
1996 87.75 2050.74 28106.19 10465.47 781.02 0.09
1998 152.37 6420.24 34282.35 458.19 75.51 1.80
2001 47.07 6058.17 34396.92 1002.24 27.27 0
2004 645.21 2399.58 35393.76 3294.00 251.01 8.55
2007 104.67 3995.01 33964.29 4060.08 57.87 6.12
2011 498.69 590.58 21711.42 16291.62 2950.92 20.16
MEAN 267.08 3824.55 29494.84 7035.56 894.88 4.37
Ponzoni and Shimabukuro (2010) affirm that the NDVI shows a high correlation with the amount of chlorophyll present in the vegetation. In periods of high photosynthetic
The spatial and temporal variability by NDVI class interval for the western region of the district of Tauá is shown in Figure 5. It can be seen that the median values relative to the very low (NDVI between 0 and 0.2), low (NDVI between 0.2 and 0.4) and moderately low classes (NDVI between 0.4 and 0.6), were always greater than those found in areas of closed woody vegetation (NDVI between 0. 6 to 1.0).
The areas that comprise the NDVI intervals between low (NDVI between 0.2 and 0.4) and moderately low (NDVI between 0.4 and 0.6) displayed a larger interquartile range, demonstrating greater temporal dynamics when compared to the areas of bared soil and woody vegetation (Figure 5).
This behaviour defines the greater influence of climatic seasonality on the dynamics of natural regeneration under a management of deforestation and consolidation for subsistence agriculture. Accordingly, it can be seen in Figure 5 that during 1985 and 2011 some areas presented atypical behaviour for the class intervals of low NDVI (between 0.2 and 0.4), moderately high NDVI (between 0.6 and 0.8) and high NDVI (between 0.8 and 1.0). This behaviour is possibly related to the high rainfall in 1985 and low rainfall in 2010, of 550 mm and 133 mm respectively (Figure 2).
The increase in rainfall during 1985 contributed to the natural regeneration in that year, evidenced by the larger size of the areas in the classes ]0.4, 0.6] and ]0.6, 0.8], of 19,584.81 ha and 3,210.21 ha respectively (Table 2). Therefore, the rainfall deficit seen in 2010 contributed to the abandonment of arable land, and a reduction in burning and soil preparation for cultivation. This behaviour provided sufficient time for the natural regeneration of fallow areas during 2011, and resulted in a reduction in areas with an NDVI interval between (0 and 0.4) and an associated increase in areas with an NDVI class between (0.6 and 1.0) from 2007 to 2011, as shown in Table 2 and Figure 5.
An analysis of the changes in vegetation cover, not only in the region of Tauá, but throughout the semi-arid region, must therefore take into account the effects of climatic seasonality, especially rainfall, since the Caatinga shows a very rapid response to the presence of moisture, in addition to the significant changes in land usage and cover due to anthropic action during the rainy season. Figure 6 shows the temporal distribution of the rainfall from August 1983 to August 2011, as well as its relationship to the dynamics of natural regeneration and/or anthropic changes in the classes of vegetation of a fragment of the caatinga biome in the western region of the district of Tauá.
The highest seasonal variability was seen in areas of low (between 0.2 and 0.4) and moderately low (between 0.4 and 0.6) NDVI classes, a behaviour that demonstrates a symmetrically opposite adjustment between the two classes. For a better understanding of the seasonal distribution of rainfall and its relationship to NDVI class dynamics, the temporal response will be analysed over four distinct periods.
During seasonal Period I (August 1985 to August 1993), a higher concentration of rainfall can be seen in the region when compared to the other periods (Figure 6). Also during this time, there was a considerable increase in the area of the very low (between 0 and 0.2) and low (between 0.2 and 0.4) NDVI classes, coinciding with a reduction in areas containing the moderately low (NDVI
Figure 4 - Distribution of the mean area occupied by NDVI class value between August 1985 and August 2011 in the western region of Tauá, Ceará. The same letters between NDVI classes do not differ statistically by T-test (p<0.05)
between 0.4 and 0.6) and moderately high (NDVI between 0.6 and 0.8) classes. This behaviour is associated with the incorporation of land previously occupied by woody vegetation into areas of agriculture and/or native pasture, and is due to the predominant subsistence agriculture in the region being sustained by rainfed crops, highly dependent on climatic seasonality.
Contrary to Period I, Period II (August 1993 to August 1996) was characterised by a reduction in total rainfall due to the 1990/1993 El Nino effect. During this period there was also considerable inversion of the dynamics of land usage and occupation, with a reduction in areas of the very low (between 0 and 0.2) and low (between 0.2 and 0.4) NDVI classes, associated with increases of 444 and 1,807% in the moderately low (NDVI between 0.4 and 0.6) and moderately high (NDVI between 0.6 and 0.8) classes respectively (Table 2 and Figure 6). These increases are possibly related to the natural regeneration of the shrub stratum due to the areas previously used for agriculture now lying fallow, since during this period, the rains were scarce and well below the historical average for the region. The success of agricultural production in certain crops, especially in non-irrigated areas, depends largely on the local rainfall regime. Therefore, in periods when rainfall distribution in both time and space is irregular, cultivated plants can suffer a water deficit, making production economically unfeasible. It can be assumed that extreme variations in
rainfall events directly influence the abandonment of areas destined for agricultural activity.
During Period III (August 1996 to August 2004) there is slight recovery of water conditions in the region and once again a considerable increase in the classes of low NDVI, with a 17% increase in the area of very low NDVI (between 0 and 0.2) and a 26% increase in the class of low NDVI (between 0.2 and 0.4). Similarly to Period I, this increase was again accompanied by a reduction in the moderately low (NDVI between 0.4 and 0.6) and moderately high (NDVI between 0.6 and 0.8) classes (Table 2 and Figure 6). The most noteworthy of the class with low NDVI values (0.2 to 0.4) in the study area are close to those found by Xaudet al. (2009), who
analysed the vegetation patterns of the Savana in the State of Roraima using NDVI-NOAA time series and the relationship with climate, and found that on average the vegetation maintained an NDVI value of between 0.2 and 0.3: the pioneer formations being around 0.4, and the forest typologies with a woody stratum showing average NDVI behaviour of between 0.5 and 0.6.
For Period IV (August 2004 to August 2011), behaviour similar to that in period II was characterised by reductions in areas of the very low (0 to 0.2) and low (between 0.2 and 0, 4) classes of NDVI. Furthermore, in both the above classes, the areas registered in 2011 receded to values close to those recorded in 1985
(Figure 6). The very low (between 0 and 0.2) and low (between 0.2 and 0.4) NDVI classes in August 2004 covered an area of 2,399 and 35,393 ha respectively (Table 2). Whereas in August 2011, they cover only 590 and 21,711 ha respectively. This reduction in the previously discussed classes resulted in an increase of 394 and 1.075% for the moderately low (0.4 and 0.6) and moderately high (0.6 and 0.8) classes respectively, demonstrating an increase in photosynthetic activity and a consequent increase in leaf density during this period. Similar behaviour was seen by Aquino and Oliveira (2012), studying NDVI dynamics in the São Raimundo Nonato hub, in the State of Piauí. These increases are related to the natural regeneration of the shrub stratum due to the fallowness of areas previously used for agriculture and/or extensive pasture, since the success of crops planted in the Northeast depends on the regularity and quantity of the rains (SILVAet al., 2011). The spatial
and temporal variability of the rainfall in arid and semi-arid regions are limiting factors in rainfed agriculture (GRAEF; HAIGIS, 2001).
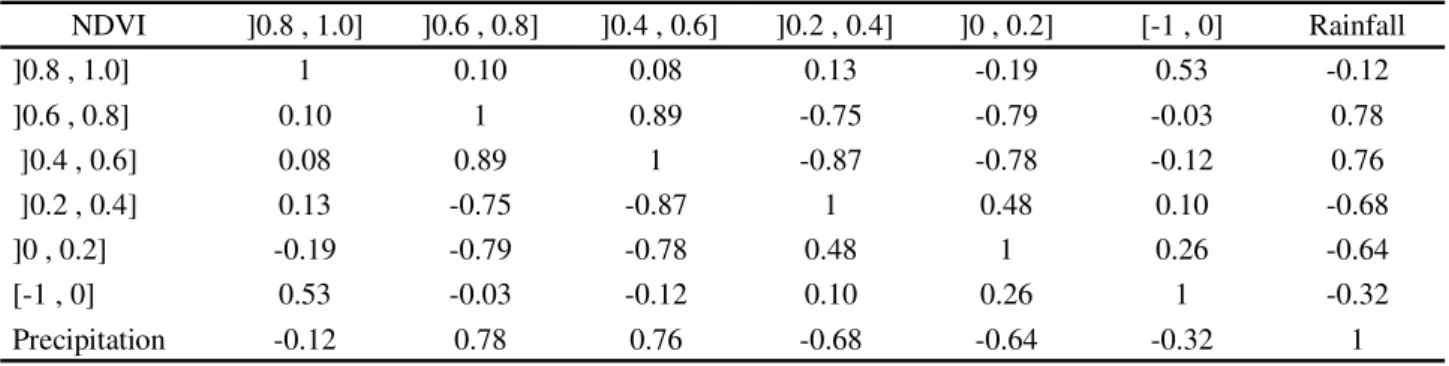
Table 3 shows the correlation coefficients between NDVI class interval and rainfall between 1985 and 2011. There was a weak correlation between the NDVI classes of shade and/or water (between -1 and 0), and no correlation with the high NDVI class (between 0.8 and 1.0) for the variable, precipitation.
The results of the correlation of rainfall with the other NDVI classes show that, both for the areas with less
ground protection and those with higher NDVI values, there was no correlation at 5% significance. It is worth noting that in this specific case time-integrated precipitation was used, i.e. taking into account not only the rainfall that occurred in a single year, but also the mean rainfall distributed from August to August, representing the year in question and the two previous years, as specified in the methodology.
Using Spearman’s correlation between the areas containing classes of NDVI, it was found that that the moderately low (NDVI between 0.4 and 0.6) and moderately high (NDVI between 0.6 and 0.8) classes showed the best correlation with the other classes, correlating negatively with the very low (NDVI between 0 and 0.2) and low (NDVI between 0.2 and 0.4) classes, and correlating positively with each other. Accordingly, when analysing the satellite images shown in Figure 3, and the data shown in Table 2, it can generally be seen that there is a greater predominance of areas of sparse caatinga. This is closely related to the types of usage that have been seen in the region, a result of the successive removal of the natural vegetation by anthropic action, since there was no direct correlation with rainfall. Degradation of the region is therefore related to the greater pressure exerted on the resources of the caatinga due to the promotion of livestock activity with small ruminants and to subsistence cultivation, also demonstrated by Nascimento, Lima and Lima (2014) in a fragment of caatinga in the sub-basin of the Upper Parnaíba.
Table 3 - Spearman correlation coefficient between areas of distinct NDVI classes and rainfall for the western region of the district of
Tauá from August 1985 to August 2011
NDVI ]0.8 , 1.0] ]0.6 , 0.8] ]0.4 , 0.6] ]0.2 , 0.4] ]0 , 0.2] [-1 , 0] Rainfall
]0.8 , 1.0] 1 0.10 0.08 0.13 -0.19 0.53 -0.12
]0.6 , 0.8] 0.10 1 0.89 -0.75 -0.79 -0.03 0.78
]0.4 , 0.6] 0.08 0.89 1 -0.87 -0.78 -0.12 0.76
]0.2 , 0.4] 0.13 -0.75 -0.87 1 0.48 0.10 -0.68
]0 , 0.2] -0.19 -0.79 -0.78 0.48 1 0.26 -0.64
[-1 , 0] 0.53 -0.03 -0.12 0.10 0.26 1 -0.32
CONCLUSIONS
1. In the western region of the district of Tauá, there is a predominance of the NDVI class that offers little protection from the vegetation cover, corresponding to 80% of the monitored area;
2. Reductions in the woody vegetation cover are minimised in periods of water scarcity and intensified during normal periods of rainfall;
3. The temporal dynamics of the rainfall, and the spatial and temporal dynamics of the NDVI, helped in detecting evidence of the process of degradation of the caatinga biome in an area of the district of Tauá, in the State of Ceará;
4. It is essential to establish zones of climate risk for agricultural activities, as this is a tool of fundamental importance in planning agriculture and reducing deforestation in the region;
5. There is an urgent need to adopt public policies in the Tauá region in line with the environmental regularisation of rural properties as established in the new Forest Code.
REFERENCES
AQUINO, C. M. S.; OLIVEIRA, J. G. B. Estudo da dinâmica do Índice de Vegetacão por Diferença Normalizada (NDVI) no núcleo de São Raimundo Nonato-PI.GEOUSP - Espaço e Tempo, n. 31, p. 157-168, 2012.
ARAÚJO, E. L.; ALBUQUERQUE, U. P.; CASTRO, C. C. Dynamics of Brazilian caatinga: a review concerning the plants, environment and people. Functional Ecosystemsand Communities, United Kingdom, v. 1, p. 15-29, 2007.
BRASIL. Ministério do Meio Ambiente. Bioma Caatinga: contexto, características e estratégias de conservação. 2014. Disponível em: <http://www.mma.gov.br/ biomas/caatinga/ item/191>. Acesso em: 24 fev. 2014.
COSTA, T. C. C. et al. Interação de fatores biofísicos e antrópicos com a diversidade florística na indicação de áreas para conservação do bioma caatinga.Sociedade & Natureza,
v. 21, n. 1, p. 19-37, 2009.
DAWELBAIT, M.; MORARI, F. Limits and potentialities of studying dryland vegetation using the optical remote sensing.
Italian Journal of Agronomy, v. 3, p. 97-106, 2008.
FERREIRA, J. M. S.et al. Análise espaço-temporal da dinâmica da vegetação de caatinga no município de Petrolina - PE.Revista Brasileira de Geografia Física, v. 4, p. 904-922, 2012. GRAEF, F.; HAIGIS, J. Spatial and temporal rainfall variability in the sahel and it’s effects on formen management strategies.
Journal of Arid Environments, v. 48, p. 221-231, 2001.
INSTITUTO DE PESQUISA E ESTRATÉGIAS ECONÔMICAS DO CEARÁ.Perfil básico municipal 2013: Tauá: laudo técnico. 2013. p. 1-18. Disponível em: <http:// www.ipece.ce.gov.br/publicacoes/perfil_basico/pbm-2013/ Taua.pdf>. Acesso em: 04 fev. 2015.
JUSTINIANO, M. J.; FREDERICKSEN, T. S. Phenology of tree species in Bolivian dry forests.Biotropica, v. 32, p. 276-281, 2000.
LE HOUEROU, H. N. Desertization.In: LAL, R. (Ed.).Soil Science, p. 468-474, 2006.
LIRA, V. M. et al. Variação sazonal da cobertura vegetal em áreas do submédio São Francisco a partir de dados NDVI e imagens TM-LANDSAT 5.Enciclopédia Biosfera, v. 7, n. 12, p. 1-9, 2011.
LOPES, H.et al. Parâmetros biofísicos na detecção de mudanças na cobertura e uso do solo em bacias hidrográficas. Revista Brasileira de Engenharia Agrícola e Ambiental, v. 14, n. 11, p. 1210-1219, 2010.
MOREIRA, J. N.et al. Caracterização da vegetação de caatinga e da dieta de novilhos no Sertão de Pernambuco. Pesquisa Agropecuária Brasileira, v. 41, p. 1643-1651, 2006.
NASCIMENTO, S. S.; LIMA, E. R. V.; LIMA, P. P. S. Uso do NDVI na análise temporal da degradação da caatinga na sub-bacia do Alto Paraíba.Revista OKARA: Geografia em debate, v. 8, n. 1, p. 72-93, 2014.
PEREIRA JÚNIOR, J. S. Nova delimitação do semi-árido brasileiro. Brasília, DF: Biblioteca Digital da Câmara dos Deputados. Centro de Documentação e Informação, 2007. p. 24.
PONZONI, F. J. SHIMABUKURO, Y. E. Sensoriamento remoto no estudo da vegetação. São José dos Campos: Parêntese, 2010. 127 p.
REYNOLDS, J. F.; SMITH, D. M. S.Global Desertification: do humans cause deserts? Berlin: Dahlem University Press, 2002. 437 p. (Dahlem Workshop Report 88).
RODAL, M. J. N.; MARTINS, F. R.; SAMPAIO, E. V. S. B. Levantamento quantitativo das plantas lenhosas em trechos de vegetação de caatinga em Pernambuco.Revista Caatinga, v. 21, p. 192-200, 2008.
SÁ, I. I. D. et al. Uso do índice de vegetação da diferença normalizada (IVDN) para caracterização da cobertura vegetal da região do Araripe pernambucano. Revista Brasileira de Geografia Física, v. 1, n. 1, p. 28-38, 2008.
SÁ, I. I. S. et al. Cobertura vegetal e uso da terra na região Araripe pernambucana. Mercator, v. 9, n. 19, p. 143-163, 2010.
SILVA, A. P. N.et al. Albedo de superfície estimado a partir de imagens Landsat 5 - TM no semiárido brasileiro. Revista de Geografia, v. 27, n. 1, p. 154-168, 2010.
SILVA, V. P. R. et al. Análise da pluviometria e dias chuvosos na região Nordeste do Brasil.Revista Brasileira de Engenharia Agrícola Ambiental, v. 15, n. 2, p. 131-138, 2011.
SUN WU. An approach to the designing principle of desertification indicators.Journal of Natural Resources, v. 15,
n. 2, p. 160-163, 2000.
TRIGUEIRO, E. R. C.; OLIVEIRA, V. P. V.; BEZERRA, C. L. F. Indicadores biofísicos e a dinâmica da degradação/desertificação no bioma caatinga: estudo de caso do município de Tauá, Ceará.
Revista Eletrônica do Prodema, v. 3, n. 1, p. 62-82, 2009.