A CRITICAL APPROACH TO THE USE OF THE BCG MATRIX: PORTFOLIO
ANALYSIS OF BRAZILIAN PULP MARKETED IN THE INTERNATIONAL
MARKET
1Amarildo Hersen2*, João Carlos Garzel Leodoro da Silva2 and Romano Timofeiczyk Junior2
1 Received on 10.09.2017 accepted for publication on 02.08.2018.
2 Universidade Federal do Paraná, Programa de Pós-Graduação em Engenharia Florestal, Curitiba,PR-Brasil. E-mail: <amarildohersen@yahoo.com.br>, <garzel@ufpr.br> and <romano.timo@gmail.com>.
*Corresponding author.
ABSTRACT – The objective of this study was to highlight some limitations of the use of the Boston Consulting Group Matrix to propose strategies to maximize the performance of the sector in the international pulp market. The procedure adopted for the investigation was the portfolio analysis, for the different types of pulp exported by Brazil, using the Growth Share Matrix. The results indicate that the BCG Matrix is static and non-dynamic analysis and arbitrary questions to define the market growth rate can provide different interpretations, possibly contradictory.
Keywords: Forest industry, Strategy, Management.
UMA ABORDAGEM CRÍTICA AO USO DA MATRIZ BCG: ANÁLISE DE
PORTFÓLIO DA CELULOSE BRASILEIRA COMERCIALIZADA NO MERCADO
INTERNACIONAL
RESUMO – O objetivo deste estudo foi de evidenciar algumas limitações de uso da Matriz Boston Consulting Group – BCG para proposição de estratégias de maximização de desempenho do setor, no mercado internacional de celulose. O procedimento adotado para a investigação foi a análise de portfólio, para os diferentes tipos de celulose exportados pelo Brasil, com uso da Matriz BCG do tipo Crescimento-parcela. Os resultados indicam que a Matriz BCG se mostra provida de análise estática e não dinâmica e questões arbitrárias para definição da taxa de crescimento do mercado podem proporcionar diferentes interpretações, eventualmente contraditórias. Palavras-Chave: Indústria florestal; Estratégia; Gestão.
1. INTRODUCTION
Focused on the search for better results, companies of reference place less emphasis on financial approaches and more on strategic methods. This is the result of a research done by Cooper et al. (1999), which highlights the importance of portfolio management by studying the portfolio management and performance practices of a group of companies in the USA.
Developed by the management consulting firm Boston Consulting Group (BCG), in the mid-1970s
(Ghemawat, 2002), the BCG matrix model, also known as growth/share or growth/participation matrix, has expanded its use as a strategic tool. The increase in the use and importance of the matrix is due to the ability to identify the ideal product portfolio (and/or services) of an organization, a portfolio that is classified according to its market share and its industry growth rate. The BCG matrix has applicability to the most different industries and shows itself as an important tool for portfolio management.
that reach a prominent position in a nation, due to the volume of resources they generate, the number of jobs they generate, production capacity, among other factors.
The pulp industry installed in Brazil has an important role for the national economy. In the year 2015 alone, the industry produced some 17.4 million tons of pulp – 15 million tons of short fiber only. These figures keep Brazil in the fourth position in the ranking of the world’s largest producer, a position achieved since 2008, losing only to the USA, China and Canada. Regarding the destination of pulp produced in the country in 2015, 34% answered the domestic market and 66% was destined to the foreign market. Thus, pulp exports in that year contributed 5.6% of the value of all exports registered in the country’s Trade Balance (IBÁ, 2017).
The importance of the pulp industry has been ratified since 2014, when Brazil plunged into economic crisis. Despite the adverse scenario, stimulated by the exchange devaluation, the pulp industry grew and strengthened in the international market.
Thus, the research applied the strategic tool called the BCG matrix to a reference industry for the Brazilian economy, aiming to highlight some limitations of the use of the BCG matrix to propose strategies for maximizing performance, with portfolio analysis, contemplating the different types of pulp exported by Brazil to the global market.
2. MATERIALAND METHOD
The pulp export data, for the purposes of this research, originated from the United Nations Commodity Trade statistical database (COMTRADE, 2017), for the period from 2010 to 2015. A five-year interval was chosen because it was understood that the dynamics of the pulp market does not occur in a short period of time, demanding investments that are generally robust and of high monetary value.
Pulp, whether it is traded on the domestic or foreign market, can be differentiated in several ways. The harmonized system, HS, used by COMTRADE differs as follows: by the production process (mechanical, chemical, mixed), dissolved or not, chemical element used for dissolution (sulphate, soda, sulphite) and different fibrous materials (wood, paper, cardboard, others). (COMTRADE, 2017)
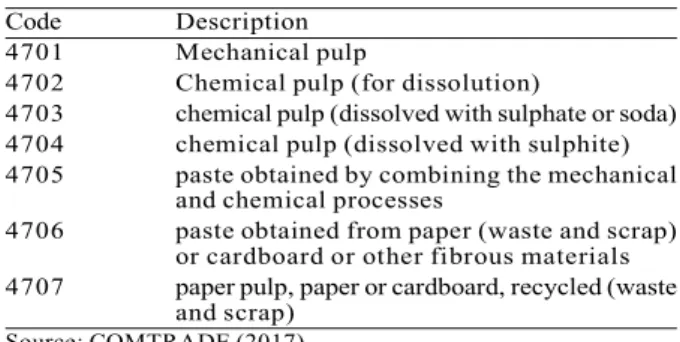
Thus, the forms of pulp differentiation used in this research are in accordance with the harmonized system code, in four digits, as described in Table 1:
Usually, the BCG model, or growth-plot, is applied as a strategy tool for companies. However, for the purposes of this research, it will be used among nations to analyze the international pulp market. Such use is justified by the fact that a country offers several products, meeting the demand of the international market, and some of these products may occupy a prominent position in relation to competing countries, while others may be in a not so comfortable position. Also, some products may need the capital to fund their growth or competitive clashes, while others may be generating more capital than they actually need. The major challenge, therefore, is to classify the products under analysis and propose strategies to improve the performance of the sector in the international market, thus contributing to the economic growth of the country of interest.
The matrix has two dimensions, the first one related to market share (column) and the second to market growth (line) (Day, 1977; Maximiniano, 2008; Schrippe, 2013). Basically, the larger the market share or the faster the product market grows, the better it is for the company under review. The interpretation of each quadrant is detailed in the work of Stern and Stalk Jr (1998).
The product portfolio approach distinguishes itself from other integrated planning techniques by defining the strategic role of each product based on the growth rate of the product market as well as the competitive market share. The two factors are usually divided into high and low categories to create a square 2x2 matrix (Chiavenato and Sapiro, 2003).
The individual roles are then integrated into a strategy for the entire product portfolio, considering Table 1 – Pulp type and code according to harmonized system.
Tabela 1 – Tipo de celulose e código conforme sistema harmonizado
Code Description 4701 Mechanical pulp
4702 Chemical pulp (for dissolution)
4703 chemical pulp (dissolved with sulphate or soda) 4704 chemical pulp (dissolved with sulphite) 4705 paste obtained by combining the mechanical
and chemical processes
4706 paste obtained from paper (waste and scrap) or cardboard or other fibrous materials 4707 paper pulp, paper or cardboard, recycled (waste
and scrap)
the product portfolio of significant competitors. Thus, differences in growth potential and relative market share contribute to the determination of which products represent investment opportunities, which should provide investment funds and which ones should eventually be eliminated from the portfolio (Chaim, 2003).
The rationale for using the market share lies in the accumulation of evidence that the market share is strong and positively correlated with the profitability of a product. The fact that companies with significant market shares present lower costs justifies this correlation. The lower costs are due to economies of scale and the experience curve. The economies of scale resulting from the reduction of unit cost as the number of units produced, although more substantial in production, can also be achieved through marketing, sales, distribution, administration, research and development. The experience curve, which also allows the reduction of costs as the units produced increase, has as a source the emergence of new production processes, better performance of production equipment and product re-design (Chaim, 2003).
It is important to note that the growth-plot matrix approach slightly modifies the use of the market share, due to the emphasis given in the relative market share. The market share is understood to be the ratio between the sales of a product, in the case of this research, by one country and the sales of the product of the largest competing country, both in units. Thus, as proposed by Mutandwaet al. (2009), the matrix thus has the identification of the column vector and this procedure, adapted for the scope of this research, can be expressed by the following equation:Eq.1
In which:
MS = Market share;
q = quantity sold in units in the final year of the analysis;
And subscribers:
r = relative;
i = product i;
A = country A (of interest);
J = leading market leader (or vice-leader in the case of country A being leader).
Thus, a country has a relative market share of more than 1.0 in the case of being the largest international competitor and less than 1.0 when it does not lead the market. In the case of having a relative market share equal to 1.0, the understanding is that the country divides the market leadership, together with another country. The conversion of the result to the logarithmic scale is convenient to facilitate the matrix visualization (graph), condensing the results.
The growth-plot matrix line vector expresses the market growth rate (%) and is generally separated into areas of “high” and “low” growth. An annual market growth rate above 10% is considered high (Kotler, 2000). Similarly, Pereira et al. (2006), using the BCG matrix to show their importance as an aid to the educational manager of private higher education institutions in the interior of the state of São Paulo, used 10% as the cut-off rate for growth. However, there is no consensus in the scientific community regarding the definition of the boundary between “high” and “low” growth for the market growth rate. Zheng et al. (2011) analyzed the service sector in the Xiacheng District in Hangzhou, China, using a 12.5% rate of cut of the market growth rate. Mutandwaet al. (2009), when analyzing the coffee export market in Rwanda, Africa, considered in their analysis a market growth rate of 6% as a limit between “high” and “low” growth.
The equation of the market composite annual growth rate, suggested by Winona and Wandebori (2012) as the most used, adapted for the present research, can be expressed by:Eq.2
In which:
CAGR = compound annual growth rate of the market (%);
q = total quantity sold in the market, in unit (physical and monetary, for comparison purposes);
n = number of years considered in the analysis period.
And the subscribers:
i = product i;
I = international market;
0, 1= initial and final periods, respectively.
MS = ln
iA iJr,i,A
( )
qqAfter the vectors of the growth-plot matrix have been defined, their visualization can be found in Abell and Hammond (1979).
3. RESULTS
Besides Brazil being the fourth largest producer of pulp for paper and the first of eucalyptus pulp, the country has reached, year after year, a greater participation in world production. In the ten-year period (2006-2015), Brazilian pulp production increased 58.39%, while world production in this period grew only 13.51%. The good performance of the Brazilian industry allows to affirm that the percentage of increase of the national production was 4.32 times the percentage of increase of the world production, for the same period. As a result, Brazilian pulp production showed a high trend, with an average growth rate of 5.24% per year in the period (FAO, 2017).
In the international market, Brazil participates mainly with dissolved sulphate or soda pulp (4703). In the year 2015, the exported volume of this type of pulp represented 95.73% of the total, while the pulp for dissolution (4702) corresponded to 3.61%, pulp originated from paper or recycled cardboard (4707) answered by 0.65% and pulp from paper or cardboard or other fibrous material (4706) only 0.01%.
In the case of volume exported by the country, dissolved sulfate/soda pulp reached in 2015 the amount of 11.5 million tons, while pulp for dissolution reached the volume of 434.9 thousand tons. At a much lower
volume, pulp originated from recycled paper and cardboard and paper/cardboard/other materials reached the exported volume of 78.2 thousand and 1.4 thousand tons, respectively.
Dissolved sulfate or soda pulp, the most expressive of the Brazilian export portfolio by the sector, has been showing significant growth in recent years. The amount exported rose from 8.4 million tonnes in 2010 to 11.5 million tonnes in 2015, corresponding to an increase of approximately 38% in the period.
In the international trade of pulp of type 4706 and 4707, made from paper waste, scrap and recycling, Brazil shows little contribution to meet market demand. pulp obtained from recycled paper (4707) represents the largest volume traded in the international market, 52.19% of the total. In contrast, pulp obtained from waste and scrap (4706) has the smallest share of the market, only 0.76% of the pulp sold internationally. These values are in Table 2.
In pulp type (4702), which corresponds to 3.95% of the market, and type (4703) - which represents 43.10% of the entire international pulp market – Brazil stands out as the largest exporter of pulp 4703) and fifth largest exporter of type pulp (4702).
In terms of price, Brazilian companies proved to be competitive for pulp type 4702 and 4703. For pulp type 4702 the average price of the ton, practiced by the largest exporter (South Africa) in the year 2015 was US $ 769.05. Considering the eight countries that led the export volume ranking, the average price in
Ranking Pulp
(exported volume)
4702 % 4703 % 4706 % 4707 %
1 South Africa 18.67 Brazil 24.23 USA 21.04 USA 33.99 2 USA 18.35 Canada 14.89 Germany 16.66 United Kingdom 8.76 3 Sweden 12.93 USA 13.98 Sweden 13.12 Japan 7.40 4 Canada 12.14 Chile 9.07 China 9.16 Netherlands 5.28 5 Brazil 9.99 Indonesia 7.14 Denmark 5.59 France 4.98 6 Czech Rep. 6.85 Finland 5.83 France 5.35 Germany 4.59 7 Austria 3.77 Sweden 5.69 Thailand 5.26 Canada 4.07 8 Finland 3.47 Russia 4.28 Philippines 2.70 Italy 3.16 n-8 others 13.84 others 14.88 others 21.12 others 27.77 Total 4,355,499 100.00 47,582,745 100.00 835,607 100.00 57,615,752 100.00 (ton.)
Source: Research data from COMTRADE (2016).
Note: For pulp type 4706 and 4707 Brazil occupies the position of number 32 and 43, respectively, in the ranking.
Table 2 – Ranking of pulp exporting countries - in ton. (2015).
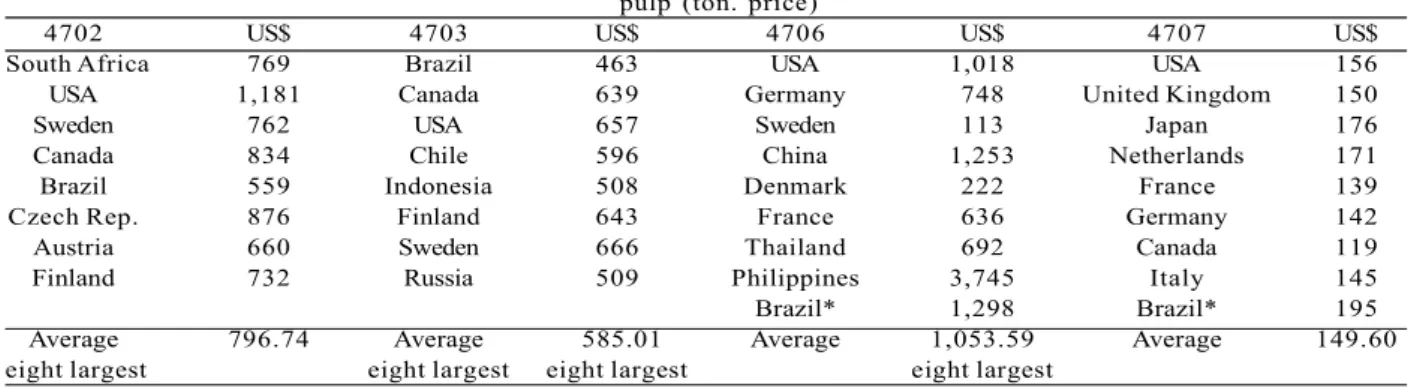
the same year was US $ 796.74 per ton. Brazil exported in 2015 the average price of US $ 558.83, which corresponds to 29.86% below the average price of the eight main exporting countries and 27.34% below the average price of the market leader country. As for the pulp type 4703, Brazil leads the international market by having a larger market share, which is priced at 27.43% lower than the second largest exporter (Canada) and 20.77% lower than the average of the eight largest exporters in the world. This information is shown in Table 3.
In relation to the pulp types (4706) and (4707), Brazil exported in 2015 at high average prices, when compared to the eight main exporting countries, being higher by 23.17% and 30.40%, respectively.
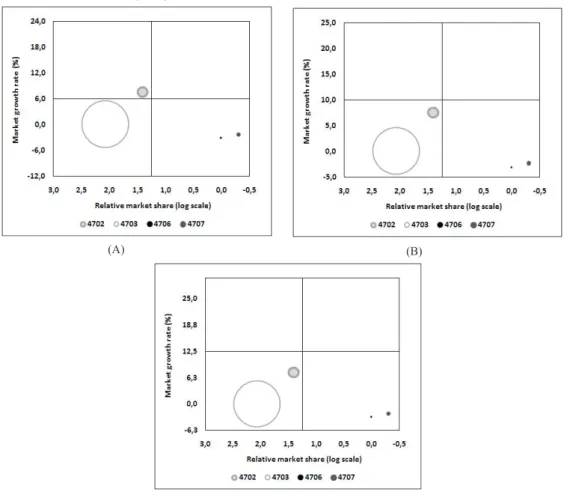
In order to have a portfolio view, relative market share and market growth, we can observe Figure 1, which shows the growth-plot matrix of the pulp industry with the joint information. Also, this figure expresses different market growth rates, in consonance with the already completed and mentioned researches, to try to understand if the arbitrariness in the definition of the rate of growth compromises the interpretation and the definition of strategies.
The size of the bubble in Figure 1 shows the participation of the product in the portfolio of items exported by the Brazilian pulp industry. In the quadrats of the matrix, cellulose type 4702 is in the upper left, which corresponds to a high growth market (11.94%) and a high relative share (53.49%), considering the rates of 6% and 10% annual growth as limits between low and high market growth (Figure 1A and 1B). However, when considering the 12.5% index to distinguish between
low and high market growth (Figure 1C), the interpretation is different from the one observed so far. Thus, with a market growth index of less than 12.5%, pulp type 4702, similar to the others under analysis, presents a low rate of market growth.
Pulp type 4703 is in the lower left quadrant, which means that the market is not high growth (2.79%) -below 6%, 10% and 12.5% - but growth positive, and the relative share is even larger, corresponding to 162.76% of the volume exported by the main competitor (Canada). It is worth remembering that Brazil is the world’s largest exporter of dissolved sulphate or soda pulp (4703) and the fifth largest exporter of pulp for dissolution (4702) - behind only South Africa, USA, Sweden and Canada.
The chemical pulp for dissolution (4702), also known as soluble pulp, has as its derivatives, among others, ether (used in solvents, oils, resins and paints), ester (flavoring widely used by the food industry such as sweets, candies, ice creams, juices and others) and viscose (tissue production). The dissolved sulphate or soda based chemical pulp (4703) is used for paper production. The Kraft process (sulphate) is dominant in Brazil and gives rise to unbleached (for packaging paper, cardboard and cartons and coatings) and bleached (for paper for packaging, envelopes and printing of books, magazines, maps among others) pulp.
At the other end of the matrix pulp type 4706 and 4707, located in the lower right quadrant, showed a reality that was not in agreement with the previous one. In this type of pulp the Brazilian exporting companies operate in the market with less expressive
pulp (ton. price)
4702 US$ 4703 US$ 4706 US$ 4707 US$
South Africa 769 Brazil 463 USA 1,018 USA 156 USA 1,181 Canada 639 Germany 748 United Kingdom 150
Sweden 762 USA 657 Sweden 113 Japan 176
Canada 834 Chile 596 China 1,253 Netherlands 171 Brazil 559 Indonesia 508 Denmark 222 France 139 Czech Rep. 876 Finland 643 France 636 Germany 142 Austria 660 Sweden 666 Thailand 692 Canada 119 Finland 732 Russia 509 Philippines 3,745 Italy 145 Brazil* 1,298 Brazil* 195 Average 796.74 Average 585.01 Average 1,053.59 Average 149.60 eight largest eight largest eight largest eight largest
Source: Research data from COMTRADE (2016).
* Note: For pulp type 4706 and 4707, Brazil occupies the position of number 32 and 43, respectively, in the ranking.
Table 3 – Average price practiced in the international pulp market by Brazil and main exporting countries (2015).
annual growth rate - pulp type (4707) was 1.16% - or even negative - pulp type (4706) was -0.96%. Still, the Brazilian companies hold an inexpressive market share, being 0.81% for pulp type (4706) and 0.4% for type pulp (4707). The use of the pulp obtained from paper or cardboard or other fibrous materials (4706) and the pulp obtained from recycled paper or cardboard (4707) is intended for the production of packaging paper, sanitary paper and printing paper.
For purposes of comparison, the growth-plot matrix whose base was composed of monetary information was also elaborated (Figure 2). This matrix evidenced more pessimistic market growth when compared to the real data matrix - physical volume, Figure 1.
For pulp type 4702 and 4703, the market growth (compound annual growth rate), considering the value of pulp, was 7.56% and 0.08%, respectively. As the market growth rates in monetary terms were lower than the market growth rates in terms of physical volume, there is evidence of a reduction in the average market price for both products in the period.
Again, depending on the arbitrariness of the limit rate for setting low and high market growth, different interpretations can be given for the cellulose market type 4702. Based on monetary information only when using the market growth rate of 6% a limit between low and high growth, it is possible to observe high market growth for this type of pulp.
Source: research data from COMTRADE (2016).
Note: For the year 2015, the United Nations Commodity Trade (COMTRADE) statistical database did not record Brazilian exports to mechanical pulp (4701) and pulp obtained by the combination of mechanical and chemical processes (4705), both of which were excluded from the analysis. Also, the dissolved sulfite-based chemical pulp (4704) had a marketing record of only 1kg, and it was also excluded from the analysis because it could possibly be a sample shipment abroad and not properly effective and regular commercialization.
Figure 1 – Brazil’s growth-plot matrix in the global pulp market (kg).
Figura 1 – Matriz crescimento-parcela do Brasil no mercado global de celulose (kg).
(A) (B)
With regard to celluloses of type 4706 and 4707, the compound annual rate of decrease of the market in the analyzed period was evidenced by the respective negative growth rates of -3.06% and -2.29%. Also, the market growth rates in monetary terms were lower than the indexes related to the market growth in terms of physical volume, bringing evidence of reduction of the average market price for both products in the period.
4. DISCUSSION
The portfolio analysis of the pulp exported by Brazil, when performed from the viewpoint of the growth-plot matrix, is limited. In terms of strategies to be adopted for the portfolio of products in question, considering the results achieved using the growth-plot matrix, they could be classified into two distinct groups: high and
low growth businesses. However, arbitrariness in defining the market growth rate leads to different interpretations of the results achieved.
Product 4702 is shown as a high growth business in the international market and Brazilian companies have a high market share, when rates of 6% and 10% are used to determine high and low market growth. However, when the reference rate for growth of greater or lesser market expressiveness is 12.5%, the reality is not so optimistic and the market starts to show low growth for the said product.
The industries for products 4702 and 4703 participate in markets that require high investments. The recommendation is to maintain the market leadership for the product 4703 and seek market leadership for
Source: research data from COMTRADE (2016).
Figure 2 – Brazil’s growth-plot matrix in the global pulp market (US$).
Figura 2 – Matriz crescimento-parcela do Brasil no mercado global de celulose (US$).
(A) (B)
the product 4702. It is worth noting that the country sells the products on the international market at competitive prices, enabling it to maintain (4703) and/or achieve leadership 4702) on the market, if there are no differences in the quality of the domestic product compared to abroad.
The international market reality for products 4706 and 4707 is expressively different and classified as low growth businesses, regardless of the low and high market growth rate. Classified in the lower right quadrant, products thus classified tend to generate insignificant financial flows and do not allow high returns. However, the low growth of the sector also does not require large investments. The recommendation is in the field of reshaping the business. The gradual replacement of the production platform of 4706 and 4707 folders for folders 4702 and 4703, despite requiring high investments, should be evaluated by companies operating in the international market. The hypothesis of searching for a new market, such as the internal one, for example, can also be considered.
5. CONCLUSION
A portfolio analysis should contain information for not only short but also long-term analysis, not allowed by the matrix model Boston Consulting Group. In traditional use this problem can only be minimized with the elaboration of several matrices, at different moments of time. Thus, the BCG matrix is provided with static analysis, punctual in time, but lacking a trend or prospective approach.
Also, even within the field of possibility of analysis of the BCG matrix, there are still arbitrary questions such as the definition of the market growth rate. The percentages used and/or suggested by the scientific community are disoriented, often departing from the traditional percentage of 10% and easily varying from 6% to 12.5%. Such a variation can lead to different interpretations - possibly even contradictory - for a matrix, using the percentage used to define low and high market growth and not to reflect its reality.
It is suggested for future work the elaboration of studies that conceptually discuss adequate growth indices for each reality, elaborating criteria for definition of low and high growth, considering for example if the economy under study is in crisis or growth below average or still above average growth.
6. REFERENCES
Abell D, Hammond J. Strategic marketing planning: problems and analytical approuches. New Jersey: Prentice-Hall; 1979.
Chaim EH. Diagnóstico e revisão do portfólio de produtos de uma empresa da indústria de painéis de madeira. São Paulo: USP; 2003.
Chiavenato I, Sapiro A. Planejamento estratégico. Rio de Janeiro: Elsevier; 2003.United Nations Commodity Trade - COMTRADE. Database.
[accessed on: 08 Jan. 2017]. Avaiable at: http:// comtrade.un.org/db/dqBasicQuery.aspx.
Cooper R, Edgett S, Kleinschmidt E. New product portfolio management: pratices and performance. Journal of Product Innovation
Management.1999:16:333-51.
Day G. Diagnosing the product portfolio. Journal of Marketing. 1977;41(2):29-38.
Food and Agriculture Organizatin of the United Nations - FAO. Forestry production and trade. [accessed on: 2017 Apr. 21]. Available on: httphttp://www.fao.org/faostat/en/#data/FO.
Ghemawat P. Competition and business strategy in historical perspective. Business History Review. 2002;76:37-74.
Indústria Brasileiro da Árvore - IBÁ. Anuário estatístico, 2016. Disponível em: http://iba.org/ images/shared/Biblioteca/
IBA_RelatorioAnual2016_.pdf . [acessado em: 25 de jan. de 2017].
Kotler P. Administração de marketing: a edição do novo milênio. São Paulo: Prentice Hall; 2000.
Maximiniano ACA. Teoria geral da administração: da revolução urbana à revolução digital. São Paulo: Atlas; 2008.
Mutandwa E, Kanuma NT, Rusatira E, Kwiringirimana T, Mugenzi P, Govere I, et al. Analysis of coffee export marketing in Rwanda: Application of the boston consulting group matrix. African Journal of Business
Pereira SMM, Giuliani AC, Farah OE, Alves MIF. Planejamento de marketing utilizando a matriz Boston Consulting Group:
umaanáliseeminstituiçõeseducacionais. In: Anais do 6º Colóquio Internacional sobre Gestão Universitária na América do Sul. Blumenau SC, Blumenau: 2006.
Schrippe P, Back L, Weise AD, Kovaleski JL. Planejamento estratégico: análise SWOT e matriz BCG aplicadas em um centro esportivo wellness e fitness. Espacios.2013;34(5):15.
Stern CW, Stalk Jr G. Perspectives on strategy from the Boston Consulting Group. Boston:
Boston Consulting Group; 1998.
Winona V, Wandebori H. Portfolio strategy of pangeran group using BCG matrix. Journal of Business and Management.2012;1(3):170-6.
Zheng J, Han J, Jiang J. How to identify the leading industry in the service sector for Xiacheng District of Hangzhou: based on BCG matrix and location quotient. In: The 5th International Conference on Management and Service Science. Wuhan, China: 2011. [accessed at: 2017 Jul. 02]Available on:http://