www.ambi-agua.net E-mail: [email protected]
This is an Open Access article distributed under the terms of the Creative Commons Attribution License, which permits unrestricted use, distribution, and reproduction in any medium, provided the original work is properly cited.
Spatio-temporal variability of erosivity in Mato Grosso, Brazil
ARTICLES doi:10.4136/ambi-agua.2276
Received: 02 May 2018; Accepted: 09 Sep. 2018
Luis Augusto Di Loreto Di Raimo1*; Ricardo Santos Silva Amorim1;
Eduardo Guimarães Couto1; Rodolfo Luiz Bezerra Nóbrega2;
Gilmar Nunes Torres1; Edwaldo Dias Bocuti1;
Cristiana Oliveira Silva Almeida3;
Rafael Vinicius Rodrigues4
1Universidade Federal de Mato Grosso (UFMT), Cuiabá, MT, Brasil
Faculdade de Agronomia e Zootecnia (FAAZ). Programa de Pós-Graduação em Agricultura Tropical (PPGAT). E-mail: [email protected], [email protected], [email protected],
[email protected], [email protected]
2University of Reading, Reading, United Kingdom
Department of Geography and Environmental Sciences. E-mail: [email protected]
3Instituto Nacional de Colonização e Reforma Agrária (Incra), Brasília, DF, Brasil
E-mail: [email protected]
4Universidade Federal de Mato Grosso (UFMT), Cuiabá, MT, Brasil
Faculdade de Arquitetura, Engenharia e Tecnologia (FAET). E-mail: [email protected]
*Corresponding author
ABSTRACT
The impact of rainfall on surfaces lacking vegetal cover can dissociate soil particles, thereby initiating the erosion process. This is known as rainfall erosivity and is expressed by the R factor in the Universal Soil Loss Equation. Agricultural areas often show seasonally erosion susceptibility throughout the year due to oscillations of the soil exposure rate and the vegetation change. Considering that approximately 30 million ha of the Mato Grosso State in Brazil is used for agriculture, this study aimed to predict and map the spatial and temporal variability of its territory. We evaluated the monthly (EI30) and annual (R) erosivity for 158 rain
gauge stations and spatialized the values of EI30 and R by the Kriging method. It was observed
that R values ranked as very high in the north, and high and medium-high in the south of Mato Grosso state. The mean value is 8835 MJ mm ha-1 h-1 year-1, considered high. Ninety-one
percent of the annual erosivity was concentrated in the period between October and April, corresponding to the rainy season. The highest R factor values were found in the macro-regions of the northwest, north, west and medium-north of Mato Grosso State.
Keywords: erosion, geostatistics, GIS, soil conservation, USLE.
Variabilidade espacial e temporal da erosividade em Mato Grosso,
Brasil
RESUMO
Rev. Ambient. Água vol. 13 n. 6, e2276 - Taubaté 2018
Solo. Áreas utilizadas com agricultura apresentam grau de susceptibilidade variável ao longo do ano, devido as oscilações nas taxas de exposição do solo e mudança da vegetação. Considerando que aproximadamente 30 milhões de hectares de Mato Grosso, no Brasil, são utilizados com agricultura, objetivou-se com o presente estudo estimar e mapear a variabilidade espacial e temporal da erosividade em seu território. Primeiramente, foram estimados valores de erosividade mensal (EI30) e anual (R) para 158 estações que, posteriormente, foram espacializados pelo método de krigagem. Observou-se que no estado de Mato Grosso predominam valores muito altos de R ao norte e altos e médio-altos ao sul. O valor médio de R é igual à 8835 MJ mm ha-1 h-1 ano-1, considerado alto. Noventa e um porcento do R se concentra
no período entre os meses de outubro e abril, correspondente a estação chuvosa. Os maiores valores de R foram observados nas macrorregiões noroeste, norte, oeste e médio norte do estado de Mato Grosso.
Palavras-chave: erosão, conservação do solo, geoestatística, SIG, USLE.
1. INTRODUCTION
Erosivity determines the ability of rainfall to cause erosion in an unprotected soil, and it is represented in the Universal Soil Loss Equation (USLE) by the R factor (Wischmeier and Smith, 1978). This factor represents the cumulated monthly values of EI30 index, which can be computed as the product of total kinetic rainfall energy (EC) and maximum 30-min precipitation intensity (I30), both obtained by using pluviographic data. Due to the necessity of pluviographic data, which is scarce in Brazil, the determination of EI30 values by the standard
method was considered difficult or unfeasible in many regions for a long time. Many studies addressed this gap by obtaining EI30 values from regression equations that use the rainfall
coefficient (Rc) as an independent variable, which is based purely on pluviometric data (Almeida et al., 2012; Aquino et al., 2012; Oliveira et al., 2012). Certainly, the standard method is the most recommended to obtain erosivity, due to the higher temporal resolution of the pluviographic data. However, in regions with scarcity of pluviographic data, such as Mato Grosso State, one alternative that remains is the use of estimation of erosivity values by regression equations. For some areas of Mato Grosso State, Almeida et al. (2011), Almeida et al. (2012) and Di Raimo et al. (2018) obtained high correlations between erosivity, determined by the standard method, and values of Rc, indicating the high reliability of the estimates.
It is observed that after the simplification of the procedure of obtaining R values several studies were developed in Brazil to identify the spatiotemporal distribution of erosivity in different regions of the country (Silva et al., 2010a; Oliveira et al., 2012; Aquino et al., 2012; Viola et al., 2014; Machado et al., 2014; Waltrick et al., 2015; Almeida and Casaroli, 2016). These studies with a low density of pluviographic stations were only possible due to the implementation of regression equations in pluviometric stations of locations with correlated Rc coefficients, as performed by Oliveira et al. (2012), Waltrick et al. (2015) and Almeida and Casaroli (2016). However, although Mato Grosso State has extensive agricultural activities concentrated between October and March, when 85% of the annual precipitation occurs (Marcuzzo et al., 2011a; 2011b), no research has yet provided the spatial variation of R and spatiotemporal variation of EI30 in this region.
Preliminary studies about erosivity in the Mato Grosso were done by Almeida et al. (2011), Almeida et al. (2012) and Di Raimo et al. (2018), who developed equations to estimate EI30
values for several sites in Mato Grosso. Nevertheless, this punctual information contributes little to regional planning of tillage practices and soil conservation, given that rainfall, EI30 and
Rev. Ambient. Água vol. 13 n. 6, e2276 - Taubaté 2018
demonstrated by Trindade et al. (2016), more specific and detailed studies on smaller areas, such as State-level, are crucial to identifying accurate erosivity information.
Understanding of the spatial and temporal variability of erosivity in Mato Grosso would enable identification of critical areas and periods, in which the rainfall has a comparatively stronger erosive action. Such information is crucial in the planning of tillage practices and soil conservation because the vegetal cover rate of explored areas in Mato Grosso State change throughout the year, especially those cultivated with soybean, corn and cotton. Thus, this study aimed to estimate the rainfall erosivity and its spatial and temporal variability in the entire state of Mato Grosso.
2. MATERIAL AND METHODS
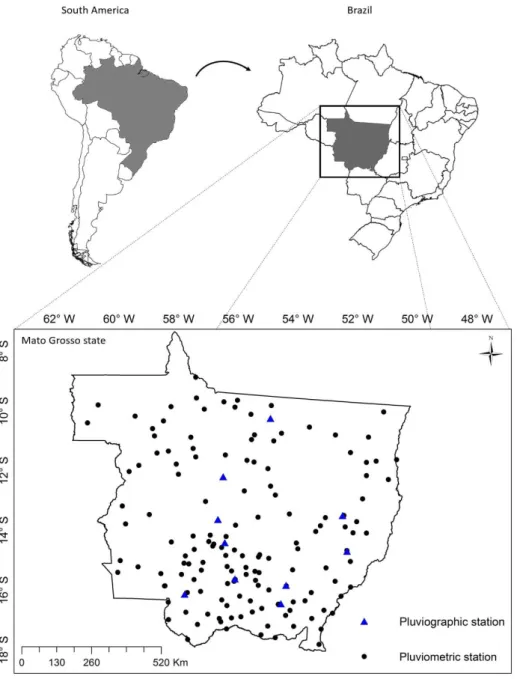
The pluviometric data used to undertake this study were obtained from the Hydrological Information System of the National Water Agency (ANA, 2017). In our study, 148 pluviometric stations with a minimum of 10 years of continuous data were selected (Figure 1).
Rev. Ambient. Água vol. 13 n. 6, e2276 - Taubaté 2018
For the calculation of the EI30 coefficient, equations developed by Almeida (2009) were
used. These equations allowed the estimation of the EI30 value from the rainfall coefficient (Rc)
for 10 pluviographic stations in Mato Grosso State (Table 1, Figure 1). The R values were computed from the sum of the monthly values of the EI30 coefficient. The Rc was derived from
Equation 1 (Renard and Freimund, 1994), where p is the average monthly precipitation (mm), and P is the average annual precipitation (mm).
𝑅𝑐 = 𝑝𝑃2 (1)
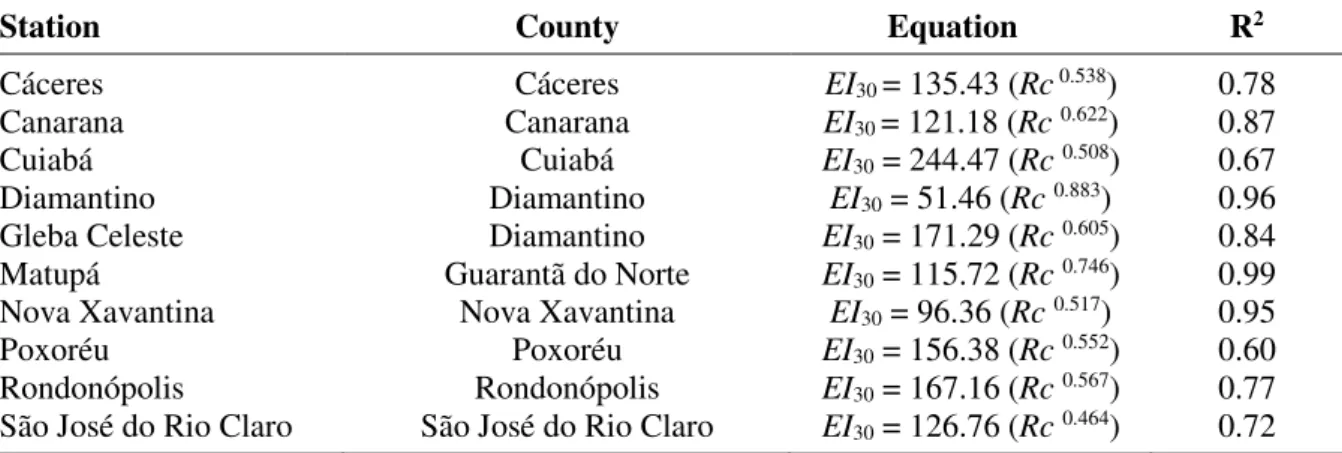
Table 1. Regression equations used to estimate monthly erosivity (EI30) index from the rainfall coefficient (Rc) of the respective stations and municipalities of Mato Grosso State (Almeida 2009).
Station County Equation R2
Cáceres Cáceres EI30 = 135.43 (Rc 0.538) 0.78
Canarana Canarana EI30 = 121.18 (Rc 0.622) 0.87
Cuiabá Cuiabá EI30 = 244.47 (Rc 0.508) 0.67
Diamantino Diamantino EI30 = 51.46 (Rc 0.883) 0.96
Gleba Celeste Diamantino EI30 = 171.29 (Rc 0.605) 0.84 Matupá Guarantã do Norte EI30 = 115.72 (Rc 0.746) 0.99 Nova Xavantina Nova Xavantina EI30 = 96.36 (Rc 0.517) 0.95
Poxoréu Poxoréu EI30 = 156.38 (Rc 0.552) 0.60
Rondonópolis Rondonópolis EI30 = 167.16 (Rc 0.567) 0.77 São José do Rio Claro São José do Rio Claro EI30 = 126.76 (Rc 0.464) 0.72
To estimate the EI30 values, one equation in Table 1 was selected for each of the 148
pluviometric stations. The criteria used to select the equations were adapted from Oliveira et al. (2012). We correlated rainfall characteristics (mean daily precipitation, mean monthly precipitation, mean annual precipitation, precipitated monthly volume, mean monthly Rc and cumulative monthly Rc) of the 10 available pluviographic stations with the same rainfall characteristics of the 148 pluviometric stations. The different locations were considered similar when the linear correlation value was equal to or greater than 0.95. When more than one pluviometric station had a correlation equal or greater than 0.95 with one of the pluviographic stations, the closest among them was considered. Although the standard method for determining erosivity is that proposed by Wischmeier and Smith (1978), regions with scarce rainfall information can be mapped using regression equations to estimate erosivity, as observed in Silva et al. (2010a), Oliveira et al. (2012), Aquino et al. (2012), Viola et al. (2014), Machado et al. (2014), Waltrick et al. (2015) and Almeida and Casaroli (2016).
After defining the equations and the Rc values, their respective EI30 and R values were
estimated. The spatial variability characterization of the EI30 and R values was conducted using
geostatistical techniques. To choose a semivariogram model most appropriate for each situation, the following parameters were analyzed: nugget effect (C0), sill (C0 + C1),
determination coefficient (R2s), spatial dependence degree (SDD) and range.
SDD was calculated using Equation 2 and classified, according to Cambardella et al. (1994), into three categories: ≤25% as strong spatial dependence; 25% ≤ SDD ≤ 75% as
moderate spatial dependence; and ≥75% as weak spatial dependence. To evaluate the
performance of the models in the cross-validation, their respective determination coefficient (R2cv) was analyzed.
𝑆𝐷𝐷 = 𝐶0
Rev. Ambient. Água vol. 13 n. 6, e2276 - Taubaté 2018
After the adjustment of the semivariogram models and the spatial dependence evaluation, the spatial variability of the EI30 and R factor was mapped for Mato Grosso State by the ordinary
Kriging technique (Behera et al., 2018). Such technique was used because it is more reliable than the other methods (Meul and Meirvenne, 2003), including for specialization of erosivity (Mello et al., 2015), and because this is the best predictor to obtain values at unsampled locations and in conditions with sparse and random sampling (Behera et al., 2018). The EI30
and R factor values of the created maps were classified as shown in Table 2.
The R values were correlated with latitude, longitude and elevation, aiming for the best comprehension of erosivity spatial variability within Mato Grosso State. In order to argue about the peculiarities, critical situations and regionally isolated events, the EI30 and R maps were
presented with the identification of macro-regions of agro economic similarity (northwest, north, northeast, middle-north, west, south-center and southeast), as established by the Mato Grosso Institute of Agriculture Economics (IMEA, 2010).
Table 2. The categories for interpretation of the R and EI30 index.
R categories
according to Oliveira et al. (2013)
Erosivity Category R (MJ mm ha-1 h-1 year-1)
Low R ≤ 2452
Medium 2452 < R ≤ 4905
Medium-high 4904 < R ≤ 7357
High 7357 < R ≤ 9810
Very High R > 9810
EI30 categories
according to Carvalho (2008)
Erosivity Category EI30 (MJ mm ha-1 h-1 month-1)
Very Low < 250
Low 250 < R ≤ 500
Medium 500 < R ≤ 750
High 750 < R ≤ 1000
Very High R > 1000
3. RESULTS AND DISCUSSION
The distinctness between dry and wet/rainy season is reflected by the EI30 values for the
different months of the year (Figure 2). The period from October to April corresponds to 91% of the annual erosivity. From May to September, the period with the lowest rainfall rates, the EI30 values contributed to only 9% of the annual erosivity.
Table 3 provides the parameters of the semivariogram used in the spatial dependence analysis and the reliability of the spatial characterization of the EI30 and R factor in Mato Grosso
State. The SDD values indicated that the spatial dependence of the regionalized variables is strong (<25%) for nine months of the year (Cambardella et al., 1994). The semivariograms of May, June and July were the only ones that did not present a strong spatial dependence category, showing SDD values of 32, 40 and 26%, respectively, which are categorized as moderate spatial dependence (Cambardella et al., 1994).
Rev. Ambient. Água vol. 13 n. 6, e2276 - Taubaté 2018
Figure 2. Average monthly and standard deviation of the EI30 and the precipitation values of the 158 studied stations in Mato Grosso State.
In all semivariograms, the best parameters were obtained by using an exponential model. Such results endorse the available literature studies, which show that this model presents the best parameters when compared with other models, such as Gaussian and spherical (Mello et al., 2007; Montebeller et al., 2007; Silva et al., 2010b; Viola et al. 2014).
Table 3. Parameters of the semivariograms used to spatialize EI30 and R values in Mato Grosso State.
Period Parameters
C0 C0 + C1 R2 s R2 cv SDD (%) Range (km)
January 33200 277400 0.96 0.65 12 1798.2
February 49000 409000 0.95 0.60 12 3136.32
March 17000 345000 0.82 0.70 5 2669.76
April 5100 221200 0.77 0.72 3 2987.28
May 4759 14971 0.88 0.49 32 794.88
June 1225 3071 0.65 0.51 40 207.36
July 451 1735 0.95 0.53 26 719.28
August 1829 11339 0.85 0.52 16 2345.76
September 6009 49568 0.84 0.64 12 2796.12
October 16212 239850 0.77 0.66 7 5280.12
November 25565 209359 0.96 0.57 11 5200.2
December 39394 275310 0.87 0.61 14 3165.48
Annual 1456791 10836743 0.82 0.66 13 2222.64
C0: nugget effect; C0 + C1: sill; R2 s: determination coefficient of semivariogram; R2 cv: determination
coefficient of cross-validation; and SDD: spatial degree dependence. All adjusted semivariograms are exponential.
Figure 3 shows the EI30 maps for Mato Grosso, contrasting the seven macro-regions
proposed by the IMEA (2010). Overall, when analyzing the discrepancy in the EI30 values
Rev. Ambient. Água vol. 13 n. 6, e2276 - Taubaté 2018
influence of the Continental Equatorial Mass (CEM), created from the high evapotranspiration of the Amazon forest, which passes over Mato Grosso and provides territory-wide rainfall events.
The CEM expansion starts in August, leaving the Amazon region towards the Mato Grosso State. This movement appears predominantly in the northwest-southeast direction until reaching São Paulo State. From January, the area of influence of this mass begins to fade in the southeast-northwest direction, finally concentrating only in the original region (Amazon region), where it stays and restricts its influence on the pluviometric pattern (Zavattini, 2009; Gan et al., 2009; Marcuzzo et al., 2012).
Rev. Ambient. Água vol. 13 n. 6, e2276 - Taubaté 2018
It is possible to note that Mato Grosso State presents different EI30 patterns in three distinct
periods during the year (Figure 3). The first one is in October and November, related to the beginning of the rainy season, in which the EI30 values increase and range between the low and
very high categories. The second period, from December to March, is associated with the most precipitation in Mato Grosso, in which the EI30 values are predominantly high and very high.
The third period, from April to September, corresponding to the driest season in Mato Grosso, when low EI30 values occur mostly in the low and very low categories.
During the first and second EI30 periods, many agricultural activities occur in Mato Grosso,
causing changes on the soil surface. These are considered the more critical periods, especially from October to February (responsible for 69% of R), when activities such as tilling, sowing and harvesting are concentrated. In the third period, associated with low erosivity, the majority of the soils are covered by the crop canopy, characterizing the least critical phase. However, activities of soil preparation and invasive plant control during the drought season can cause soil loss, due to the first erosive rainfalls that occur in September (Morais et al., 1991).
As shown in this study, Tocantins (Viola et al., 2014) and Goiás (Almeida and Casaroli, 2016) states were also characterized as having high and very high EI30 values between
December and March (Period 2), and low and very low EI30 values from April to September
(Period 3). Such similarity is due to the uniformity of rainfall distribution that is proportionated by the proximity between these states. Such proximity makes the South Atlantic Convergence Zone (SACZ) and the CEM behave with similar intensity above the territory of Mato Grosso, Goiás and Tocantins States (Carvalho and Jones, 2009; Gan et al., 2009).
In the map of R shown in Figure 4, very high category values predominate in the northern region of Mato Grosso and lower R values in the southern region (the same was observed for the EI30 values). However, even the lowest values of R, found in the southern region, are
classified as a medium-high category, according to Oliveira et al. (2013). Considering the entire Mato Grosso State, it includes only the three highest categories of the five proposed by this author.
Rev. Ambient. Água vol. 13 n. 6, e2276 - Taubaté 2018 Panagos et al. (2017) mapped world’s erosivity and obtained values higher than 5200 MJ mm ha-1 h-1 year-1 (medium-high class or upper) for Mato Grosso State territory, highlighted
for regions with values upper than 7400 MJ mm ha-1 h-1 year-1 (high or very high classes) at
north and northwest. Oliveira et al. (2013) and Trindade et al. (2016) mapped the erosivity of Brazil and got values for Mato Grosso always higher than 6000 MJ mm ha-1 h-1 year-1
(medium-high class or upper), with remarkable increase of erosivity to the north and northeast of the state (between 10000 and 14000 MJ mm ha-1 h-1 year-1), that categorizes such as a very high class.
Despite the similar range of erosivity values between the present study and those presented by Oliveira et al. (2013), Trindade et al. (2016) and Panagos et al. (2017), there is a considerable difference in spatial variation of the data, perhaps due to the higher density of information used in this work. Such comparison evidences the importance of erosivity studies that contemplate smaller areas and use greater information density.
The mean R value observed for Mato Grosso was 8835 MJ mm ha-1 h-1 year-1, which is
classified as high according to Oliveira et al. (2013). The high R values obtained for Mato Grosso are typical of tropical regions and corroborate with those obtained in Minas Gerais (Mello et al., 2007), Mato Grosso do Sul (Oliveira et al., 2012), Tocantins (Viola et al., 2014) and Paraná (Waltrick et al., 2015) Brazilian states.
The R values attained in tropical regions are typically higher than those in temperate regions. Examples can be observed in the studies done in Switzerland (Meusburger et al., 2012), Italy (Borrelli et al., 2016), Europe (Ballabio et al., 2017) and the global scale (Panagos et al., 2017). In fact, Panagos et al. (2017) mapped the R for all the world and obtained an average value of 7104 MJ and 3729.3 MJ mm ha-1 h-1 year-1 for the tropical and temperate climate
regions, respectively. The high values in tropical regions result from the great amount of convective rainfall (high intensity and high kinetic energy values of the raindrops) when compared with the characteristics of temperate climates (Oliveira et al., 2013; Machado et al., 2014).
All macro-regions of Mato Grosso State have high R values (Figure 4), which highlight the fact that any agricultural activity developed there requires the adoption of conservation practices. However, the most critical values occur in the northwest, north, west and middle-north macro-regions. The middle-northwest and middle-north macro-regions are dominated by areas with native forests and pastures, which are considered effective cover for soil protection (Da Cunha et al., 2017). Unlike the northwest and north macro-regions, the middle-north and west contain large areas of agricultural land and, thus, they are considered the most critical macro-regions. In the middle-north, specifically, in the municipality of Nova Mutum, Sorriso, Lucas do Rio Verde, Nova Ubiratã, Vera, Santa Carmem, Feliz Natal, Cláudia, Paranatinga and União do Sul, which are responsible for a great part of the grain production in Mato Grosso, the highest EI30
values have been observed. These values occur in January and correspond to approximately 2300 MJ mm ha-1 h-1 month-1 (Figure 3).
The spatialization of R values in Mato Grosso State (Figure 4) shows the variation of values in the northwest-southeast direction, as similarly observed in the EI30 maps (Figure 3).
Such characteristic corroborates the results of Silva (2004) and Trindade et al. (2016) that spatialized the R in Brazil. This variation of values in the northwest-southeast direction occurs due to two factors: the influence of the CEM on the state precipitations (Zavattini, 2009; Gan et al., 2009; Marcuzzo et al., 2012) and the change of vegetation in the northwest-southeast direction, accompanied, in the same direction, by decreasing occurrence of convective rains.
Rev. Ambient. Água vol. 13 n. 6, e2276 - Taubaté 2018
vegetation in the northwest-southeast direction, the frequency of rainfall also reduces and, consequently, the R values decrease.
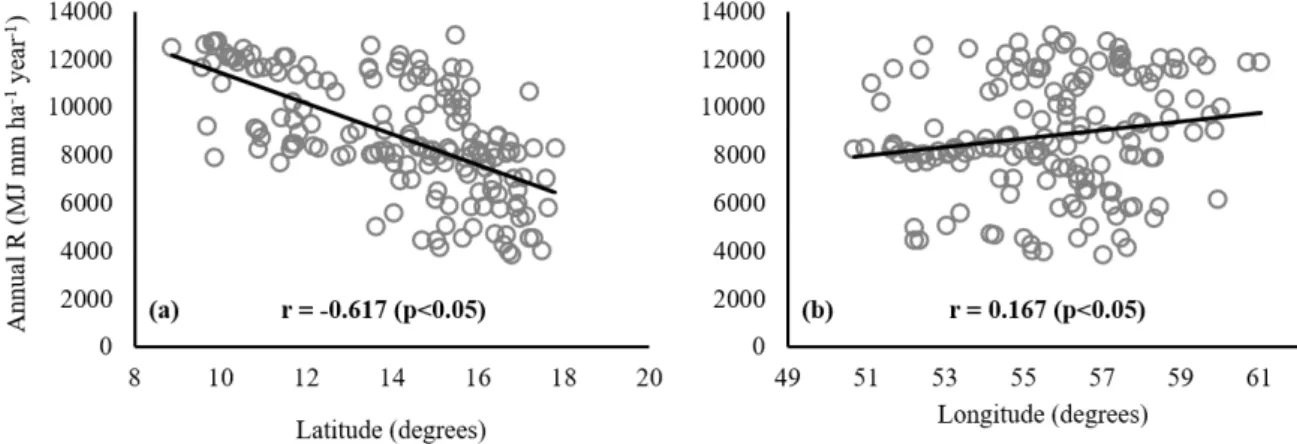
The extension of the CEM and the decrease of the denser vegetation towards northwest-southeast also explain the inverse and significant association between R and latitude (Figure 5a). The greater capacity of latitude to explain the variations of R in Mato Grosso is justified by the large latitudinal variation, in comparison to longitudinal variation, between Mato Grosso and the Amazon region, considering its strong influence on the pluviometric pattern of this state.
Figure 5. Correlation graphs between R and latitude (a) and longitude (b).
Similar results regarding the variation of the R values compared to the geographic coordinate variations in the central-west region of Brazil were obtained by Mello et al. (2013). These authors also associated the correlation between R and latitude with the influence of Amazonian vegetation and its high rainfall rates. In Minas Gerais State, Mello et al. (2007) did not obtain relevant correlation coefficients between the geographic coordinates and the R values. Despite being also influenced by hot and humid air masses from the Amazon (CEM), the R value in Minas Gerais is more influenced by the mountains ranges, which effect orographic rainfalls, than by variations in latitude and longitude.
As shown in the Figures 6a and 6b, the correlation between the R and elevation values is high and significant only up to 300 m. The greater R values in high places come from the greater precipitation in these regions, which result from the higher values of accumulated kinetic energy. These results corroborate those obtained by Moreira et al. (2006), who noted reduced R values with the decrease of elevation in São Paulo State.
Rev. Ambient. Água vol. 13 n. 6, e2276 - Taubaté 2018
4. CONCLUSIONS
The mean R value for Mato Grosso is classified as high and equivalent to 8835 MJ mm ha-1 h-1 year-1.
Ninety-one percent (91%) of the total annual of erosivity occurs from October to April in Mato Grosso State.
The period from October to February is considered the most critical in Mato Grosso State, due to the high values of erosivity (responsible for 69% of R) together with the presence of exposed areas during planting and harvesting times.
In Mato Grosso, R values in the very high category predominate in the northern region and high and very high in the southern region, respectively.
In all macro-regions of Mato Grosso State, there are high R values. However, the most critical values (very high) are observed in the northwest, north, west and middle-north macro-regions.
Besides rainfall, the latitude and elevation, up to 300 m, were the characteristics that best correlated with the spatial variations of R in the Mato Grosso State.
5. REFERENCES
AGÊNCIA NACIONAL DE ÁGUAS – ANA (Brasil). Sistema nacional de informações sobre recursos hídricos. Brasília, 2002.
ALMEIDA, C. O. S. D. Erosividade das chuvas no estado de Mato Grosso. 2009. Dissertação (Mestrado em Ciências Agrárias) – Universidade de Brasília, Brasília, 2009. ALMEIDA, C. O.; AMORIM R. S.; COUTO, E. G.; ELTZ, F. L.; BORGES L. E. Potencial erosivo da chuva de Cuiabá, MT: Distribuição e correlação com a precipitação pluviométrica. Revista Brasileira de Engenharia Agrícola e Ambiental, v. 15, p. 178-184, 2011. http://dx.doi.org/10.1590/S1415-43662011000200011
ALMEIDA, C. O.; AMORIM, R. S.; ELTZ, F. L.; COUTO, E. G.; JORDANI, S. A. Erosividade da chuva em municípios do Mato Grosso: Distribuição sazonal e correlações com dados pluviométricos. Revista Brasileira de Engenharia Agrícola e Ambiental, v. 16, p. 142-152, 2012.
ALMEIDA, R. T. S.; CASAROLI, D. Erosividade média e o calendário agrícola da microrregião sudoeste do estado de Goiás. GeoFocus, Revista Internacional de Ciencia y Tecnología de la Información Geográfica, v. 17, p. 26-43, 2016.
AQUINO, R. F.; SILVA, M. L. N.; FREITAS, D. A. F. D.; CURI, N.; MELLO, C. R. D.; AVANZI, J. C. Spatial variability of the rainfall erosivity in southern region of Minas Gerais State, Brazil. Ciência e Agrotecnologia, v. 36, n. 5, p. 533-542, 2012. http://dx.doi.org/10.1590/S1413-70542012000500006
BALLABIO, C.; BORRELLI, P.; SPINONI, J.; MEUSBURGUER, K.; MICHAELIDES, S.; BEGUERÍA, S. et al. Mapping monthly rainfall erosivity in Europe. Science of the Total
Environment, v. 579, p. 1298-1315, 2017.
https://doi.org/10.1016/j.scitotenv.2016.11.123
Rev. Ambient. Água vol. 13 n. 6, e2276 - Taubaté 2018
BORRELLI, P.; DIODATO, N.; PANAGOS, P. Rainfall erosivity in Italy: a national scale spatio-temporal assessment. International Journal of Digital Earth, v. 9, n. 9, p. 835-850, 2016. https://doi.org/10.1080/17538947.2016.1148203
CAMBARDELLA, C. A.; MOORMAN, T. B.; PARKIN, T. B.; KARLEN, D. L.; NOVAK, J. M.; TURCO, R. F. et al. Field-scale variability of soil properties in central Iowa soils.
Soil science society of America journal, v. 58, n. 5, p. 1501-1511, 1994. http://dx.doi.org/10.2136/sssaj1994.03615995005800050033x
CARVALHO, N. O. Hidrossedimentologia prática. São Paulo: Interciência, 2008.
CARVALHO, L. M. V.; JONES, C. Zona de Convergência do Atlântico Sul. In: CAVALCANTI, I. F. de A. et al. (Orgs.). Tempo e Clima no Brasil. São Paulo: Oficina de Textos, 2009.
DA CUNHA, E. R.; BACANI, V. M.; PANACHUKI, E. Modeling soil erosion using RUSLE and GIS in a watershed occupied by rural settlement in the Brazilian Cerrado. Natural Hazards, v. 85, n. 2, p. 851-868, 2017. https://doi.org/10.1007/s11069-016-2607-3 DI RAIMO, L. A. D. L.; TORRES, G. N.; ALMEIDA, C. O. S.; AMORIM, R. S. S.; COUTO,
E. G.; NOBREGA, R. L. B. Rainfall seasonality and erosivity for two agro-industrial regions in Brazil. Scientia Agrária, v. 19, p. 44-56, 2018.
GAN, M.; RODRIGUES, L. R.; RAO, V. B. Monção na américa do sul. In: CAVALCANTI, I. F. de A. et al. (Orgs.). Tempo e Clima no Brasil. São Paulo: Oficina de Textos, 2009. INSTITUTO MATO-GROSSENSE DE ECONOMIA AGROPECUÁRIA - IMEA, Mapa das
macrorregiões do IMEA. Nov. 2017.
http://www.imea.com.br/upload/publicacoes/arquivos/justificativamapa.pdf. Access: 12 Oct. 2016
MACHADO, D. O.; ALVES-SOBRINHO, T.; RIBEIRO, A. D. S.; IDE, C. N.; OLIVEIRA, P. T. S. Erosividade da chuva para o bioma Pantanal. Engenharia Sanitária e Ambiental, v. 19, n. 2, p. 195-201, 2014. http://dx.doi.org/10.1590/S1413-41522014000200010 MARCUZZO, F.; ROCHA, H. M.; MELO, D. Mapeamento da precipitação pluviométrica no
bioma pantanal do Estado do Mato Grosso. Geoambiente On-line, v. 16, p. 01-19, 2011a. MARCUZZO F.; ROCHA H. M.; MELO D. Mapeamento da precipitação pluviométrica no bioma cerrado do Estado do Mato Grosso. Boletim Goiano de Geografia, v. 31, n. 2, p. 83-97, 2011b.
MARCUZZO, F. F.; MELO, D. C.; COSTA, H. C. Sazonalidade e distribuição espaço-temporal das chuvas no bioma do Cerrado do Estado do Mato Grosso do Sul. Revista Brasileira de Recursos Hídricos, v. 17, n. 1, p. 77-86, 2012.
MELLO, C. R.; SÁ, M. A. C.; CURI, N.; MELLO, J. M.; VIOLA, M. R.; da SILVA, A. M. Erosividade mensal e anual da chuva no Estado de Minas Gerais. Pesquisa Agropecuária Brasileira, v. 42, n. 4, p. 537-545, 2007.
Rev. Ambient. Água vol. 13 n. 6, e2276 - Taubaté 2018
MELLO, C. R.; VIOLA, M. R.; OWENS, P. R.; DE MELLO, J. M; BESKOW, S. Interpolation methods for improving the RUSLE R-factor mapping in Brazil. Journal of Soil and
Water Conservation, v. 70, n. 3, p. 182-197, 2015.
http://dx.doi.org/10.2489/jswc.70.3.182
MEUL, M.; VAN MEIRVENNE, M. Kriging soil texture under different types of nonstationarity. Geoderma, v. 112, p. 217–233, 2003. https://doi.org/10.1016/S0016-7061(02)00308-7
MEUSBURGER, K.; STEEL, A.; PANAGOS, P.; MONTANARELLA, L.; ALEWELL, C. Spatial and temporal variability of rainfall erosivity factor for Switzerland. Hydrology and Earth System Sciences, v. 16, p. 167-177, 2012. https://doi.org/10.5194/hess-16-167-2012
MONTEBELLER, C. A.; CEDDIA, M. B.; CARVALHO, D. F. de; VIEIRA, S. R.; FRANCO, E. Variabilidade espacial do potencial erosivo das chuvas no Estado do Rio de Janeiro.
Engenharia Agrícola, v. 27, n. 2, p. 426-435, 2007. https://doi.org/10.1590/S0100-69162007000300011.
MORAIS, L. D.; SILVA, V. D;, NASCHENVENG, T. D. C.; HARDOIN, P. C.; ALMEIDA, J. D.; WEBER, O. D. S. et al. Índice EI30 e sua relação com o coeficiente de chuva do sudoeste do Mato Grosso. Revista brasileira de ciência do solo, v. 15, n. 3, p. 339-344, 1991.
MOREIRA, M. C.; CECÍLIO, R. A.; PINTO, F. D. A. D. C.; PRUSKI, F. F. Desenvolvimento e análise de uma rede neural artificial para estimativa da erosividade da chuva para o Estado de São Paulo. Revista Brasileira de Ciência do Solo, v. 30, n. 6, p. 1069-1076, 2006.
OLIVEIRA, P. T.; RODRIGUES, D. B.; SOBRINHO, T. A.; CARVALHO, D. F. D.; PANACHUKI, E. Spatial variability of the rainfall erosive potential in the state of Mato Grosso do Sul, Brazil. Engenharia Agrícola, v. 32, n. 1, p. 69-79, 2012. http://dx.doi.org/10.1590/S0100-69162012000100008
OLIVEIRA, P. T. S.; WENDLAND, E.; NEARING, M. A. Rainfall erosivity in Brazil: A review. Catena, v. 100, p. 139-147, 2013. https://doi.org/10.1016/j.catena.2012.08.006 PANAGOS, P.; BORRELLI, P.; MEUSBURGUER, K.; YU, B.; KLIK, A.; LIM, K. J. et al.
Global rainfall erosivity assessment based on high-temporal resolution rainfall records.
Scientific reports, v. 7, n. 1, p. 4175, 2017.
RENARD, K. G.; FREIMUND, J. R. Using monthly precipitation data to estimate the R-factor in the revised USLE. Journal of hydrology, v. 157, n. 1-4, p. 287-306, 1994. https://doi.org/10.1016/0022-1694(94)90110-4
SILVA, A. M. Rainfall erosivity map for Brazil. Catena, v. 57, n. 3, p. 251-259, 2004. https://doi.org/10.1016/j.catena.2003.11.006
SILVA, S.; de SOUZA, G. S.; de OLIVEIRA, R. B. Variabilidade espacial do potencial erosivo das chuvas para o estado do Espírito Santo, Brasil. Irriga, v. 15, n. 3, p. 312, 2010a. https://doi.org/10.15809/irriga.2010v15n3p312
Rev. Ambient. Água vol. 13 n. 6, e2276 - Taubaté 2018
TRINDADE, A. L. F.; de OLIVEIRA, P. T. S.; ANACHE, J. A. A.; WENDLAND, E. Variabilidade espacial da erosividade das chuvas no Brasil. Pesquisa Agropecuária Brasileira, v. 51, n. 12, p. 1918-1928, 2016.
VIOLA, M. R.; AVANZI, J. C.; de MELLO, C. R.; de OLIVEIRA LIMA, S.; ALVES, M. V. G. Distribuição e potencial erosivo das chuvas no Estado do Tocantins. Pesquisa Agropecuária Brasileira, v. 49, n. 2, p. 125-135, 2014.
WALTRICK, P. C.; de MELLO MACHADO, M. A.; DIECKOW, J.; de OLIVEIRA, D. Estimativa da erosividade de chuvas no estado do Paraná pelo método da pluviometria: atualização com dados de 1986 a 2008. Revista Brasileira de Ciência do Solo, v. 39, n. 1, 2015.
WISCHMEIER, W. H.; SMITH, D. D. Predicting rainfall erosion losses: a guide to conservation planning. Washington: United States Department of Agriculture, 1978. 58p. (Agriculture Handbook, 537).