Engineering
ISSN: 1809-4430 (on-line)
_________________________
1 Engº Agrícola, Prof. Doutor, Departamento de Engenharia Agrícola, UFV/Viçosa – MG, Fone: (31) 3899-1912, [email protected] 2 Engª Agrônoma, Doutora em Engenharia Agrícola, Departamento de Engenharia Agrícola, UFV/Viçosa – MG,
3 Engª Agrícola, Mestre em Engenharia Agrícola, Departamento de Engenharia Agrícola, UFV/Viçosa – MG,
4 Engº Agrícola, Departamento de Engenharia Agrícola, UFV/Viçosa – MG, [email protected]
5 Bacharel em Engenharia e Tecnologia, Prof. Doutor, Departamento de Ciências Biológicas e Engenharia Agrícola e Departamento
de Engenharia Civil e Ambiental, Texas A & M University, EUA, [email protected] Recebido pelo Conselho Editorial em: 18-7-2014
LOW-FLOW ESTIMATES IN REGIONS OF EXTRAPOLATION OF THE REGIONALIZATION EQUATIONS: A NEW CONCEPT
Doi:http://dx.doi.org/10.1590/1809-4430-Eng.Agric.v35n5p808-816/2015
FERNANDO F. PRUSKI1, RENATA DEL G. RODRIGUEZ2, ALINE A. NUNES3, PEDRO
L. PRUSKI4, VIJAY P. SINGH5
ABSTRACT: Knowledge of natural water availability, which is characterized by low flows, is essential for planning and management of water resources. One of the most widely used hydrological techniques to determine streamflow is regionalization, but the extrapolation of regionalization equations beyond the limits of sample data is not recommended. This paper proposes a new method for reducing overestimation errors associated with the extrapolation of regionalization equations for low flows. The method is based on the use of a threshold value for the maximum specific low flow discharge estimated at the gauging sites that are used in the regionalization. When a specific low flow, which has been estimated using the regionalization equation, exceeds the threshold value, the low flow can be obtained by multiplying the drainage area by the threshold value. This restriction imposes a physical limit to the low flow, which reduces the error of overestimating flows in regions of extrapolation. A case study was done in the Urucuia river basin, in Brazil, and the results showed the regionalization equation to perform positively in reducing the risk of extrapolation.
KEYWORDS: water availability, planning and management of water resources, water safety
ESTIMATIVA DE VAZÕES MÍNIMAS EM REGIÕES DE EXTRAPOLAÇÃO DAS EQUAÇÕES DE REGIONALIZAÇÃO: UM NOVO CONCEITO
RESUMO: O conhecimento da disponibilidade hídrica natural, caracterizada pelas vazões mínimas, é essencial para o planejamento e a gestão dos recursos hídricos. Uma das técnicas hidrológicas mais utilizadas para estimar a vazão é a regionalização, mas a extrapolação das equações de regionalização para além dos limites dos dados usados para estimar os parâmetros do modelo de regressão não é recomendada. Este trabalho propõe um novo método para minimizar o risco associado à extrapolação das equações de regionalização de vazões mínimas. O método baseia-se na utilização de um valor de limiar, que é a máxima vazão mínima específica estimada nas estações fluviométricas utilizadas no estudo de regionalização. Quando a vazão mínima específica estimada a partir da equação de regionalização excede o valor limiar, a vazão mínima é obtida multiplicando-se a área de drenagem pelo valor limiar. Esta restrição impõe um limite físico para as vazões mínimas, o que reduz o risco de superestimar as vazões nas regiões de extrapolação. Um estudo de caso foi realizado para a bacia Urucuia, no Brasil, e os resultados obtidos mostraram um bom desempenho da equação de regionalização, o que reduz o risco de extrapolação.
INTRODUCTION
Natural water availability can be represented by low flows. Knowledge about these flows is essential for effective shared planning and management of water resources (LI et al., 2010; MASIH et al., 2010; NOVAES et al., 2009). Society requires reliable hydrological forecasts; however, in many cases, observed streamflow data is not available or is insufficient in terms of quality and quantity (ARAI et al., 2012).
Streamflow regionalization is a technique used to satisfy the lack of hydrological information in places with limited levels of data available (MALEKINEZHAD et al., 2011). It is considered an important tool in the management of water resources (CASTIGLIONI et al., 2009; SAMUEL et al., 2011). There is no universal method for a given region or catchment. The common approach remains the testing of various regionalization methods to identify the most appropriate for the region of interest (SAMUEL et al., 2011).
Gauge stations are normally located in places with large drainage areas, a factor that affects streamflow estimation in smaller areas because extrapolating regression equations is something that is not recommended. Nonlinear dynamics and spatial variability in hydrological systems make the formulation of scaling theories difficult; therefore, the development of knowledge related to scale effects, scaling techniques, parameterization and linkages of parameters across scales, is highly relevant (BARRIOS & FRANCÉS, 2012).
NAGHETTINI & PINTO (2007) note that extrapolating regression equations beyond the limits of sample data used to estimate the parameters of the linear regression model is not usually recommended and has been discouraged for two main reasons. Firstly, the confidence interval on the regression line expands as the independent variable values deviate from the average. Second, the relationship between independent and dependent variables may not be linear for the extrapolated values used in the regression.
In a study on flow regionalization performed in the Ijuí River basin, located in the state of Rio Grande do Sul (Brazil), SILVA JÚNIOR et al. (2003) observed that the behavior of extrapolation of long-term average flow for basins with drainage areas smaller than those used to obtain the regionalization models, presented high uncertainty in the variables obtained, with a tendency to overestimate these flows.
TUCCI & MENDES (2006) claim that streamflow regionalization should not be considered as a solution for the extrapolation of scales but rather as an aid to understanding their behavior, data improvement and interpolation of results in hydrologic regions of similar behavior. LI et al. (2009) remark that statistical analysis of regionalization models alone is not enough to estimate streamflow in hydrography. Procedures that can extract more information from available data and provide additional understanding of the physical behavior of the process are important.
PLATE (2002) notes that when a management system no longer meets the needs of the population adequately, it is necessary to develop a new system or to adjust the existing system by adapting it to the new conditions. The use of a physical indicator of hydrological behavior in areas where the extrapolation of the regionalization equation was used, allows safe management of water resources in these areas.
MATERIAL AND METHODS Study area and data descriptions
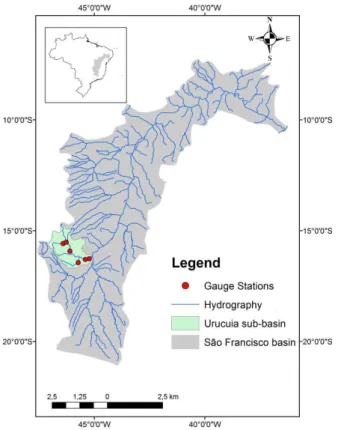
The study was performed within a sub-basin of the São Francisco basin: the Urucuia River sub-basin. A previous study by RODRIGUEZ (2008) identified 15 homogeneous regions in the São Francisco basin. The Urucuia sub-basin was region 9 (Figure 1).
The São Francisco River has 36 major tributaries, out of which only 19 are perennial. The main rivers on the right bank are Pará, Paraopeba, Velhas and Verde Grande and on the left bank are Abaeté, Paracatu, Urucuia, Pandeiros, Carinhanha, Corrente and Grande.
The São Francisco River plays an important role in the development of several states that it crosses. Therefore, knowledge about its hydrological behavior is extremely important to support the planning and management of this water resource. A large volume of water that crosses the semi-arid region, which occupies 57% of the basin area, also characterizes the São Francisco River.
The Urucuia basin, with a drainage area of 25,406 km², is responsible for approximately 9.3% of the total area of the São Francisco River Basin. It is located in Northwestern Minas Gerais State, where the municipalities of Unaí and Januária contain important areas of irrigated agriculture. The climate in the basin is semi-humid with a dry season that lasts for four to five months a year. According to Köppen (1931), climate is classified as Aw, tropical wet and dry.
This study uses six streamflow gauge stations (Figure 1), which are part of the hydrometeorological network of the Hydrological Information System (Hidroweb) of the Brazilian National Water Agency (ANA). Only these six streamflow gauge stations complied with the criteria of providing at least 20 years of data and the period analyzed was from 1979 to 2002.
FIGURE 1. Sites of the streamflow gauge stations analyzed in this study, which are located in Urucuia basin.
Streamflow regionalization
m d
c
bC D ...M
B a
Q (1) where,
Q - streamflow of interest, m3 s-1;
B, C,…, M - topological and climatic characteristics used as independent variables, and
a, b, c,…, m – constants, dimensionless.
The dependent variable used in the streamflow regionalization was the permanent streamflow,
where “permanent” means “present 95% of the time” (Q95).
The independent variables tested represent the physical and climatic characteristics of the basin (OLIVEIRA et al., 2013). Similar to PRUSKI et al., 2011, one variable tested is the drainage area (A) which represents the physical characteristic of the basin. Aside from this, a single variable was tested that represented the physical and climatic characteristics of the basin (drainage area and precipitation), defined by PRUSKI et al. (2013), as
k A P
Peq (2)
where,
Peq - streamflow equivalent to the annual rainfall volume, m3 s-1; P - annual average rainfall in the drainage area considered, mm year-1; A - drainage area, km2, and
k - conversion factor, which equals 31,536.
The spatial distribution of the regionalized hydrological variables was performed in the hydrographic base developed by the National Water Agency (ANA) for Brazil, at a scale of 1:1,000,000.
The root mean squared error (equation 4) estimated by the square-root mean of the square error (equation 3); the coefficient of determination (equation 5); and the relative error (equation 6) were used to select the regionalization equation that led to the best statistical adjustment.
2
obs
reg Q )
Q ( n 1 MSE (3) MSE
RMSE (4)
TSS SSR R2
(5) 100 Q Q Q RE obs reg obs (6) where,
MSE - mean squared error;
RMSE - root mean squared error, m3 s-1;
R2 - coefficient of determination, which expresses the proportion of the variation in the dependent variable that is explained by the independent variables, dimensionless;
SSR - the sum of squares of the regression residuals;
TSS - the total sum of squares, equal to the sum of the differences between the observed streamflow values and the mean of those values plus SSR, and
RE - relative error, %.
Proposal to minimize the use of extrapolation of regionalization equations
Possible errors caused by the extrapolation of the regionalization equation include the confidence interval on the regression line expanding as the independent variable values deviate from the average and the relationship between independent and dependent variables not being linear for the extrapolated values used in the regression (NAGHETTINI & PINTO, 2007). After the selection of a regionalization model, the risks related with a possible overestimation of the values obtained with the regression model are reduced by the use of a threshold value for the specific low flow discharge. The threshold value is defined as the highest value of specific low flow discharge obtained from several stream gauge stations in the hydrologically homogenous region considered. Thus, if the specific low flow discharge estimated in the section of hydrography is higher than the threshold value, the low flow (Q95_adj) must be estimated as
(7) where,
Q95_adj -stands for the low flow (Q95) adjusted according to the threshold specific low flow discharge value, m3 s-1, and
q95_thr - highest value of specific low flow discharge (q95) obtained from several stream gauge stations in the hydrologically homogenous region considered, Ls-1km-2.
RESULTS AND DISCUSSION
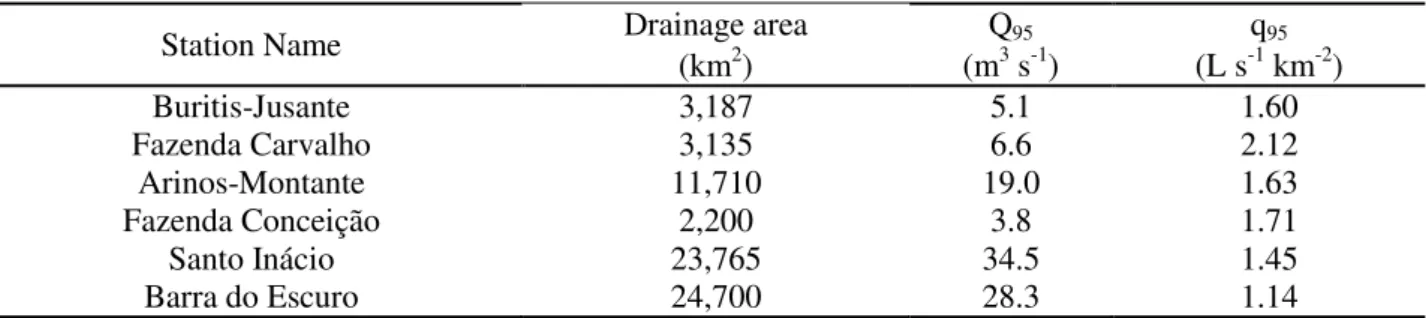
Table 1 shows values of drainage area, Q95 and q95 corresponding to the six gauge stations considered in this study, where q95 varied from 1.14 to 2.12 Ls-1km-2.
TABLE 1. Station name, drainage area, Q95 and specific Q95 (q95) for gauge stations in the Urucuia Basin
Station Name Drainage area Q95 q95
(km2) (m3 s-1) (L s-1 km-2)
Buritis-Jusante 3,187 5.1 1.60
Fazenda Carvalho 3,135 6.6 2.12
Arinos-Montante 11,710 19.0 1.63
Fazenda Conceição 2,200 3.8 1.71
Santo Inácio 23,765 34.5 1.45
Barra do Escuro 24,700 28.3 1.14
The independent variables “A” and “Peq” were tested and the equation selected to estimate Q95 was
0.860 95 0.00549A
Consequently, the specific low flow discharge was expressed as
(9) For the equation selected (equation 8), relative errors were less than 17%; the determination coefficient was 0.98 and the root mean squared error was 0.15.
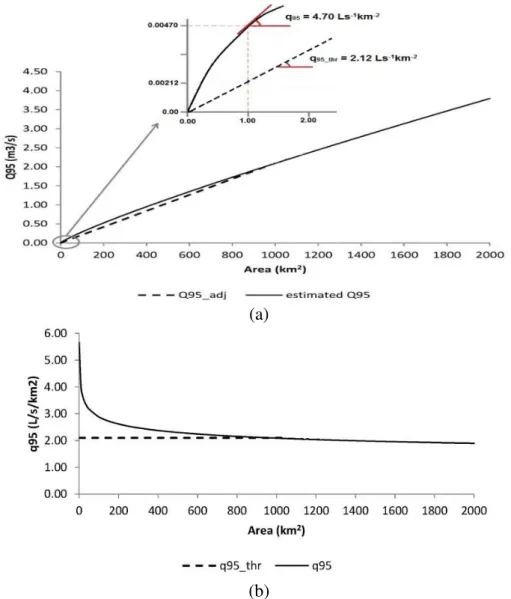
Figure 2a presents Q95 estimated by the regionalization equation 8 and the estimated low flow adjusted by the method proposed (Q95_adj) to minimize errors associated with the use of extrapolation of the regionalization equation. Figure 2b presents q95 estimated based on the regionalization equation and the threshold value (q95_thr), which is equal to 2.12 Ls-1 km-2.
(a)
(b)
FIGURE 2. Q95 obtained by regionalization equation 8 and that obtained by imposing the threshold value according to equation 7 (Q95_adj) (a); Specific low flow discharge estimated by regionalization (q95) and the threshold value (q95_thr) (b).
twice the maximum observed value, a fact that confirms the risk associated with extrapolation of regionalization equations.
The rates of decay of the specific low flow discharge were much more pronounced for small drainage areas and became smoother as the drainage area increased. The values equal to the specific low flow discharge threshold were found only in drainage areas of 1,000km2.
The overestimation of low flows, which represent the natural availability of surface water resources, create a false expectation of the actual availability of water resources in hydrography. Consequently, the demand for withdrawals cannot be met under real conditions. To minimize this risk, the proposed method adjusts the low flows using a threshold value that corresponds to the specific low flow discharge observed at the gauge stations (dashed line on Figure 2b); thus, Q95 is now estimated as
A 2.12
Q95_adj (10)
Considering several segments of the Urucuia basin’s hydrography, it can be observed (Figure
3a) that q95 ranges from 1.33 Ls-1 km-2 to 5.66 Ls-1 km-2 and that a significant part of the hydrography has q95 values above 2.12 Ls-1 km-2 (q95_thr), where the adjustment was necessary.
Figure 3b presents the segments of the Urucuia basin´s hydrography where it was necessary to adjust Q95, in red. It was necessary to adjust streamflow in a large portion of the basin’s hydrography. For the Urucuia basin, 88% (22,539km2) of the total area was adjusted based on q95_thr, which showed the relevance of using the method.
Pruski et al. (2012) evidenced similar results in a study performed in the Pará river basin (a sub-basin of São Francisco basin). Authors verified that about 85% of the hydrography was part of the extrapolation region, considering the regionalized Q7,10 and drainage area as an explanatory variable and in addition, values of regionalized specific low flow discharge were two times greater than observed low flow discharge.
Rodriguez (2008), in a study of the São Francisco basin, verified that upstream Três Marias (Region 14, considering the 15 homogeneous regions identified) q95, estimated based on regionalized Q95, near headwaters, were superior to the largest observed Q95. The best-fit value was 28% higher than the highest value of observed specific low flow.
(a) (b)
FIGURE 3. q95 (Ls-1km-2) (a), and segments of the Urucuia basin (outlined in red) where it was necessary to adjust Q95 based on the specific low flow discharge used as at threshold to extrapolate the regionalization equation (b).
In consideration of efforts to improve the use of water for social and economic development and to minimize environmental impacts, the use of overestimated values for water availability will obviously create false expectations concerning the amount of water available. Therefore, reliable estimation of water availability is essential for proper water resource planning and management.
CONCLUSIONS
Extrapolating regression equations beyond the limits of sample data used to estimate the parameters of the regression model is something that is not recommended and this restricts the use of regionalization equations to drainage areas smaller than the smallest drainage area among the gauge stations used in the regionalization study.
The use of a proposed threshold value has imposed a physical limit to low flows, reducing the possibility of overestimating flows in the drainage areas corresponding to the regions of extrapolation.
This method has allowed the use of regionalization equations to be expanded to hydrographic sections where the use of these equations had not previously been recommended, without compromising the security of the available water supply or environmental sustainability.
ACKNOWLEDGMENTS
The authors want to thank the National Council for Technological Development (CNPq) and the Research Support Foundation of Minas Gerais State (FAPEMIG) for financial support.
REFERENCES
ARAI, F.K.; PEREIRA, S.B.; GONÇALVES, G.G.G. Characterization of water availability in a hydrographic basin. Engenharia Agrícola, Jaboticabal, v. 32, n.3, p. 591-601, 2012.
CASTIGLIONI, S.; CASTELLARIN, A.; MONTANARI, A. Prediction of low-flow indices in ungauged basins through physiographical space-based interpolation. Journal of Hydrology, Amsterdam, v. 378, p. 272-280, 2009.
KÖPPEN, W. Grundriss der Klimakunde. Berlin: Walter de Gruyter, 1931. 390p.
LI, Z. ; LIU, W. ; ZHANG, X. ; ZHENG, F. Impacts of land use change and climate variability on hydrology in an agricultural catchment on the Loess Plateau of China. Journal of Hydrology, Amsterdam, v. 377, p. 35- 42, 2009.
LI, M.; SHAO, Q.; ZHANG, L.; CHIEW, F.H.S. A new regionalization approach and its
application to predict flow duration curve in ungauged basins. Journal of Hydrology, Amsterdam, v. 389, p. 137-145, 2010.
MALEKINEZHAD, H.; NACHTNEBEL, H. P.; Klik, A. Comparing the index-flood and multiple-regression methods using L-moments. Physics and Chemistry of the Earth, Oxford, v. 36, p. 54-60, 2011.
MASIH, I.; UHLENBROOK, S.; MASKEY, S.; AHMAD, M.D. Regionalization of a conceptual rainfall–runoff model based on similarity of the flow duration curve: A case study from the semi-arid Karkheh basin, Iran. Journal of Hydrology, Amsterdam, v. 391, p. 188-201, 2010.
NAGHETTINI, M.; PINTO, E.J.A. Hidrologia estatística. Belo Horizonte: CPRM, 2007. 552p. NOVAES, L.F.; PRUSKI,F.F.; QUEIROZ, D.O. de; RODRIGUEZ, R. del G.; SILVA, D.D.; RAMOS, M.M. Modelo para a quantificação da disponibilidade hídrica: parte 1 – obtenção da equação de recessão. Revista Brasileira de Recursos Hídricos, Porto Alegre, v. 14, n.1, p.15-26, 2009.
OLIVEIRA, J.R.; PRUSKI, F.F.; NUNES, A.A. Otimização do aproveitamento da disponibilidade de águas superficiais na bacia do ribeirão Entre Ribeiros. Revista Brasileira de Recursos
Hídricos, Porto Alegre, v. 18, n. 4, p. 157-172, 2013.
PLATE, E. J. Flood risk and flood management. Journal of Hydrology, Amsterdam, v.267, p. 2-11, 2002.
PRUSKI, F.F.; NUNES, A.A.; PRUSKI, P.L.; RODRIGUEZ, R.G. Improved regionalization of streamflow by use of the streamflow equivalent of precipitation as an explanatory variable. Journal of Hydrology, Amsterdam, v. 476, p. 52-71, 2013.
PRUSKI, F.F.; NUNES, A.A.; REGO, F.S.; SOUZA, M.F. Extrapolação de equações de regionalização de vazões mínimas: Alternativas para atenuar os riscos. Water Resources and Irrigation Management, Cruz das Almas, v. 1, p. 51-59, 2012.
PRUSKI, F.F.; RODRIGUEZ, R. del G.; SOUZA, J.F.; DA SILVA, B.M.B.; SARAIVA, I.S. Conhecimento da disponibilidade hídrica natural para a gestão dos recursos hídricos. Engenharia Agrícola, Jaboticabal, v. 31, n.1, p. 67-77, 2011.
RODRIGUEZ, R. del G. Proposta conceitual para a regionalização de vazões. 2008. 254f. Tese (Doutorado) - Universidade Federal de Viçosa, Viçosa, 2008. 254p.
SAMUEL, J.; COULIBALY, P.; METCALFE, R. A. Estimation of continuous streamflow in Ontario ungauged basins: comparison of regionalization methods. Journal of Hydrologic Engineering, New York, v.16, n.5, p. 447-459, 2011.
SILVA JÚNIOR, O.B.; BUENO, E.O.; TUCCI, C.E.M.; CASTRO, N.M.R. Extrapolação espacial na regionalização da vazão. Revista Brasileira de Recursos Hídricos, Porto Alegre, v. 8, n. 1, p. 21-37, 2003.