ISSN 2179-8087 (online)
Original Article
Forest Management
Creative Commons License. All the contents of this journal, except where otherwise noted, is licensed under a Creative Commons Attribution License.
Remote Sensing and Geostatistics Applied to Post-stratification
of Eucalyptus Stands
Ivy Mayara Sanches de Oliveira
1, Eduarda Martiniano de Oliveira Silveira
1,
Lara de Paiva
1, Fausto Weimar Acerbi Júnior
1, José Marcio de Mello
11Universidade Federal de Lavras – UFLA, Lavras/MG, Brasil
ABSTRACT
Brazil has many rural properties with unmanaged eucalyptus stands. These plantations are heterogeneous, presenting different tree sizes, advanced ages, and large wood volumes that can be quantified using forest inventories. The prediction error of dendrometric variables, mainly in highly heterogeneous areas, can be associated with inadequate forest inventory procedures, i.e. low intensity of sampling plots. However, a larger number of plots increases the cost of inventorying. Therefore, a promising alternative is forest stratification into homogeneous sub areas. Accordingly, the aim of this study was to analyze the reduction of volume estimate errors by post-stratification procedures. We used the normalized difference vegetation index (NDVI) derived from Landsat 8 and Spot 6 images and geostatistical techniques, such as kriging the volume (V) and diameter at breast height (DBH). The most precise method to estimate the total volume was the stratified random sampling (STS), based on geostatistical interpolation, using the DBH (error lower than 10%).
1. INTRODUCTION
In Brazil, unmanaged eucalyptus plantations are commonly found on rural properties, as well as in abandoned plantations and former experimental areas of universities and corporations. These plantations are mostly used as a wood stock and are characterized by trees of different sizes, advanced ages, and large wood volumes (Oliveira et al., 2015).
Traditionally, volume is quantified by forest inventories, which estimate the characteristic of interest using random sampling. The processing of forest inventories is performed by classical statistical procedures, which consider that the spatial variations of a given characteristic are independent. Surveys of highly heterogeneous forests demand a large number of samples to obtain greater precision, which makes this procedure costly. Moreover, the survey may not achieve adequate precision due to high forest variability. Thus, the use of procedures that consider some level of stratification is recommended in such situations.
According to Kanegae et al. (2006), stratification influences the cost and precision of the inventory since it allows us to control forest variability. In this case, the forest is divided into homogeneous units, according to a common characteristic. Stratification is a sampling procedure that mitigates the effect of forest variability and increases inventory precision. Mello & Scolforo (2000) compared several sampling procedures and concluded that the ones based on stratification were more precise than those based on randomization. However, the definition of the strata is a difficult task due to little forest information prior to the inventory. Therefore, the use of geotechnology can be an alternative for both pre- and post-stratification (Alvarenga, 2012).
The introduction of new techniques for forest post-stratification is even more significant in poorly managed areas and plantations, resulting in a heterogeneous forest. This fact hinders the allocation of an adequate number of plots in the field, and consequently influences the reliability of the results. Several researchers have investigated the spatial dependence of biometric variables in eucalyptus plantations of up to 7 years of age that received adequate management. Little is known about the spatial behavior of these characteristics in older plantations without adequate management.
The evaluation of forest resources began in the 50’s using remote sensing techniques. Satellite images are an essential component in the development of new tools for forest management, as they can be used to obtain forest characteristics. Vegetation indices have been used to correlate the spectral information derived from the images as forest biophysical indicators. In this context, the Normalized Difference Vegetation Index (NDVI) is the most commonly used. The NDVI is based on the high absorption of electromagnetic radiation in the red region (650-690 nm) due to chlorophyll, and maximum reflectance in the near infrared region (NIR; 725-900 nm), controlled by the internal leaf structures. Their values vary from -0 to 1; the closer to 1, the denser the vegetation cover. Values closer to 0 represent non-vegetated surfaces (Rouse et al., 1973). Several studies have used images to estimate variables, such as biomass (Martins et al., 2011), percentage of canopy cover (Carreiras et al., 2006), diameter at breast height (Linhares & Ponzoni, 2001), height (Accioly et al., 2002), and basal area (Ghahramany et al., 2012), among others.
The use of geostatistical interpolation techniques is also a way to obtain information about important forest variables (Leal, 2013). Reis (2015) evaluated the potential of geostatistical interpolators in eucalyptus stand stratification and obtained greater precision for volume estimates. Such techniques provide tools to understand an apparent data randomness, but with possible spatial structuring. The geostatistical interpolator can effectively predict dendrometric variables without increasing the cost when compared with traditional methods (Mello, 2004).
Thus, the objective of this study was to analyze the precision, i.e., the error reduction of the volumetric estimate, by means of post-stratification procedures. We used the NDVI values derived from satellite images (SPOT6 and Landsat 8) and the kriging of the diameter at breast height (DBH) and volume (V) in heterogeneous and unmanaged eucalyptus plantations.
2. MATERIAL AND METHODS
2.1. Characterization of the study area
plantations. The stands have not been managed in years, with several species and ages, in a sloping area. For these reasons, the eucalyptus stands present great heterogeneity regarding the dendrometric variables, such as diameter and tree height.
2.2. Data base
The company IMA Florestal collected the forest inventory data in September and October 2014. The forest inventory procedures i.e. intensity and sample design, as well as the field measurements and models used to estimate the dendrometric variables followed the operational criteria adopted by the company. The forest inventory was conducted by a systematic sampling design (Cochran, 1977), where sample units were allocated to cover the spatial variability of the characteristic of interest in the entire area. According to Mello (2004), this procedure is the most frequently used by reforestation corporations, differing from a conventional sampling design procedure since the distance between plots is not constant. The sampling intensity was the same that forest companies adopted, i.e. one plot per ten hectares (1/10 ha). In the whole area, 36 circular plots with a fixed area of 400 m2 were
allocated and georeferenced.
All trees with diameter at breast height (DBH) greater than 5 cm were measured using a measuring tape and thus, the arithmetic mean diameter was calculated for
each plot. Part of the trees had their total height (H) measured (the ten trees of the central row of the plot) using a digital clinometer. A hypsometric equation was applied, using the modified Scolforo model, since not all trees were measured (Equation 1):
( ) * ( ) *
1 1.11226 0.716408 4.70065
= + −
Ln H Ln Hmax
DBH (1)
(R2=92.24%)
where:
H= total height; Hmax = maximum height measured in the plot (m)
DBH = diameter at breast height (at 1.30m from the ground).
A sample of 135 trees, distributed in five diameter classes, were scaled using the Smalian method. The volume was parameterized using the Hradetzky polynomial equation (Equation 2):
0.005 0.8
* *
3 5
*
i Hi Hi
1 2.0506 11.1603 0.380612
DBH H H
Hi Hi 0.644755 0.276857 H H = − − − + d (2)
(R2=96.0%)
where:
di = diameter measured at height Hi;
DAP = diameter at breast height (1.30 m from the ground);
Hi = heights measured along the log and H = total tree height.
The wood volume per plot was estimated by the sum of the individual values of the trees recorded in each plot.
2.3 Geostatistical analyses
We performed an exploratory analysis of the dendrometric variables (DBH and volume), as a first step for the geostatistical approach. This analysis consists of verifying the existence of a trend and discrepant data that can significantly affect the behavior of the experimental semivariogram.
on the values of surrounding sampled locations, considering the structure of spatial dependence. Kriging interpolation was performed using the geostatistical software package ArcGis 10.1 with Geostatistical Analyst. The maps generated were used to define the strata in the post-stratification forest inventory. We adopted four strata, as described in Kanegae et al. (2006). In their study, the authors evaluated five different quantities of strata generated by the kriging and Inverse Distance Weighting (IDW) methods and found that four is the optimal number of strata to work with spatial interpolators since it is an operational and efficient value for variability control.
2.4. Stratification of NDVI data
We used Landsat 8 and Spot 6 images to calculate the NDVI. The Landsat 8 satellite has a coverage range of 170 km, and its sensor (OLI) operates in the visible and near infrared bands, with spatial resolution of 30 m. Conversely, the Spot 6 satellite has a 60 km coverage range, and its sensor (MS) operates in the visible and near infrared bands, with a spatial resolution of 6 m. The images were taken on 08/15/2014 and 09/07/2014 by Landsat 8 and Spot 6 sensors, respectively. Landsat 8 was chosen since the images are the most commonly used to estimate biophysical vegetation parameters and are freely available, and the Spot 6 images present high spatial resolution.
The images were geometrically and atmospherically (surface reflectance) corrected (high level product). The NDVI indices were obtained using the Envi 5.0 software, as described by Rouse et al. (1973). The NDVI values were stratified into four distinct classes with equal intervals using the ArcGis 10.1 software. The choice of the number of strata considered the subsequent comparison with the kriging method.
2.5. Forest inventory processing
The target dendrometric variable was the total volume per plot, thus it was estimated in the following three ways: (i) considering all sample units within a non-stratified forest, using Simple Random Sampling (SRS) estimators; (ii) considering the forest stratification by the geostatistical interpolator for DBH and volume, where the processing was performed based on the Stratified Random Sampling (STS) estimators; and (iii) considering the stratification of the forest by the
NDVI values of the Spot 6 and Landsat 8 images, where the processing was performed based on the Stratified Random Sampling (STS) estimators.
Subsequently, the mean estimates of the inventory statistics were obtained for each stratum. The precision of the procedures was evaluated by the sampling error (%).
3. RESULTS AND DISCUSSION
Based on the values of total volume per plot, the forest inventory was processed using the simple random sample estimators. Table 1 indicates that the inventory error was greater than 20%.
For the conditions of this study, errors of this magnitude are explained due to the forest heterogeneity. Therefore, alternatives that reduce the error must be developed. Increasing the number of plots is an option; however, it also increases the cost of the inventory. A promising alternative would be forest stratification in homogeneous subareas. This study sought to perform a post-stratification based on the diameter at breast height (DBH) and volume (V) per plot, using the kriging interpolator. Figure 2 shows the graphs generated in the exploratory analysis of the studied variables.
The DBH analysis and volume data presented no trend in relation to the north-south and east-west directions and also the box plot graph confirmed data discrepancy (outliers). This analysis is important since such data considerably affects semivariogram behavior, especially the initial part of the semivariogram. Only the volume presented two values that could be considered outliers; however, these values were not removed as they did not affect the geostatistical evaluations.
According to the semivariogram analysis, the characteristics evaluated in this study are spatially
Table 1. Statistics based on simple random sampling.
STATISTICS VALUE
Mean (m3/plot) 156
Standard deviation (m3/plot) 131.7
Coef. of variation (%) 84.4 Mean standard deviation (m3/plot) 21.9
Inventory error (m3/plot) 37.23
Error (%) 23.7
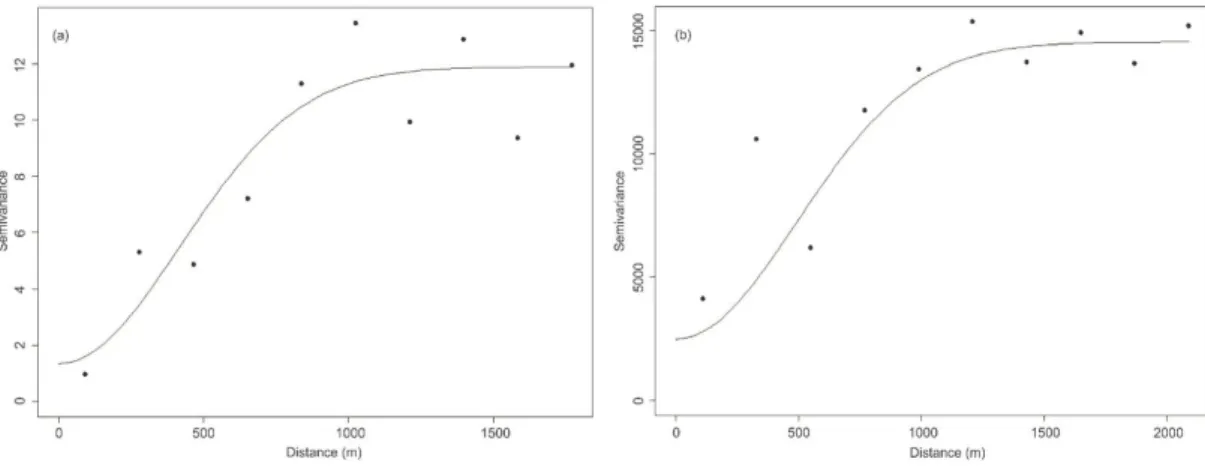
structured, i.e., there is a structural function modelled by semivariance behavior. Figure 3 shows the experimental semivariogram and the models fitted for mean DBH per plot and volume per plot. A spatially correlated structure was detected for the two characteristics. The Gaussian model was the appropriate theoretical model for both variables. Table 2 presents the model parameters.
According to the classification proposed by Biondi et al. (1994), both variables presented high spatial dependence (>75%). Assis et al. (2009) state that projects with an intermediate to high degree of dependence can generate maps that correspond to an unbiased post-stratification, without trend, i.e., more precise in the spatial detail of the dendrometric variable of interest. The cause of this high spatial dependence value is the low nugget effect value, which is the part of the error not explained by the model. Therefore,
the estimates of the studied variables will be more precise by applying this model. Figure 3 shows that the semivariogram for DBH presented lower nugget effect, which implies more precise estimates in the kriging process. The magnitude of the nugget effect is related to small-scale sampling and measurement errors. For being an easily obtainable characteristic, DBH presents lower measurement errors.
Figure 2. Exploratory analysis of the variables (A) DBH and (B) Volume.
Figure 3. (a) Fitted semivariogram for DBH; (b) Fitted semivariogram for Volume.
Table 2. Estimate of the parameter nugget effect (τ2),
structured variation (σ2), sill (τ2 + σ2
), range (ϕ), and relative variation structured / spatial dependence (DE%) of the gaussian model fitted to the semivariogram for each dendrometric variable.
Dendrometric
variables τ2
2
σ τ2 + σ2 ϕ (m)
DE (%)
The presence of the spatial dependence structure in the evaluated data allowed generating maps that correspond to a post-stratification of the study area. Figures 4 and 5 present untrended and unbiased maps that correspond to this post-stratification based on DBH and volume.
The number of plots per stratum varies according to the spatial structuring of each biometric variable. The more structured the variable, the better the stratification. From the strata presented in Figures 4 and 5, the forest inventory was processed using the stratified random sampling estimators generated by the geostatistical
interpolation. The choice of plots per stratum considered their distribution within the strata generated by the kriging of the DBH and volume variables.
Stratifications based on NDVI were performed in two different spatial resolutions: 30 m (available for free) and 6 m resolution. Based on the classes presented in this study, the maps in Figures 6 and 7 correspond to the stratification for each image.
Both Spot and Landsat images, (strata 1 and 4), i.e., those with the lowest and highest NDVI values, respectively, correspond to smaller portions of the area within the forest. From the strata presented in
Figures 6 and 7, forest inventory was processed using the stratified random sampling estimators generated by the NDVI intervals for each image.
3.1. Comparison between methods
Table 3 shows the main statistics of the inventory processing for volume for each stratification and the sample intensity required to obtain an error of (at most) 10% in relation to the mean. This sample intensity makes it possible to infer about the profit with the inventory and to achieve precision at a lower cost. If the inventory
were only based on simple random sampling, it would require four times as many plots in comparison with kriging of DBH, which is a marked difference.
Figure 6. Results of NDVI stratification by Spot 6 image.
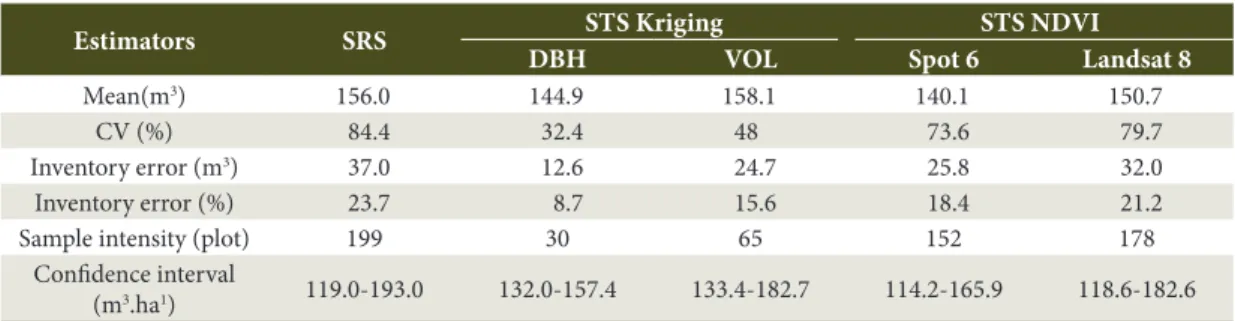
Table 3. Comparison between the different stratifications for volume.
Estimators SRS STS Kriging STS NDVI
DBH VOL Spot 6 Landsat 8
Mean(m3) 156.0 144.9 158.1 140.1 150.7
CV (%) 84.4 32.4 48 73.6 79.7
Inventory error (m3) 37.0 12.6 24.7 25.8 32.0
Inventory error (%) 23.7 8.7 15.6 18.4 21.2
Sample intensity (plot) 199 30 65 152 178
Confidence interval
Kriging provides predictions with minimized variances making the stratification based on DBH the most precise method. In addition, it was the only procedure that presented errors lower than the maximum of 10%. This fact can be explained since DBH is a direct and easy measure and therefore less subject to field errors. Additionally, due to the greater spatial structure, kriging of DBH captured the variability of the area, and thus generated better-defined strata (Kanegae et al., 2006).
only one that allows a pre-stratification of the area, enabling a better planning of the field campaign and inventory cost estimates. Silva et al. (2014) state that the use of remote sensing images for stratification prior to field surveying provides a better spatial distribution of plots, avoiding the occurrence of strata without adequate sampling.
The Spot 6 images were more precise than those of Landsat 8. This difference is explained by the higher spatial resolution of the former (6 m). The images of the Spot 6 sensor, despite being the most recommendable due to their greater precision, are not available for free as the Landsat 8 images are. Therefore, this should be taken into account when choosing the best method, which varies according to the purpose of the inventory.
Stratification based on the geostatistical interpolator contributed to a great reduction in the sampling error. However, only the kriging of DBH proved to be efficient since it captured the spatial distribution of the strata and increased the precision of the forest inventory, consequently generating a significant reduction in the estimates error. The sample intensity value (Table 3) presents the ideal number of plots required for each case in order to reach the acceptable error of 10%.
Table 3 shows that future samplings of the kriging of DBH can use a smaller number of plots to obtain a desirable error level. This will lead to cost reductions since it is directly influenced by the measurement time. Kanegae et al. (2006) reported that the use of the kriging interpolator in the definition of strata reduced the forest inventory error by up to 32%, corroborating the results observed in this study.
According to Silva et al. (2014) there is a considerable trend in the Brazilian forestry sector to seek cost reductions, and one of the alternatives to this end is the use of geostatistical techniques for stratification, such as kriging.
4. CONCLUSIONS
The precision of the estimates with post-stratification kriging of DBH was superior to that provided by the other methods evaluated due to lower estimate errors in the forest inventory (12.6 m3 or 8.7%). The mean
DBH per plot is easily measurable and consequently has a low cost, besides having a high correlation with the volume. Therefore, it can be recommended for
post stratification in unmanaged eucalyptus forests with high heterogeneity.
STS via the Landsat 8 image reduced the error by 2.5%, while STS via the Spot 6 image reduced the volumetric estimate error by 5.3%. Despite the stratification based on the NDVI values not presenting better precision of volumetric estimate, the method has the advantage of being the only one, among those evaluated in this research, to allow pre-stratification of the area.
SUBMISSION STATUS
Received: 16 june, 2017 Accepted: 13 sep., 2017
CORRESPONDENCE TO
Ivy Mayara Sanches de Oliveira Departamento de Ciências Florestais, Universidade Federal de Lavras – UFLA, Av. Doutor Sylvio Menicucci, 1001, CEP 37200-000, Lavras, MG, Brasil e-mail: [email protected]
FINANCIAL SUPPORT
CAPES
REFERENCES
Accioly LJO, Pachêco A, Costa TCC, Lopes OF, Oliveira MAJ. Relações empíricas entre a estrutura da vegetação de dados do sensor TM/LANDSAT. Revista Brasileira
de Engenharia Agrícola e Ambiental 2002; 6(3): 492-498.
http://dx.doi.org/10.1590/S1415-43662002000300019. Alvarenga LHV. Imagens de Alta Resolução e Geoestatística na Estratificação da Fisionomia Cerrado para Inventários
Florestais [dissertação]. Lavras: Departamento de Ciências
Florestais, Universidade Federal de Lavras; 2012. Assis AL, Mello JM, Guedes IC. L., Scolforo JRS, Oliveira AD. Development of a sampling strategy for young stands of Eucalyptus sp using geostatistics. Cerne 2009; 15(2): 166-173.
Biondi F, Myers DE, Avery CC. Geostatistically modeling stem size and increment in an old-growth forest. Canadian
Journal of Forest Research 1994; 24(7): 1354-1368. https://
doi.org/10.1139/x94-176.
sensing. Forest Ecology and Management 2006; 223(1): 45-53. http://dx.doi.org/10.1016/j.foreco.2005.10.056. Cochran WG. Sampling techniques. 3. ed. New York: John Wiley & Sons, 1977.
Ghahramany L, Fatehi P, Ghazanfari H. Estimation of basal area in west oak forests of iran using remote sensing imagery. International Journal of Geosciences 2012; 3(2): 398-403. http://dx.doi.org/10.4236/ijg.2012.32044. Kanegae H Jr, Scolforo JRS, Mello JMD, Oliveira ADD. Avaliação de interpoladores estatísticos e determinísticos como instrumento de estratificação de povoamentos clonais de Eucalyptus sp. Cerne 2006; 12(2): 123-136. Leal FA. Técnicas de sensoriamento remoto e geoestatística aplicadas em um povoamento de Eucalyptus urophylla S.
T. Blake para estimativa de volume [dissertação]. Brasília:
Universidade de Brasília; 2013.
Linhares CA, Ponzoni FJ. Análise multivariada de dados dendrométricos e radiométricos referentes à uma plantação de Pinus. In: Anais do X Simpósio Brasileiro
de Sensoriamento Remoto; 2001; Foz do Iguaçu. Foz do
Iguaçu: INPE; 2001. p. 1641-1647.
Martins FSRV, Santos JR, Xaud RX, Xaud HAM. Análise de ferramentas de SIG para estimativa de biomassa potencial: um estudo de caso em região de contato floresta/ savana, Roraima. In: Anais do XV Simpósio Brasileiro de
Sensoriamento Remoto; 2011; Curitiba. Curitiba: INPE;
2011. p. 4126-4133.
Matheron G. Principles of geostatistics. Economic Geology,
Lancaster 1963; 58(8): 1246-1266. http://dx.doi.org/10.2113/
gsecongeo.58.8.1246.
Mello JM, Scolforo JRS. Análise comparativa de procedimentos de amostragem em um remanescente de floresta estacional semidecídua montana. Revista Árvore 2000; 24(1): 55-62.
Mello JM. Geoestatística aplicada ao inventário florestal
[tese]. Piracicaba: Escola Superior de Agricultura “Luiz de Queiroz”, Universidade de São Paulo; 2004.
Oliveira GMV, Mello JM, Altoé TF, Scalon JD, Scolforo JRS, Pires JV. Equações hipsométricas para eucalyptus
spp. Não manejado em idade avançada com técnicas de inclusão de covariantes. Cerne 2015; 21(3): 483-492. http:// dx.doi.org/10.1590/01047760201521031740.
Reis A. A. Geotecnologias Aplicadas ao Inventário de
Florestas Plantadas [dissertação]. Lavras: Departamento de
Ciências Florestais, Universidade Federal de Lavras; 2015.
Ribeiro PJ Jr, Diggle PJ. GeoR: a package for geostatistical analysis. R-News [online], 2001 [cited 2015 Apr 5]; 1(2): 15-18. Available from: http://www.leg.ufpr.br/geoR/ geoRdoc/vignette/
Rouse J, Haas R, Schell J, Deering D, Harlan J. Monitoring the vernal advancements and retrogradation (greenwave
effect) of nature vegetation. Greenbelt, MD: NASA; 1973.
NASA/GSFC Final Report.
Silva ST, Mello JM, Acerbi FW Jr, Reis AA, Raimundo MR, Silva ILG et al. Uso de imagens de sensoriamento remoto para estratificação do cerrado em inventários florestais.
Pesquisa Florestal Brasileira 2014; 34(80): 337-343. http://


![PHENOTYPIC DIVERSITY AND AMYLOLYTIC ACTIVITY OF FAST GROWING RHIZOBIA FROM PIGEONPEA [Cajanus cajan (L.) MILLSP.] Paulo Ivan Fernandes Júnior](data:image/gif;base64,R0lGODlhAQABAIAAAP///wAAACH5BAEAAAAALAAAAAABAAEAAAICRAEAOw==)