2017 | Lavras | Editora UFLA | www.editora.ufla.br | www.scielo.br/cagro
Land-use effect on hydropedology in a mountainous
region of Southeastern Brazil
Efeito do uso do solo na hidropedologia em uma região montanhosa do sudeste do Brasil
Leandro Campos Pinto1*, Carlos Rogério de Mello2, Lloyd Darrell Norton3, Sérgio Henrique Godinho Silva1, Luís Renato Silva Taveira1, Nilton Curi1
1Universidade Federal de Lavras/UFLA, Departamento de Ciência do Solo/DCS, Lavras, MG, Brasil 2Universidade Federal de Lavras/UFLA, Departamento de Engenharia/DEG, Lavras, MG, Brasil 3Purdue University/USDA-ARS, National Soil Erosion Research Laboratory, West Lafayette, Indiana, USA *Corresponding author: [email protected]
Received in January 27, 2017 and approved in April 24, 2017
ABSTRACT
In Brazil, the Mantiqueira Range, southeastern region, shelters the last remnants of the ecologically important Upper Montane Tropical Forest. since extensive exploration that has been taking place in this biome for decades, the influence of land-use changes on hydropedology in these areas must be investigated once major land-use changes have been observed. This study aims to evaluate the land-use influence on soil drainable porosity (SDP)in a headwater watershed located in the Mantiqueira Range region, and to validate the proposed methods based on micromorphological and hydrological indicators. The native vegetation of the study area is Atlantic forest that occupies 62% of the area, and the remaining 38% has been used for pasture. Thirty nine combinations of environmental variables were tested, each one generating a map for predicting SDP. The performance of the spatial prediction of SDP was assessed using 20% of the data from the total number of samples collected throughout the watershed. The least values of SDP are due to the process of removal of native forest and replacement by pasture. Areas with high to moderate SDP are associated with native forest fragments demonstrating the effects of the Atlantic Forest on the water infiltration and groundwater recharge processes, given by the greater contribution of baseflow in a forested catchment located within the studied watershed. The analysis of soil micromorphological images provided useful supporting information on the soil porosity system and along with hydrological properties of the watershed helped understand the SDP behavior on subsurface and groundwater storage capacity. Index terms: Upper montane tropical forest; ecological services; mapping modeling; geomorphons.
RESUMO
No Brasil, a Serra da Mantiqueira, abriga um dos últimos remanescentes da Floresta Tropical de Altitude. Devido a grande exploração que vem ocorrendo neste bioma há décadas, a influência na hidropedologia decorrente das mudanças do uso do solo deve ser investigada. O objetivo deste estudo foi avaliar a influência do uso do solo na porosidade drenável do solo (PDS) em uma bacia hidrográfica localizada na região da Serra da Mantiqueira e validar os métodos propostos com base em indicadores micromorfológicos e hidrológicos. A vegetação nativa da área de estudo é a Mata Atlântica que ocupa 62% da área, e com os 38% restantes utilizados para pastagem. Trinta e nove combinações de variáveis ambientais foram testadas, cada uma gerando um mapa para predizer a PDS. O desempenho da predição espacial da PDS foi avaliado utilizando 20% dos dados do número total de amostras coletadas em toda a bacia hidrográfica. Os menores valores de PDS são devidos ao processo de remoção de floresta nativa e substituição por pastagem. Áreas com altos a moderados valores de PDS estão associadas a fragmentos de florestas nativas que demonstram os efeitos da Mata Atlântica nos processos de infiltração de água e de recarga de água subterrânea na região da Mantiqueira, dada a maior contribuição do fluxo base em áreas florestadas. A análise micromorfológica do solo forneceu informações úteis sobre o sistema poroso do solo e as propriedades hidrológicas da bacia hidrográfica, ajudando a entender o comportamento da PDS e a capacidade de armazenamento em subsuperfícíe.
Termos para indexação: Floresta tropical de altitude; serviços ecológicos; modelo de mapeamento; geomorphons.
INTRODUCTION
Population growth, inadequate soil management and climate changes and variability are the most important elements that have effected the critical zone, becoming water increasingly scarce in mountainous tropical regions
The effects on hydrology of native forest and reforestation of degraded lands in the humid tropics have implications for local and regional ecological services, but such issues have been relatively less studied when compared to the impacts of forest conversion to pasture and cropped sites (Mello; Curi, 2012; Pinto; Mello; Ávila, 2013; Pinto et al., 2016). Since these impacts need to be better understood, the knowledge of the relationship between pedology and hydrology (hydropedology) is an
important tool for the field of soil and water conservation.
Hydropedology is the interweavement of Soil Science and Hydrology and its application is quite wide within the various branches of knowledge of both sciences (Mello; Curi, 2012), subsidizing the interface between the hydrosphere and the pedosphere (Lin, 2010; Lin, 2012).
This field of investigation has great importance for the
understanding the critical zone (zone that goes from the canopy to the base of the aquifer) wherein occurs the main processes associated with the hydrological cycle, the vegetative cover and their relationships with the atmosphere, pedosphere, hydrosphere and the lithosphere (Lin, 2010; Mello; Curi, 2012). Therefore, hydropedology has fundamental importance for understanding the processes of groundwater recharge in environments like the Upper Montane Cloud Forest in the Mantiqueira Range, because the soil in this area is an essential element in regulating water cycle functioning, and storage and transmission of water into the saturated zone of the watershed (Pinto et al., 2015a).
Since several springs originate from the mountainous environment, its protection has become fundamental to keep the ecological function balanced from anthropic interferences and degradation. In this kind environment,
we can find upper montane forest catchments, which in
turn play an important role in water cycling since they are capable of managing rainwater, allowing it to be stored and released slowly into the water courses throughout the year (Pinto et al., 2015a; 2016).
It has been demonstrated that upper montane forests catchments with minimal land cover disturbance will function to store water in subsurface and ground systems due to their ability to infiltrate water, and attenuate rainfall intense due to having good soil physical properties (Alvarenga et al., 2016; Ávila et al., 2014; Menezes et al., 2009; Pinto et al., 2015a; 2016), like high soil drainable porosity. On the contrary, highly disturbed montane catchments that have been submitted to minimal conservation practices can present reduced ability for water
infiltration leading to increased overland flow.
In Brazil, an important headwater region that encompasses upper forest catchments (critical zone hydrology) is the Mantiqueira Range Region (MRR), located in southeastern part of the country. Many rivers originate from the MRR which also feed important hydroelectric power plant’s reservoirs for the country (Beskow et al., 2009; Viola et al., 2014). In MRR, we can
find the last remnants of upper Atlantic Forest in Brazil.
Generally, this biome is the richest in species diversity, comprising up to 8% of the total species in the world and a great number of endemic species (Myers et al., 2000). Unfortunately, despite such great diversity, the Atlantic Forest is one of the most threatened forest’s ecosystems on the planet (Colombo; Joly, 2010; Myers et al., 2000). It is estimated that the Atlantic Forest originally occupied over 1.48 million km2 in Brazilian territory (Ribeiro et al.,
2009), but now, only 7% of the original area exist mostly as
fragmented remnants distributed over areas with difficult
access, such as mountainous regions (Vieira et al., 2008). Taking into consideration these features, MRR should be considered a priority area for conservation in Brazil.
There is a consensus that deforestation of native forests has interfered with the maintenance of water supply, as there is a decreasing in watersheds ability for
water infiltration and thus natural regularization of flows.
Soils with degraded structure tend to have increased bulk density and consequently a decrease in soil porosity and its continuity, which also affects water movement in the
soil profile, since those soil attributes are closely related to
soil-water dynamics (Pinto et al., 2015a). In this context, deforestation in the MRR has caused a rapid reduction
of the natural regulation of streamflows, leading to water
scarcity, with climate drought events becoming more acuter (Menezes et al., 2009; Viola et al., 2015).
More importantly, the influence of land-use changes
on hydropedology must be investigated in this region since major land-use changes have been observed in recent years. It is further necessary for the comprehension of soil physical properties and their relationship to hydrologic function on the landscape highlighting the swap in land-use for forests replaced by low productivity pastures (Salemi et al., 2013).
In addition, another aspect that influences the hydropedology
is the landscape shape. Therefore, the landform indicators become important tools for understanding the relationships between soil properties and landscape (Libohova et al., 2016; Pinto et al., 2016; Silva et al., 2016b).
Geomorphons is a recent computational tool developed by Jasiewicz and Stepinski (2013) and has generated good results for soil mapping. This tool has
a landscape through a Digital Elevation Model (DEM) analysis utilizing the concept of Local Ternary Patterns (LTP) (Liao, 2010). A local pattern is determined using a neighborhood with size and shape that self-adapts to the local topography (Jasiewicz; Stepinski, 2013). Based on this concept, ten most common types of landforms are
identified and some studies have related such a concept to
soil properties variability, generating new insights for the
hydropedology field of investigation (Pinto et al., 2016;
Silva et al., 2016a, b; Toma et al., 2015).
In this sense, the use of new technologies, such as those provided by digital soil mapping (McBratney; Santos; Minasny, 2003) that allows the user to make inferences about hydropedological variability across the landscape by means of land-use changes over time
and landforms classification, enable a more complete
understanding of the environmental functions (Menezes et al., 2014). Additionally, a more detailed description of soils as promoted by micromorphological analyses as well as the use of hydrological parameters, such as those
that influence streamflows, can also increase the level of understanding of the influence of land-use change on
pedological properties and indeed on hydrology (Pinto; Mello; Ávila, 2013).
Therefore, the overall hypothesis for this research is
that land-use has a strong influence on soil drainable porosity
(SDP) in watersheds within headwater environments, like MRR, where the subsurface and groundwater recharge are very sensitive to land-use (Alvarenga et al., 2012; Viola et al., 2013, 2014).
This study aims to evaluate the land-use influence
on SDPin a tropical headwater watershed, by means digital
soil mapping modeling based on landform classification,
soil micromorphology analyses, and hydrological indicators as parameters to validate the hypothesis.
MATERIAL AND METHODS
Study site
This study was carried out in Lavrinha Creek Watershed (LCW), a headwater watershed located in Southeastern Brazil, between latitudes 22º6’53.7” and 22º8’28.1”S and longitudes 44º26’21.1” and 44º28’39.2”W, with an area of 676 ha within the Mantiqueira Range physiographical region. The native vegetation is Atlantic forest, and the land cover includes Atlantic Forest occupying 62% of LCW in the steepest slopes, whereas, gentler slopes contain degraded pasture in 38% of the area (Figure 1).
Inceptisols are the main soils in the watershed, covering about 92% of the area (Menezes et al., 2009) (Figure 1). These are relatively minimally weathered soils that constitute very fragile systems because they have C horizon near the surface, making them highly susceptible to water erosion (Pinto et al., 2015b; Resende et al., 2014),
which is amplified as they are located on very steep slopes.
Also, they have very weak blocky structure when dry, but when moist or wet the effects of such structure are not well expressed, and they are very susceptible to crusting, which
tends to decrease the low natural water infiltration and,
hence, soil water recharge (Pinto et al., 2015a).
Digital elevation model and Terrain attributes
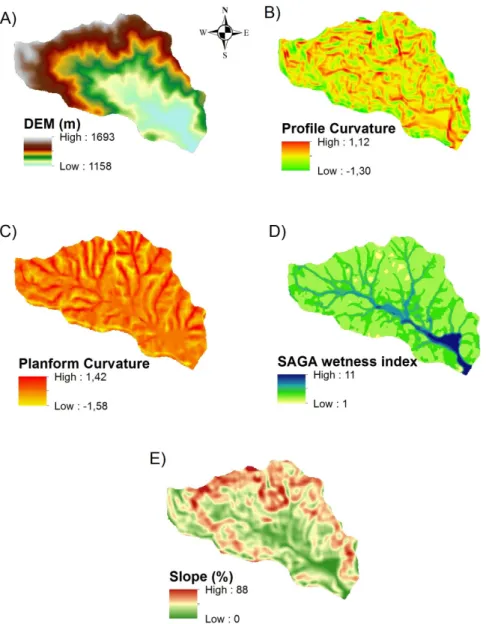
Terrain attributes (TA) were obtained through the creation of a digital elevation model (DEM) (Figure 2), a continuous raster format representation of the altitude, constituted by pixels of 10 x 10 m that inform the elevation of each place on the landscape. In this procedure, planaltimetric maps (1:50,000 scale) and elevation points, available at the Brazilian Geography and Statistics Institution (IBGE) website (http://www.ibge.gov.br), were inserted in ArcGIS software (ESRI) to develop the DEM for LCW area using the Topo to
Raster function. The DEM sinks were filled in order to make it
Figure 2: Digital elevation model (DEM) (A) and terrain attributes (TA): profile curvature (B), planform curvature (C), SAGA
hydrologically consistent (Figure 2). It allowed the creation of other terrain maps derived from the DEM using the software ArcGIS (ESRI) and SAGA GIS (Conrad et al., 2015), such
as slope gradient, profile and planform curvatures and SAGA
wetness index (SWI) (Figure 2). All these variables are environmental covariates widely used as adequate predictors of soil classes and properties as demonstrated in several studies regarding soil mapping (Adhikari et al., 2014; Brown; McDaniel; Gessler, 2012; Hengl et al., 2015; Silva; Santos; Marques, 2014, 2016a, b, c; Vaysse; Lagacherie, 2015).
Landform classification
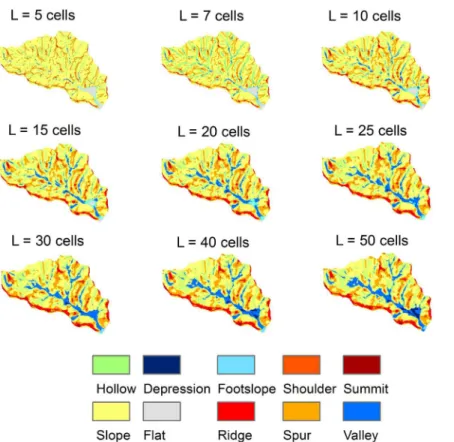
Geomorphons is a recent computational tool developed by Jasiewicz and Stepinski (2013), which has
little computational cost and identifies landforms within a
landscape through a Digital Elevation Model (DEM) analysis. Geomorphons was derived from DEM using nine different look up distances (L) (5, 7, 10, 15, 20, 25, 30, 40, and 50 cells), which correspond to the number of cells (pixels) in the radius of the circumference around a cell of interest and was performed using GRASS GIS 7.0 (Neteler; Mitasova, 2008). The most frequent and common landform elements from a
typical terrestrial landscape that this tool can identify are
flat, summit, ridge, shoulder, spur, slope, hollow, footslope,
valley, and depression (Jasiewicz; Stepinski, 2013) (Figure 3).
Soil Drainable Porosity (SDP) mapping model
SDP values were obtained from soil samples collected throughout the watershed in a sampling scheme as illustrated in Figure 1a. Its calculation is based on the difference between
soil moisture saturation and soil moisture at field capacity
(Mello et al., 2002), making up a total of 193 samples. These samples were divided into two groups: one for calibration and another for validation. Data from the calibration group (80% of the data) were used to generate SDP maps, while for validation, the remaining 20% of the data were used.
SDP map for LCW was modeled based on a digital soil mapping approach that combines expert knowledge, for developing guiding rules of soil classes and properties, and fuzzy logic which is embedded as an ArcGIS 10.1 (ESRI), being an extension named ArcSIE (Soil Inference Engine) (Shi et al., 2009). ArcSIE is an expert knowledge-based inference tool designed for creating soil maps based on fuzzy logic (McKay et al., 2010), setting a similarity value
for each pixel through comparison of each pixel to an ideal condition (rules). The greater the similarity between the pixel condition (terrain information) and the rule for a soil class, the higher the value assigned to each pixel, ranging from 0 (no similarity) to 1 (high similarity). This approach is named Rule-Based Reasoning (RBR) inference method and was implemented in ArcSIE for calculating fuzzy membership values and, thus, generating fuzzy membership maps for the entire area, which, in turn, are referred to as
optimality functions because they define the relationships
between the values of an environmental covariate and a soil class (rule) (Menezes et al., 2013). Then, these fuzzy
membership maps are combined into one final hardened
map, in which only the soil class that is likely to occur at each pixel (based on the rules and the similarity vectors) is assigned to that pixel, which means classes with the highest membership values (Menezes et al., 2014). From this soil class map, a soil property map can be created.
The fuzzy membership maps were produced in four different ways: a) based on solely on terrain attributes, according to rules among values of the terrain information (DEM, slope, plan and profile curvatures, and SWI) obtained from Menezes et al. (2014) to generate a soil class map and then a soil SDP map; b) based on a land-use map for LCW; c) based on Geomorphons maps created at nine different look up distances; and d) using combinations between the land-use map, terrain attributes and the Geomorphons generated at nine look up distances. The nominal function was used to produce membership maps from the land-use and Geomorphons fuzzy, in which each environmental feature (forest, pasture, and Geomorphons types) became a membership map.
Thirty-nine combinations of the environmental variables (Terrain Attributes (TA), land-use (LU) and Geomorphons (Geom) at nine different look up distances (L) (5, 7, 10, 15, 20, 25, 30, 40, and 50 cells) were tested, each one generating a map for predicting DP. These maps required a typical SDP value for each membership map to be generated and this value was obtained from the calculation of the mean value of SDP from the samples collected throughout the watershed, as illustrated in Figure 1a. In sequence, the continuous variation of this soil property resulted in a SDP map derived from similarity vectors, by the following formula in ArcSIE (Zhu et al., 1997) (Equation 1):
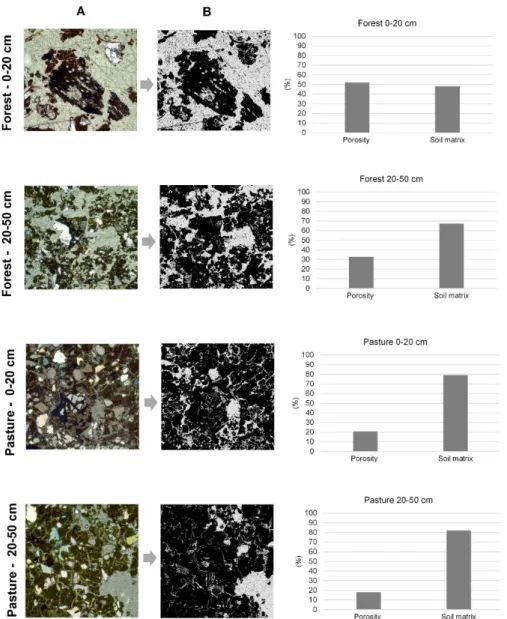
Micromorphological analyses
Micromorphological studies were carried out to detail SDP, at a microscope scale. The pore system was characterized using image analysis of thin sections from undisturbed soil samples collected at depths of 0-20 cm and 20-50 cm, encompassing both A and B horizons, respectively, using a Kubiena box. These samples were air-dried and subsequently slowly dried in an oven at the following temperatures 40 °C, 60 °C and 100 °C for 24 hours, to minimize cracking due to rapid drying. The samples were then impregnated with an epoxy resin and de-aerated under vacuum (Castro et al., 2003) for three days to minimize air bubbles, and then heated at 100 °C for 4 hours, and 140 °C for 4 hours for hardening and curing. The hardened resin blocks were cut, polished and mounted onto glass slides with de-aerated Hillquist®
epoxy resin 7A/3B, and heated for 1 min at 105 °C. Finally, the mounted blocks were sectioned and polished
to the ideal thickness of 30 μm for micromorphological
analysis (Murphy, 1986), and analyzed with a petrographic microscope, in which images (micrographs) were taken. (1)
n k k
ij k 1
ij n k
ij k 1 S *V V S = = =
∑
∑
where, V(ij) is the estimated SDP value at location (ij), k
ij
S is the final fuzzy membership value at (ij) for environmental variable k, Vk is a typical value (mean)
of environmental variable k, and n is the total number of prescribed environmental variables for the area.
The performance of the 38 SDP maps (resulted from the combination of the environmental variables) was assessed using 20% of the data, as previously mentioned, and used for comparison purposes among the 9 different look up distances by comparing the predicted SDP values with the correspondent real values of the validation set. Statistical parameters such as R2, adjusted R2, mean absolute
error (MAE) (Equation 2), and root mean square of error (RMSE) (Equation 3) were calculated in R software (R Development Core Team) for comparison purposes.
where, n is the number of observations, ei is the estimated value of the SDP and the mi is its measured value.
(2)
(3)
1
1 n
i
MAE ei mi
n =
=
∑
−(
)
21
1 n
i
RMSE ei mi
n =
Once the images were obtained, they were classified
into two categories, porosity and soil matrix, using ArcGIS
10.1 (ESRI). The toolbar image classification used for that performs a maximum likelihood classification on a
set of raster bands and creates a two class (porosity and soil matrix) raster as output. It allowed the analyses of the percentage of the area of the image occupied by pores, their type, and continuity as well as soil matrix, which are associated with soil drainage.
Hydrologic validation
In order to validate and better understand the SDP behavior, some hydrological indicators were performed
based on comparison of the base flow (BF) behavior in
a micro-catchment entirely occupied by upper native forest located inside LCW (MFO) and in LCW as a
whole, as the latter has its hydrology influenced by other
land-uses (Figure 1). BF is related to water storage in the underground saturated zone of the watersheds and, thus, primarily is linked to the SDP behavior. In this sense,
every change on pedologic properties will influence in the
hydrologic outputs of these watersheds.
MFO covers a drainage area of about 16 ha entirely occupied by Dense Ombrophilous Forest, which is a typical remnant of the Atlantic Forest of the Mantiqueira Range region (Oliveira Filho et al., 2006). This micro-catchment has an average slope of 35% and the altitude varies between 1,475 m and 1,685 m above sea level.
Weather data sets for LCW and MFO were obtained between June/2009 and September/2011 with one Campbell automatic meteorological station installed
in a clear-cut area outside MFO (Figure 1). Streamflows were monitored using a Parshall flume attached to a water
level logger (model WL16 Global Water Instrumentation, California, USA, with the precision of ±0,1%). For LCW, the same device was employed, however, building a
gauging station and fitting a stage-discharge curve for the
section. Both stations have provided a discharge value every 60 minutes.
Base flow (Db) was studied throughout the hydrological years of 2009/2010 and 2010/2011, considered as a hydrological year was the period between September of a year to August of the subsequent year as the region is strongly characterized by a rainy summer and a dry winter (Mello et al., 2012). Its characterization was made based on the separation from streamflows
(overland flow and base flow). For that, daily streamflow
observations were accounted from 2009 to 2011 were used and the Barnes’ method was applied allowing the
characterization of the hydrograph recession (Barnes, 1939; Durães; Mello, 2013; Hingray; Picouet; Musy, 2014). This method is based on the identification of
inflection points in the runoff (R) hydrographs, considering an exponential behavior for the base flow (Equation 4). From the separation of the base flow, it is possible to
account for it in relation to the total runoff (Db/R), which is one of the most important hydrology indicators used for comparing watersheds.
Recession coefficient was defined following the
fundamentals of the Maillet equation (Dewandel et al., 2003) which has an exponential mathematical behavior:
where, Q0 is the initial baseflow rate, Qt is the baseflow
rate at time t (daily) and α (day-1), the recession coefficient, which is a physical property of the aquifer. This coefficient was obtained by taking into account the baseflow observed
during the hydrograph recession throughout the dry period, which was better characterized between June and August (end of the hydrological year) as this period allows for characterization of the acute dry period in the region (Coelho et al., 2016).
The recession coefficient (α) indicates the production rate of the base flow that represents the part of the streamflow which is predominantly maintained
by groundwater restitution (Silva; Bacellar; Fernandes,
2010). In this model, as the baseflow has a rate exponential decrease (Equation 4), the greater α, in absolute values, the
closer the Qt and Q0 values will be, or the greater natural regulatory capacity of the watershed, with greater amount
of water stored, providing streamflow even during the
driest periods of the year.
Having this point in mind, we understand that two hydrological years data, without gaps in the data
series, can qualitatively reflect the impacts from these
two different land-uses (native forest and pasture) in SDP behavior. The hydrologic indicators considered were the
ratio between baseflow/runoff (BF/R) and overland flow/
runoff (OF/R), allowing to quantify the participation of
baseflow as it is a consequence of groundwater subsurface
saturated zone recharge, meaning it is affected by SDP. In
addition, the coefficient of depletion for both catchments
was also evaluated as it allows the understanding of how the saturated zone behaves in terms of drainage of water storage, being another relevant hydrology indicator.
(
)
0 exp .
t
RESULTS AND DISCUSSION
Spatial distribution of soil drainable porosity
Table 1 shows the R2, R2
adj, MAE and RMSE
regarding the performance of the predictive methods for SDP at LCW.
According to these statistical indicators, since the greater the R2 and adjusted R2 and the lower the MAE
and the RMSE the better the prediction, the method that combines Geomorphons with look up distance of 25 cells (GeomL25)and land-use (LU) was the most efficient to predict SDP at LCW, with the greatest R2 and R2
adj, and
RMSE and MAE closer to zero.
It can be seen that, among the several prediction methods tested for SDP prediction, when land-use was taken
into account, the precision of the model increased significantly
(Table 1) in comparison to methods that only considered the TA and/or Geomorphons. Therefore, there is a clear and strong relationship between land-use and SDP. This brings a new insight to the effects that land-use changes may cause on the environment, mainly in critical zones such as the MRR. Regarding the variables used for different prediction methods, the association of land-use with Geomorphons improved the SDP predictions. Silva et al. (2016b) studying the same area found a strong relationship between Geomorphons and soil types regardless of pixel size and look up distance for Geomorphons calculation. Other studies have successfully used models applying Geomorphons to predict soil properties (e.g. Libohova et al., 2016; Pinto et al., 2016). However, in agreement with the result of this study is that the Geomorphons solely could not accurately predict the soil property SDP, Toma et al. (2015) found that Geomorphons in association with slope gradient better explained the relationships of landform and soil organic carbon than only Geomorphons.
Because the method that combines GeomL25 and
land-use was the most efficient, it was used to create the
spatial distribution of SDP for LCW (Figure 4). Table 1: R2, R2
adj, MAE and RMSE for assessment of
predictive methods performance of SDP at LCW.
Methods Parameters
R2 R2
adj MAE RMSE
LU 0.36 0.34 4.19 6.308
TA 0.05 0.02 6 7.576
TA+LU 0.51 0.5 4.18 6.117
GeomL5 0.01 -0.02 6.1 7.861 GeomL7 0.06 0.03 6.02 7.849
GeomL10 0.05 0.02 6.2 7.917 GeomL15 0.12 0.09 5.9 7.31 GeomL20 0.14 0.12 5.71 7.139 GeomL25 0.14 0.12 5.72 7.155
GeomL30 0.07 0.04 6.04 7.595 GeomL40 0.06 0.03 5.91 7.753 GeomL50 0.03 0.01 6.14 8.12 GeomL5+TA 0.02 0 6.05 7.685
GeomL7+TA 0.07 0.04 5.86 7.525
GeomL10+TA 0.05 0.02 6.03 7.674 GeomL15+TA 0.12 0.09 5.76 7.218 GeomL20+TA 0.14 0.11 5.63 7.132
GeomL25+TA 0.14 0.11 5.63 7.133
GeomL30+TA 0.07 0.05 5.83 7.44 GeomL40+TA 0.07 0.05 5.72 7.472 GeomL50+TA 0.05 0.02 5.88 7.682 GeomL5+LU 0.46 0.45 4.43 5.87
GeomL7+LU 0.48 0.47 4.34 5.676 GeomL10+LU 0.48 0.47 4.26 5.692 GeomL15+LU 0.56 0.55 4.15 5.407 GeomL20+LU 0.6 0.59 4.37 5.569
GeomL25+LU 0.6 0.59 4.04 5.339
GeomL30+LU 0.52 0.5 4.16 5.618 GeomL40+LU 0.5 0.49 3.92 5.623
Methods Parameters
R2 R2
adj MAE RMSE
GeomL50+LU 0.44 0.43 4.03 5.79 GeomL5+LU+TA 0.43 0.42 4.59 6.112
GeomL7+LU+TA 0.46 0.45 4.41 5.918
GeomL10+LU+TA 0.44 0.42 4.5 5.991 GeomL15+LU+TA 0.51 0.49 4.38 5.75 GeomL20+LU+TA 0.53 0.51 4.27 5.707 GeomL25+LU+TA 0.53 0.51 4.3 5.707
GeomL30+LU+TA 0.47 0.46 4.38 5.914 GeomL40+LU+TA 0.45 0.44 4.22 5.912 GeomL50+LU+TA 0.41 0.39 4.26 6.034
Table 1: Continuation...
In situ, SDP values ranged from 6 to 53% with an average of 27%. Analyzing the values obtained in
the field, it was possible to observe a clear distinction
between those obtained under native forest areas and those obtained in areas with human intervention (Figure 4). In the northern LCW, which is covered by native forest, it was observed the greater SDP values (average 31.85%) than for LCW as a whole. In contrast, the lower SDP values (average 14.48%) were found in areas with a predominance of pastures in the central and southwestern areas of the watershed. These results are better observed when SDP map is compared to the watershed land-use map (Figure 1). It’s evident that areas that show greater SDP are covered by native forest,
indicating that this land-use has a great influence on the
SDP values in this watershed.
On the other hand, the anthropic action tends to affect the soil permeability, thus, preserved areas like
native forests have greater potential for infiltration,
promoting a reduction in overland flow and reduce sediment transport. Therefore, the lowest values of SDP at areas under pasture are due to the process of withdrawal and replacement of native forest for this type of land-use. This behavior can be associated with the characteristics of Atlantic Forest in mountainous region, like the MRR, which has a thick litter layer, low soil bulk density, high organic carbon content and greater biological activities when compared to pasture, whose physiographic characteristics do not favor water
infiltration (Menezes et al., 2009). The presence of native
forests in an advanced stage of development provides better conditions for the development and maintenance of gravitational pores with higher SDP, and formation
of preferential flows throughout the soil profile (Bonell
et al., 2010; Mello; Curi, 2012; Pinto et al., 2015b). Therefore, even the partial deforestation can bring substantial changes in patterns of hydrological response of the headwater catchments (Wiekenkamp et al., 2016).
Price, Jackson and Parker (2010), in a hydrological study carried out in mountainous catchments, also found that the conversion of native vegetation to agricultural uses reduced soil infiltration and soil-water storage capabilities, resulting in increased surface runoff and reduced subsurface storage. The results of Germer et al. (2010), in study involving land-use change on near-surface hydrological processes in the Amazon Basin, show that conversion of undisturbed forest to pasture increased not
only the frequency and volume of stormflow, but also the
contributing area and the manner in which the water moves into and through soil towards the drainage channels. Pietola, Horn and Yli-Halla (2005) found a significant difference in
water infiltration between trampled and non-trampled soils
by cattle, even though the grazing intensity was low.
Therefore, the spatial identification of promising
areas in the context of water recharge allows for better land-use planning in order to maintain a sustainable water supply (Viola et al., 2015). Tsui, Chen and Hsieh (2004), researching the relationships between soil properties and slope positions in a lowland rain forest of Southern Taiwan, found an increase of organic carbon and a lower rate of decomposition in the summit forest. Other authors found similar results and stated that these results are mostly linked to the native forest existence, which consists of a system without human activity and provides a greater amount of organic carbon to the environment (Beutler et al., 2002; Rawls et al., 2003).
Background from micromorphological analyses
To strengthen the findings previously presented
in this study, micromorphological analyses of the A and B horizons of the studied soil (Inceptisols) were also conducted aiming to further understand how soil structure
was influenced by land-use and thus, SDP and water percolation throughout soil profile (Figure 5).
The micromorphological analysis clearly showed the soil under forest has a much more open and heterogeneous pore structure network. Analyzing the scanned image, soil porosity decreased with depth for both land-uses, ranging from 33 to 52% in the Inceptisols Figure 4: Spatial distribution of soil drainable porosity
under native forest and from 18 to 21% in the Inceptisols under pasture. This may be partially due to the greater amount of soil organic matter in the A horizon than in B horizon (9.2% and 4% in horizon A and B under forest, respectively, and 4.6% and 2.9% in horizon A and B under pasture, respectively). Organic matter is strongly related to the formation of granular structure in the surface horizon, thus, favouring greater drainable porosity in contrast to the blocky structure in the B horizon that tends to promote greater microporosity than drainable porosity when compared to the A horizon (Buol et al., 2011; Resende et al., 2014; Tobiašová, 2011).
Regarding land-use, the Inceptisols under native forest had greater porosity values, which vary from 40 to 55%, according to scanned image area evaluated, greater than those for Inceptisols under pasture in the 0-20 and 20-50 cm depth, respectively. All these results corroborate and strengthen the patterns obtained for drainable porosity analyses (Figure 4).
The knowledge of soil porosity in the Mantiqueira Range region was important to support the sustainable use and conservation of the environment resources and this micromorphological technique has become an important tool for investigating and understanding the hydropedology on the landscape.
Validation from hydrological point of view
To validate from a hydrological point of view SDP is essential as a soil hydrology attribute that
strongly influence the soil-water infiltration, and thus,
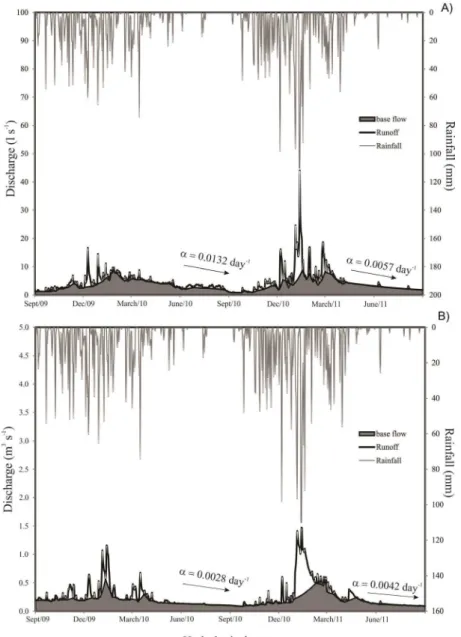
in the catchment hydrology as a whole. This way, some hydrological indicators were also analyzed. Figure 6 presents the observed hydrographs for both LCW as a whole and for MFO sites throughout the hydrological years of 2009/2010 and 2010/2011.
It is possible to observe intra-annual variability of
streamflow, highlighted by the peak discharges, being a
clear result of the regional climate characteristics (high concentration of rainfall during the summer). Despite the effect of the canopy of the Atlantic Forest in the rainfall intensity, for MFO, we can see a greater oscillation in the hydrograph, with more frequent peak discharge occurrence, including during the dry season as the catchment is much smaller than LCW and the relief is steeper.
It was observed that there was a greater concentration of rainfall in the 2010-2011 hydrological year, with accentuated peak discharges in January/2011 as a consequence of the events with an intensity greater than 40 mm h-1, meaning more favorable conditions for the occurrence of overland flow at both studied sites.
Althoughthese intense rainfall events, areas with native forest and higher SDP values had better conditions for
water percolation in the soil profile compared with those
areas with lower SDP which is linked to the degraded pasture. In other words, in the MFO, there are more
favorable conditions for infiltration of water into the soil,
promoting recharge to the sub-surface (from A horizon and the saprolite) layer or even for aquifers located below this saturated zone, as SDP is much greater in relation to
the entire LCW. Thus, we can link this more significant occurrence of baseflow in this catchment (in relation to
LCW as a whole) (Figure 6) to the greater SDP values under Atlantic Forest conditions (Figure 4).
In general, for both years (2009/2010 and 2010/2011) a greater amount of baseflow could be observed in the MFO, meaning that there were better
conditions for infiltration and, consequently, greater water
yield capacity over time.
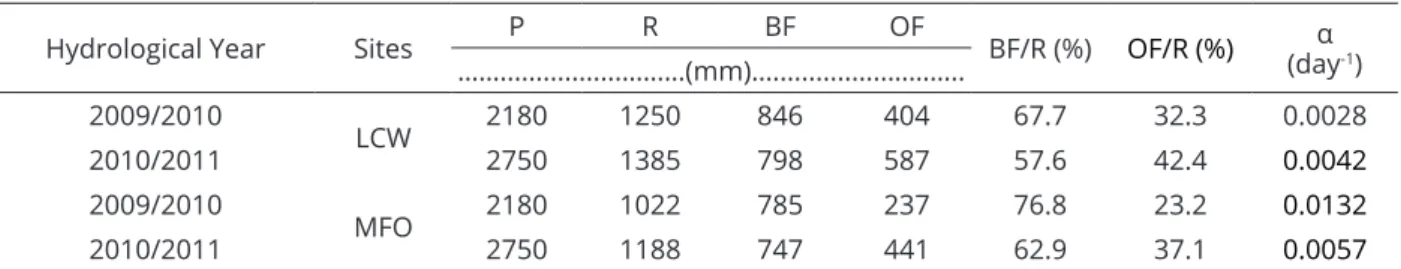
Table 2 presents precipitation, runoff, overland flow, base flow, and recession coefficient in the hydrological
years monitored for LCW and MFO, extracted from hydrograph analyses presented in Figure 6.
At both hydrological sites, the hydrological year of
2009/2010 generated greater participation to the baseflow
as a consequence of a better temporal distribution of rainfall in summer, with lower rainfall intensity events. Overland
flow was greater weight in 2010/2011 year due to the occurrence of greater intense rainfall events. Specifically,
in 2009/2010 hydrological year, the participation of the
base flow in total runoff was greater for MFO, with BF/R
ratio of about 76.8%, which means a lesser contribution
of overland flow to total runoff (OF/R relation of 23.2%).
In LCW as a whole, these values were 67.7% and 32.3% for BF/R and DR/R, respectively. This same behavior was observed for 2010/2011 hydrological year, in which
base flow contribution to runoff (BF/R) in the MFO was 62.9%, whereas, the contribution of overland flow in the
total runoff (OF/R) was 37.1%. In LCW, for the same hydrological year, there were values of 57.6% and 42.4% to BF/R and DR/R, respectively. These results demonstrate the importance of Atlantic Forest for surface hydrology in relation to pasture, offering a greater protection for the soil under a steep topography, reducing the occurrence of
flash floods and sediment transport.
The coefficients of the recession (α), in absolute
values, were lesser for LCW than MFO, in both rainy seasons (0.0028 against 0.0132 and 0.0042 against 0.0057, respectively, for 2009/2010 and 2010/2011 hydrologic years).
As the decrease in flow rate is exponential (Equation 4), the greater α in absolute values at MFO means that this catchment
drains water stored more slowly into the saturated zone
providing greater streamflow during the driest period of the year. Based on these coefficients, it is possible to conclude that
the groundwater system under MFO conditions has greater
ability to control the baseflow. Given that 38 % of LCW area
is occupied by degraded pasture (Figure 1), the hydrological indicators have shown that MFO has better capabilities for
natural regularization of streamflow, thus, generating a more stable groundwater flow system.
Viola et al. (2013) simulated the hydrological impacts in four watersheds with similar climate and soil properties in the Grande River basin, and concluded that differences in runoff components within these watersheds are mainly linked to land-use differences and that the
greatest contributions of overland flow were found in
watersheds with greater area occupied by agriculture and pasture. These types of land-use produce more overland
flow than forested areas because cultivated soils and
pasture tend to suffer more physical degradation, thus
affecting their infiltration capacity.
Table 2: Hydrological indicators for LCW and MFO in the hydrological years of 2009/2010 and 2010/2011.
P: precipitation; R: runoff; BF: base flow; OF: over land flow; α: recession coefficient.
Hydrological Year Sites P R BF OF BF/R (%) OF/R (%) α (day-1)
……...………(mm)…...……….. 2009/2010
LCW 2180 1250 846 404 67.7 32.3 0.0028
2010/2011 2750 1385 798 587 57.6 42.4 0.0042
2009/2010
MFO 2180 1022 785 237 76.8 23.2 0.0132
Alvarenga et al. (2016) evaluated the effects of land cover changes on the LCW hydrology using the Distributed Hydrology-Soil-Vegetation Model (DHSVM), analyzing the effects of hypothetical land-use change scenarios on the hydrological cycle. This study suggested that high
and low flows regimes are affected by land cover scenario
changes. Their results also suggest that forests consume more water than pasture, but the maintenance of forest covering in the watershed is required for soil and water conservation, reducing the impacts from soil erosion on water yield and its quality.
Since areas previously occupied by Atlantic Forest are currently occupied by low productivity pastures (Salemi et al., 2013), studies focusing on soil and water conservation and ecological services are urgently needed in Mantiqueira Range region. It is important to stress
that these kind of studies are scarce and the influence of
land-use on porosity and, consequently, water dynamics in soils need to be better understood in the region from a hydropedology point of view.
Our results are very relevant for the Mantiqueira Range region, as it demonstrates the importance of the Atlantic Forest to be preserved at upper montane forested watersheds, likely reducing impacts from climate changes,
and mainly those that affect baseflow dynamics, and
therefore, affecting water resources availability.
CONCLUSIONS
Areas with high to moderate drainable porosity values are associated with native forest fragments as land-use, demonstrating the importance of the Atlantic Forest in the groundwater recharge process at the Mantiqueira Range region. The study of soil images provided useful supporting information on the soil pore system and along with hydrological properties of the watershed helped in understanding the processes of water recharge. The great contribution of native
forest to base flow indicates better conditions to water
infiltration and, consequently, and to recharge the groundwater system that resulted in a greater base
flow. The soil drainable porosity results in a
micro-catchment entirely covered by native forest showed that these areas have better conditions to transmit water
to the aquifer, contributing to base flow during drier periods and producing streamflows more controlled by
the groundwater system. This study indicates that soil drainable porosity associated with land-use is related to the dynamic nature of the hydropedological behavior of the watershed.
ACKNOWLEDGMENTS
This work was supported by the FAPEMIG (grant numbers 588 - CAG PPM - 00132/14 and PPM VIII - 71-14), CNPq (grant number 157642/2015-1) and CAPES.
REFERENCES
ADHIKARI, K. et al. Constructing a soil class map of Denmark
based on the FAO legend using digital techniques.
Geoderma, 214-215:101-113, 2014.
ALVARENGA, C. C. et al. Índice de qualidade do solo associado à
recarga de água subterrânea (IQS RA) na Bacia Hidrográfica do Alto Rio Grande, MG. Revista Brasileira de Ciência do Solo, 36(5):1608-1619, 2012.
ALVARENGA, L. A. et al. Assessment of land cover change on the hydrology of a Brazilian headwater watershed using
the Distributed Hydrology-Soil-Vegetation Model. Catena,
143:7-17, 2016.
ÁVILA, L. F. et al. Partição da precipitação pluvial em uma
microbacia hidrográfica ocupada por Mata Atlântica na Serra da Mantiqueira, MG. Ciência Florestal,
24(3):583-595, 2014.
BARNES, B. S. The structure of discharge recession
curves. Transactions of American Geophysical Union,
20(2):721-725, 1939.
BESKOW, S. et al. Soil erosion prediction in the Grande River Basin, Brazil using distributed modeling. Catena, 79(1):49-59, 2009.
BEUTLER, A. N. et al. Retenção de água em dois tipos de Latossolo sob diferentes usos. Revista Brasileira de
Ciência do Solo, 26(3):829-834, 2002.
BONELL, M. et al. The impact of forest use and reforestation on soil hydraulic conductivity in the Western Ghats of India: Implications of surface and sub-surface hydrology. Journal
of Hydrology, 391(1-2):47-62, 2010.
BROWN, R. A.; MCDANIEL, P.; GESSLER, P. E. Terrain attribute modeling of volcanic ash distributions in northern Idaho.
Soil Science Society of America Journal, 76(1):179-187,
2012.
BUOL, S. W. et al. Soil Genesis and Classification.
Wiley-Blackwell, Ames, Iowa. 2011. 534 p.
CASTRO, S. S. et al. Micromorfologia do Solo: Bases e aplicações. In: CURI, N. et al. Tópicos em ciência do solo. Viçosa:
COELHO, C. A. et al. The 2014 southeast Brazil austral summer
drought: Regional scale mechanisms and teleconnections.
Climate Dynamics, 46(11):3737-3752, 2016.
COLOMBO, A. F.; JOLY, C. A. Brazilian Atlantic Forest lato sensu: The most ancient Brazilian forest, and a biodiversity hotspot, is highly threatened by climate
change. Brazilian Journal of Biology, 70(3):697-708, 2010.
CONRAD, O. et al. System for Automated Geoscientific Analyses
(SAGA) v. 2.1.4. Geoscientific Model Development,
8:1991-2007.
DEWANDEL, B. et al. Evaluation of aquifer thickness by
analysing recession hydrographs. Application to the Oman
ophiolite hard-rock aquifer. Journal of Hydrology, 274 (1-4):248-269, 2003.
DURÃES, M. F.; MELLO, C. R. Groundwater recharge behavior
based on surface runoff hydrographs in two basins of the
Minas Gerais State. Revista Ambiente & Água, 8(2):57-66, 2013.
GERMER, S. et al. Influence of land-use change on near-surface hydrological processes: Undisturbed forest to pasture.
Journal of Hydrology, 380(3-4):473-80, 2010.
HENGL, T. Finding the right pixel size. Computers &
Geosciences, 32(9):1283-1298, 2006.
HINGRAY, B.; PICOUET, C.; MUSY, A. Hydrology: A science for
engineers. CRC Press, Boca Raton, 2014. 592p.
JASIEWICZ, J.; STEPINSKI, T. Geomorphons: A pattern
recognition approach to classification and mapping of
landforms. Geomorphology, 182(1):147-156, 2013.
LIBOHOVA, Z. et al. Geomorphons: Landform and property predictions in a glacial moraine in Indiana landscapes.
Catena, 142:66-76, 2016.
LIN, H. Earth’s critical zone and hydropedology: Concepts,
characteristics, and advances. Hydrology and Earth
Systems Science, 14(1):25-45, 2010.
LIN, H. Hydropedology: Addressing fundamentals and building bridges to understand complex pedologic and hydrologic interactions. In: LIN, H. Hydropedology: Synergistic Integration of Soil Science and Hydrology. Academic Press, 2012. p.3-39.
MCBRATNEY, A. B.; SANTOS, M. L. M.; MINASNY, B. On digital
soil mapping. Geoderma, 117(1-2):3-52, 2003.
MCKAY, J. et al. Evaluation of the transferability of a knowledge-based soil-landscape model. In: BOETTINGER, J. L. et al. Digital soil mapping: Bridging research, environmental application, and operation. London: Springer, 2010,
p.165-177.
MELLO, C. R. et al. Predição da porosidade drenável e
disponibilidade de água para Cambissolos da microrregião
Campos das Vertentes, MG. Pesquisa Agropecuária Brasileira, 37(9):1319-1324, 2002.
MELLO, C. R. et al. Sea surface temperature (SST) and rainfall
erosivity in the Upper Grande River Basin, Southeast Brazil.
Ciência e Agrotecnologia, 36(1):53-59, 2012.
MELLO, C. R.; CURI, N. Hydropedology. Ciência e Agrotecnologia,
36(2):137-146, 2012.
MENEZES, M. D. et al. Dinâmica hidrológica de duas nascentes, associada ao uso do solo, características pedológicas e atributos físico-hídricos na sub-bacia hidrográfica do
Ribeirão Lavrinha – Serra da Mantiqueira (MG). Scientia
Forestalis, 37(82):175-184, 2009.
MENEZES, M. D. et al. Digital soil mapping approach based
on fuzzy logic and field expert knowledge. Ciência e
Agrotecnologia, 37(4):287-298, 2013.
MENEZES, M. D. et al. Solum depth spatial prediction comparing
conventional with knowledge-based digital soil mapping
approaches. Scientia Agricola, 71(4):316-323, 2014.
MURPHY, C. P. Thin section preparation of soil and sediments. Berkhamsted: A.B. Academic Publications, 1986. 149 p.
MYERS, N. et al. Biodiversity hotspots for conservation priorities.
Nature, 403:853-858, 2000.
NETELER, M.; MITASOVA, H. Open source GIS: A GRASS GIS
approach. New York: Springer, 2008. 420p.
OLIVEIRA FILHO, A. T. et al. Definição e delimitação de domínios e subdomínios das paisagens naturais do estado de Minas Gerais. In: SCOLFORO, J. R.; CARVALHO,
L. M. T. (Ed.). Mapeamento e Inventário da Flora e dos
Reflorestamentos de Minas Gerais. Lavras: UFLA, 2006.
cap. 1, p.21-35.
PIETOLA, L.; HORN, R.; YLI-HALLA, M. Effects of trampling by
cattle on the hydraulic and mechanical properties of soil.
Soil & Tillage Research, 82(1):99-108, 2005.
PINTO, L. C. et al. Water quality index in two land use situations
in the Mantiqueira Range. Ciência e Agrotecnologia,
PINTO, L. C. et al. Role of inceptisols in the hydrology
of mountainous catchments in Southeastern Brazil.
Journal of Hydrologic Engineering, 2015a. Available in:
<http://ascelibrary.org/doi/abs/10.1061/(ASCE)HE.1943-5584.0001275 >. Access in: August, 21, 2016.
PINTO, L. C. et al. Micromorphology and pedogenesis of
mountainous inceptisols in the Mantiqueira range
(MG). Ciência e Agrotecnologia, 39(5):455-462, 2015b.
PINTO, L. C. et al. Spatial prediction of soil-water transmissivity based on fuzzy logic in a Brazilian headwater watershed.
Catena, 143:26-34, 2016.
PRICE, K.; JACKSON, C. R.; PARKER, A. J. Variation of surficial
soil hydraulic properties across land uses in the southern Blue Ridge Mountains, North Carolina, USA. Journal of
Hydrology, 383(3-4):256-268, 2010.
RAWLS, W. J. et al. Effect of soil organic carbono on soil water retention. Geoderma, 116(1-2):61-76, 2003.
RESENDE, M. et al. Pedologia: Base para distinção de
ambientes. 6. ed. Lavras: Editora UFLA, 2014, 378p.
RIBEIRO, M. C. et al. Brazilian Atlantic forest: how much is left
and how is the remaining forest distributed? Implications for conservation. Biological Conservation,
142(6):1141-1153, 2009.
SALEMI, L. F. et al. Land-use change in the Atlantic rainforest region: Consequences for the hydrology of small
catchments. Journal of Hydrology, 499:100-109, 2013.
SHI, X. et al. Integrating different types of knowledge for digital soil mapping. Soil Science Society of America Journal,
73(5):1682-1692, 2009.
SILVA, R. F. G.; BACELLAR, L. A. P.; FERNANDES, K. N. Estimativa
de parâmetros de aquíferos através do coeficiente de
recessão em áreas de embasamento cristalino de Minas Gerais. Revista Escola de Minas, 63(3):465-471, 2010.
SILVA, B. M.; SANTOS, W. J. R.; MARQUES, J. J. Levantamento detalhado dos solos da Fazenda Muquém/UFLA. Lavras:
UFLA, 2014. 76p.
SILVA, S. H. G. et al. Retrieving pedologist’s mental model from
existing soil map and comparing data mining tools for refining
a larger area map under similar environmental conditions in Southeastern Brazil. Geoderma, 267: 65-77, 2016a.
SILVA, S. H. G. et al. Geomorphometric tool associated with soil types and properties spatial variability at watersheds
under tropical conditions. Scientia Agricola, 73(4):363-370, 2016b.
SILVA, M. A. et al. Predicting runoff risks by digital soil mapping.
Revista Brasileira de Ciência do Solo, 40:1-13, 2016c.
STOTT, P. How climate change affects extreme weather events.
Science, 352(6293):1517-1518, 2016.
TOBIAŠOVÁ, E. The effect of organic matter on the structure of soils of different land uses. Soil & Tillage Research, 114(2):183-192, 2011.
TOMA, M. A. et al. Carbon pool ratios as scientific support to field morphology in the differentiation of dark subsurface
soil horizons. Scientia Agricola, 72(4):334-342, 2015.
TSUI, C.; CHEN, Z. S.; HSIEH, C. F. Relationships between soil
properties and slope position in a lowland rain forest of southern Taiwan. Geoderma, 123(1-2):131-142, 2004.
VAYSSE, K.; LAGACHERIE, P. Evaluating digital soil mapping approaches for mapping GlobalSoilMap soil properties from legacy data in Languedoc-Roussillon (France).
GeodermaRegional, 4:20-30, 2015.
VIEIRA, S. A. et al. Estimation of biomass and carbon stocks: The case of the Atlantic Forest. Biota Neotropica, 8(2):21-29, 2008.
VIOLA, M. R. et al. Applicability of the LASH model for hydrological
simulation of the Grande River Basin, Brazil. Journal of
Hydrologic Engineering, 18(12):1639-1652, 2013.
VIOLA, M. R. et al. Impacts of Land-use changes on the hydrology
of the Grande River Basin Headwaters, Southeastern Brazil.
Water Resource Management, 28(13):4537-4550, 2014.
VIOLA, M. R. et al. Assessing climate change impacts on Upper
Grande River Basin hydrology, Southeast Brazil. International
Journal of Climatology, 35(6):1054-1068, 2015.
WIEKENKAMP, I. et al. Changes in measured spatiotemporal patterns of hydrological response after partial deforestation in a headwater catchment. Journal of Hydrology, 542:648-661, 2016.
ZHU, A. X. et al. Derivation of soil properties using a Soil Land
Inference Model (SoLIM). Soil Science Society of America