Rev Bras Cineantropom Hum
DOI: http://dx.doi.org/10.5007/1980-0037.2018v20n5p373
original article
Body fat percentage in adolescents from
Curitiba-PR metropolitan region: reference data
using LMS method
Percentual de gordura corporal em adolescentes de
Curitiba-PR e região metropolitana: dados de referência
utilizando o método LMS
Wagner Luis Ripka1
Eduardo Esmanhoto1
Leandra Ulbricht1
Abstract – Percentile indicators, aided in its development by biomedical engineering, relative to body fat distribution in adolescents are able to help health professionals in better diagnosing overweight and obesity. The aim of this study was to calculate percentile values to body fat in adolescents aged between 12 and 17 years from the Curitiba-PR and its metropolitan region composed of 29 municipalities, having as reference method the dual energy x-ray absorptiometry (DXA) technology. After applying inclusion criteria for the adolescents, anthropometric measures of body fat and stature were taken, as well as evaluation of the body composition through DXA. The statistical analysis was grounded in the presentation of percentilic values developed by Cole and Green’s LMS method, where L stands for the skewness curve, M for the mean curve and S for the variance curve.In total, 390 boys were evaluated. The fat percentage values tend to show a decrease between the ages of 12 (22.8±5.1%) and 16 years (17.9±2.9%). Moreover, for the superior percentiles: 90th and 97th re-start to increase at the age of 17 after showing a decrease in
the previous years. The L, M and S parameters, altogether with the percentiles created to evaluate body fat are interesting tools to tendency and evolution analyses, as well as to enable inferences to be made about the body composition of adolescents.
Key words: Adolescents; Body composition; Body fat distribution.
Resumo – Indicadores percentílicos referentes a distribuição da gordura corporal em adolescentes auxiliam profissionais da saúde em um melhor diagnóstico de sobrepeso e obesidade. O objetivo deste estudo foi calcular valores percentílicos para a gordura corporal de adolescentes com idades entre 12-17 anos de Curitiba-PR e região metropolitana formada ao todo por 29 municípios, tendo como método de referência a tecnologia de absorciometria de raios-X de dupla energia (DXA). Após a aplicação dos critérios de inclusão os adolescentes foram coletadas medidas antro-pométricas de massa corporal e estatura, além da avaliação da composição corporal com auxílio da DXA. A análise estatística teve como base a apresentação de valores percentílicos a partir do método LMS de Cole e Green, onde L representa a curva de assimetria, M a curva da média e S a curva da variação. Foram avaliados 390 meninos. Os valores de percentual de gordura tendem a apresentar um decréscimo entre as idades de 12 (22.8±5.1%) e 16 anos (17.9±2.9%). Além disso, para os percentis superiores: 90th e 97th voltam a crescer na faixa de 17 anos após
redução nas idades anteriores. Os parâmetros L, M e S e os percentis criados para percentual de gordura são ferramentas interessantes para análises de tendência e evolução, bem como para que
1 Universidade Tecnológica Federal do Paraná. Programa de Pós-Gra-duação em Engenharia Biomédica. Curitiba, PR. Brasil.
LMS to body fat percentage in adolescents Ripka et al.
INTRODUCTION
The excess of fat mass in adolescents is widely related to the appearance of
clinical evidence, such as: coronary heart diseases
1, respiratory problems
2,
type 2 diabetes
3and psycho-social complications
4. Regarding its diagnosis,
several direct and indirect methods are applied in clinical practice of body
fat assessment. Furthermore, the body-mass index (BMI), the skinfold
thickness (ST) and the bioelectrical impedance analysis (BIA) are the most
common methods applied to children and adolescents
5-13.
Another technique that ought to be highlighted is the dual energy
x-ray absorptiometry (DXA), based in photons’ attenuation measure,
generated by X-ray sources, in low and high density tissues, and it is also
considered, in various situations, as a reference method to the evaluation
of body composition
14-16.
Related to the chosen technique, another important factor is the
crea-tion of reference curves to present body fat values to teenagers, specially to
aid at diagnosis
17-19. In countries like Brazil, where more than two thirds
of the population use the public and free health system, the absence of a
proper classification of children and adolescents who are overweight or
obese might delay the diagnosis and consequent treatment of this
condi-tion, resulting in additional costs with comorbidity factors
20.
Therefore, this study aims to present percentile values to body fat from
Curitiba-PR metropolitan region, aged between 12 and 17, through the
use of the DXA technology as a reference method.
METHODOLOGICAL PROCEDURES
This research’s data were collected by convenience throughout the years
of 2014 and 2016, and included male adolescents, students, aged between
12 and 17 years, whose parents authorized their participation signing a
consent term. For the sample size, an error of 4.5% was specified at 91%
confidence level of a universe of 82,414 individuals
o
btained through the
national Brazilian database system (data of 2013 - Datasus). From this
research were excluded: a) students whose parents did not consent; b)
did not make use of medicines containing calcium; c) students who had
undergone radiography/CT scan procedures up to seven days prior to the
evaluation
21.
The subjects of the study were gathered from public and
private schools, as well as sports training centers from Curitiba-PR and
its metropolitan region composed of 29 municipalities. Data was collected
via suitably trained professionals.
functioning for the evaluation of body composition is related to the capacity
of technology to analyze low and high-density tissue simultaneously, which
would lead to a reduction in errors of body fat estimation. In this way, the
x-ray attenuation differences allow the body to be divided into fat, non-bone
tissue and bone. The body fat percentage (%BF) was obtained automatically by
the equipment’s software according to specifications of the study’s age range.
The data were presented with mean and standard deviations values
to the group, and segmented by age. The construction of the percentiles
was made using the LMS method by Cole and Green
21, 22, where L is the
skewness curve, M is the mean curve and S is the variance curve. These
three parameters were fit as cubic splines by nonlinear regression, and the
extent of smoothness required is expressed in terms of equivalent degrees of
freedom. Centiles are computed by using the values of the three parameters
to a given age with the formula:
Where: zα is the α-th centile to the distribution. The statistical analysis and further chart generation were performed using the LMS Chartmaker Pro Version 2.54 software program (Cambrige, UK)22.
This study was approved by the ethics committee
Plataforma Brasil
under the
number: 11583113.7.0000.5547 at
Universidade Tecnológica Federal do Paraná
,
in agreement with rules constant on the Resolution 196/96 from the National
Health Council (Conselho Nacional de Saúde). All parents or legally responsible
signed a consent term authorizing the participation of the adolescents.
RESULTS
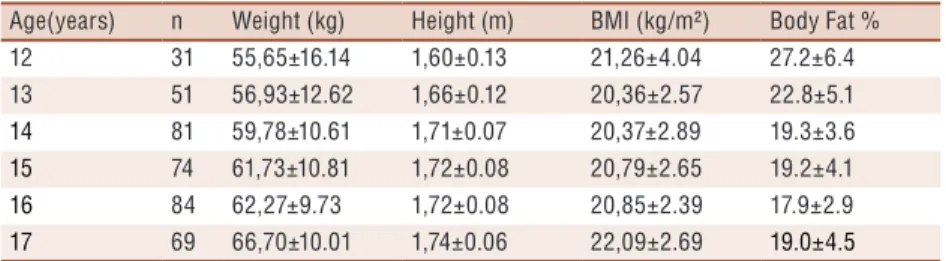
In total, 390 adolescents were evaluated. The descriptive analysis to body
fat percentage by age is shown in Table 1. The values of %BF decreased
between the ages of 12 (22.8±5.1%) and 16 (17.9±2.9%) years.
Table 1. Descriptive of sample. Mean and standard deviation for body fat percentage in adolescents (12-17 years).
Age(years) n Weight (kg) Height (m) BMI (kg/m²) Body Fat % 12 31 55,65±16.14 1,60±0.13 21,26±4.04 27.2±6.4 13 51 56,93±12.62 1,66±0.12 20,36±2.57 22.8±5.1
14 81 59,78±10.61 1,71±0.07 20,37±2.89 19.3±3.6
15 74 61,73±10.81 1,72±0.08 20,79±2.65 19.2±4.1
16 84 62,27±9.73 1,72±0.08 20,85±2.39 17.9±2.9
17 69 66,70±10.01 1,74±0.06 22,09±2.69 19.0±4.5
LMS to body fat percentage in adolescents Ripka et al.
Table 2. L, M and S values, and percentile of body fat percentage for adolescents aged 12 to 17 years.
Age (y) L M S 3th 10th 25th 50th 75th 90th 97th
12 0.04 28.46 0.22 18.71 21.40 24.50 28.46 33.02 37.71 42.97
13 -0.78 23.64 0.20 17.10 18.80 20.85 23.64 27.17 31.25 36.48
14 -1.53 19.93 0.17 15.31 16.47 17.90 19.93 22.65 26.10 31.18
15 -2.02 18.33 0.16 14.55 15.49 16.66 18.33 20.65 23.72 28.68
16 -2.19 17.69 0.15 14.17 15.04 16.13 17.69 19.87 22.80 27.70
17 -2.20 17.44 0.16 13.90 14.77 15.86 17.44 19.66 22.90 27.97
Figure 1. Smoothed LMS percentile curves for body fat percentage. Curves are for 3th, 10th, 25th, 50th, 75th, 90th, and 97th percentiles for male adolescents.
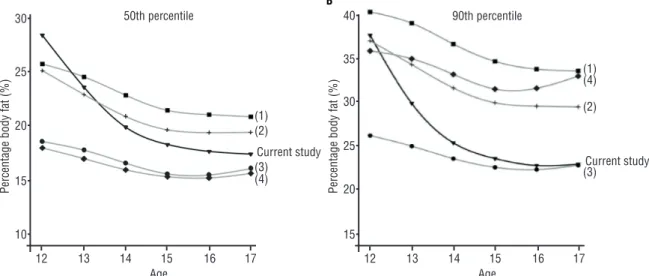
Figures 2 A and B illustrate a comparison between the 50th and the
90th percentiles from this study and researches involving U.S., Korean
and Turkish adolescents. In the 50th percentile the greatest values occur
in adolescents aging 12 years, with tendency to decrease the body fat at
the ages of 13, 14 and 15 years in all studies.
regularity in their behavior.
DISCUSSION
There are no findings regarding other studies utilizing DXA combined
with LMS analysis to generate percentile curves to Brazilian adolescents
(12 to 17 years). It should be noted that about 50% of the body mass is
obtained during the teenage hood. As a consequence, its monitoring
be-comes important to the development of actions that might contribute to
the health of this population
23. Moreover, using the LMS method to create
reference curves has been widely done around the globe, as it removes the
skewness of the distribution.
Around the world, studies of reference values based on fat percentage
of children and adolescents obtained through ST were related in Germany
(3-18 years)
5; Canada (6-19 years)
7;United States (5-18 years)
8; Turkey (6-18
years)
9;Brazil (7-10 years old)
19and India (10-19 years)
11. On the other hand,
studies that used DXA were found of the population of Denmark (8-14
years)
2); United States (8-19 years)
25and Korea (10-18 years)
10(10-19 years)
11.
For those who had DXA as a reference: Park et al.
11evaluated 689
asian teenagers aged between 12 and 16 years who reported a decrease of
the %BF in this age range, as shown in our results. In the 50
thpercentile
the values varied from 25.2% to 19.4%; in the 90
thpercentile the values
varied between 37.1% and 29.5%. In an epidemiologic study with 2.642
north-American adolescents, Odgen et al.
2also identified a reduction in the
%BF values in the 50
thand 90
thpercentiles in the age range, 25.8–20.9%
and 40.4–33.8%, respectively. In this study the values varied between
27.22–17.45% (50
thpercentile) and 37.71–22.80% (90
thpercentile). The %BF
values reduction could be explained could be explain by the physiological
tendency to increase the lean mass and reduce the fat mass of puberty
11.
Corroborating this information, a North American study of 8,269 children
and adolescents (5 to 18 years) found that the peak of %BF was in the range
of 11-12 years for boys with subsequent decrease in ages
26. Another factor
to be highlighted is the variability of the samples’ profile, where different
countries have different ethnic and anthropometric characteristics which
can influence the percentile curves
27. Strengthening the need for different
distribution curves for different countries.
Regarding the creation of Brazilian reference values there should be
highlighted Conde and Monteiro’s
13study, in which values were proposed
based on the BMI of 26.102 people aging between 2 and 19 years, collected
in the national study. However, to use this index as an indicator to
over-weight and obesity should be done carefully, since the technique applied
is not able to differentiate muscular mass from lean mass
28.
north-LMS to body fat percentage in adolescents Ripka et al.
east region with 2.352 individuals (1.129 between 12-16 years)
29. Despite
in all studies the LMS method was used to generate reference curves, the
tools chosen to obtain the %BF limit the comparison to this present study.
Silva, Baxter-Jones and Maia
29found smaller values of all ages and
percentiles compared to this study. The 50
thpercentile values are: 12.60%
(12 years), 12.00% (13 years), 11.23%(14 years), 10.89%(15years) and
10.98% (16 years). Whereas Cintra et al.
6present values that are close to
this study, 16.4% (50
thpercentile) and 29.7% (90
thpercentile), considering
a group of 909 individuals aging between 13 and 15 years. As to the ST,
authors report that this method’s limitation is primarily due to the
evalu-ator’s hability, given that their experience is a fundamental factor on the
collected data precision. Moreover, the second reason is that the
obten-tion of the body fat percentage depends on the choice of a great variety of
equations that might make the results less precise
16, 30.
The DXA provides better results for the %BF estimate when compared
to anthropometric techniques such as BMI, ST or BIA
10,14,16. In fact, all
methods have limitations and some measurement error in the evaluation
of %BF, however the advantages of indirect laboratory tests include good
accuracy and reproducibility
28. Thus, the use of DXA for development of
reference curves for body fat may represent an advancement in how health
professionals interpret body composition, strengthening the data presented
in this study.
Nevertheless, some limitations ought to be raised in this research. Firstly,
the fact that the sample does not represent the whole Brazilian population
nor a whole region, to each age. Secondly, the maturity state of the
ado-lescents is not controlled, even though it contributes to body fat changes.
CONCLUSION
In conclusion, the parameters L, M and S, and the percentiles created to
body fat percentage are interesting tools to tendency and evolution analyses,
as well as to infer about nutritional status of adolescents. Due to the fact
Brazil is a country of continental dimensions, it is strongly advised constant
evaluation and correction of the reference parameters of fat percentage in
Brazilian children and teenagers, specially since this phase is critical as to
the acquisition of anthropometric characteristics.
COMPLIANCE WITH ETHICAL STANDARDS
Funding
This research was funded by Research Program of S
istema
Único
de Saúde:
Gestão Compartilhada em Saúde
PPSUS - edition 04/2012.
Conflict of interest statement
Ethical approval was obtained from the local Human Research Ethics
Committee at
Universidade Tecnológica Federal do Paraná
under the number
:
11583113.7.0000.5547, and the protocol was written in accordance with
the standards set by the Declaration of Helsinki.
Author Contributions
Conceived and designed the experiments: WLR, LU. Performed the
ex-periments: WLR and EM. Analyzed the data: WLR. Contributed reagents/
materials/analysis tools: LU. Wrote the paper: WLR and EM.
REFERENCES
1. Rank M, Siegrist M, Wilks DC, Langhof H, Wolfarth B, Haller B, et al. The cardio-metabolic risk of moderate and severe obesity in children and adolescents. J Pediatr 2013;163(1):137-42.
2. Tenório LHS, Santos AC, Oliveira AS, Lima AMJ, Brasileiro-Santos MS. Obesity and pulmonary function tests in children and adolescents: a systematic review. Rev Paul Pediatr 2012;30(3):423-30.
3. Copeland KC, Silverstein J, Moore KR, Prazar GE, Raymer T, Shiffman RN, et al. Management of newly diagnosed type 2 diabetes mellitus (T2DM) in children and adolescents. Pediatrics 2013;131(2):364-82.
4. Feldmann LRA, Mattos AP, Halpern R, Rech R, Bonne CC, Araújo MB. Impli-cações psicossociais na obesidade infantil em escolares de 7 a 12 anos de uma cidade Serrana do Sul do Brasil. Rev Bras Obes Nutr Emagrecimento 2012;3(15):225-33.
5. Schwandt P, von Eckardstein A, Haas GM. Percentiles of Percentage Body Fat in German Children and Adolescents: An International Comparison. Int J Prev Med 2012;3(12):846-52.
6. Cintra IDP, Ferrari GLdM, Soares ACdSV, Passos MAZ, Fisberg M, de Souza Vitalle MS. Body fat percentiles of Brazilian adolescents according to age and sexual maturation: a cross-sectional study. BMC Pediatr 2013;13(96):1-8.
7. Kuhle S, Maguire B, Ata N, Hamilton D. Percentile curves for anthropometric measures for Canadian children and youth. Plos One 2015;10(7):e0132891.
8. Laurson KR, Eisenmann JC, Welk GJ. Body fat percentile curves for US children and adolescents. Am J Prev Med 2011;41(4):S87-S92.
9. Kurtoglu S, Mazicioglu MM, Ozturk A, Hatipoglu N, Cicek B, Ustunbas HB. Body fat reference curves for healthy Turkish children and adolescents. Eur J Pediatr 2010;169(11):1329-35.
10. Kim K, Yun SH, Jang MJ, Oh KW. Body fat percentile curves for Korean children and adolescents: a data from the Korea National Health and Nutrition Examination Survey 2009-2010. J Korean Med Sci 2013;28(3):443-9.
11. Park HW, Yoo HY, Kim C-H, Kim H, Kwak BO, Kim KS, et al. Reference values of body composition indices: the Korean National Health and Nutrition Examination Surveys. Yonsei Med J 2015;56(1):95-102.
12. Frignani RR, Passos MAZ, de Moraes Ferrari GL, Niskier SR, Fisberg M, de Pádua Cintra I. Reference curves of the body fat index in adolescents and their association with anthropometric variables. J Pediatr (Rio J) 2015;91(3):248-55.
13. Conde WL, Monteiro CA. Body mass index cutoff points for evaluation of nutrition-al status in Brazilian children and adolescents. J Pediatr (Rio J) 2006;82(4):266-72.
LMS to body fat percentage in adolescents Ripka et al.
CORRESPONDING AUTHOR Wagner Luis Ripka
Avenida Sete de Setembro 3165 Rebouças, Curitiba, PR, Brasil. CEP: 80230-901
E-mail: ripka.w@gmail.com 15. Wells JC, Haroun D, Williams JE, Wilson C, Darch T, Viner RM, et al.
Evalu-ation of DXA against the four-component model of body composition in obese children and adolescents aged 5–21 years. Int J Obes 2010;34(4):649-55.
16. Silva DR, Ribeiro AS, Pavão FH, Ronque ER, Avelar A, Silva AM, et al. Vali-dade dos métodos para avaliação da gordura corporal em crianças e adolescentes por meio de modelos multicompartimentais: uma revisão sistemática. Rev Assoc Med Bras 2013;59(5):475-86.
17. Plachta-Danielzik S, Gehrke MI, Kehden B, Kromeyer-Hauschild K, Grillen-berger M, Willhoeft C, et al. Body fat percentiles for German children and ado-lescents. Obes Facts 2012;5(1):77-90.
18. World Health Organization, WHO. Adolescent Health. Geneva. 2014; Available from: <http://www.who.int/topics/adolescent_health/en/>[2014 ago 2].
19. Frainer DES, Vasconcelos FdAGd, Costa LdCF, Grosseman S. Body fat distribu-tion in schoolchildren: a study using the LMS method. Rev Bras Med Esporte 2013;19(5):317-322.
20. Saúde ANd. Agência Nacional de Saúde Suplementar: Rio de Janeiro. 2015; Avail-able from: <http://www.ans.gov.br>[14 jan 2015].
21. Barbetta PA. Estatística aplicada às ciências sociais: Florianópolis:UFSC; 2008.
22. Cole TJ, Green PJ. Smoothing reference centile curves: the LMS method and penalized likelihood. Stat Med 1992;11(10):1305-19.
23. Sigulem DM, Devincenzi MU, Lessa AC. Diagnóstico do estado nutricional da criança e do adolescente. J Pediatr (Rio J) 2000;76(Suppl 3):s275-s84.
24. Wohlfahrt-Veje C, Tinggaard J, Winther K, Mouritsen A, Hagen C, Mieritz M, et al. Body fat throughout childhood in 2647 healthy Danish children: agreement of BMI, waist circumference, skinfolds with dual X-ray absorptiometry. Eur J Clin Nutr 2014;68(6):664-70.
25. Ogden CL, Li Y, Freedman DS, Borrud LG, Flegal KM. Smoothed percentage body fat percentiles for US children and adolescents, 1999-2004. Natl Health Stat Report 2011;9(43):1-7.
26. Laurson KR, Eisenmann JC, Welk GJ. Body Fat Percentile Curves for Us Children and Adolescents. Am J Prev Med 2011;41(4):s87-s92.
27. Nawarycz T, So HK, Choi KC, Sung RYT, Li AM, Nelson, EAS et al. Waist-to-height ratio as a measure of abdominal obesity in southern Chinese and European children and adolescents. Int J Obes 2016;40(7):1109-18.
28. Guedes, DP. Procedimentos Clínicos Utilizados Para Análise Da Composição Corporal. Rev bras cineantropom desempenho hum 2013;15(1):113-29.
29. Silva S, Baxter-Jones A, Maia J. Fat Mass Centile Charts for Brazilian Children and Adolescents and the Identification of the Roles of Socioeconomic Status and Physical Fitness on Fat Mass Development. Int J Environ Res Public Health 2016;13(2):151.