1. INTRODUCTION
1.1. Traffic congestion
In most of major cities, population and motorization are growing at a faster pace than infrastructure, so congestion happens because supply cannot satisfy demand. Dealing with traffic congestion is becoming a daily-life reality for many inhabitants of major cities (Downs, 2004).
Traffic congestion is an externality of our decisions to travel by car, thus when we make a trip we impose delays on others. Technically, it occurs when traffic flows too close to the capacity of the network. Congestion is gener-ally divided into two categories: recurrent and non-recurrent congestion. Recurrent congestion occurs at regu-lar times at a site, mostly during peak periods, and in-creases travel times. Non-recurrent congestion occurs at non-regular times at a site. It is unexpected by the driver and occurs due to incidents such as accidents, vehicle breakdowns, work zones, special events or other foreseen loss of road capacity (Dowling et al., 2004). Although both recurrent and non-recurrent congestion create variable travel times, non-recurrent congestion creates unpredictable travel times.
1 Gaële Lesteven, CRIA-UMR Géographie-Cités, Institut de Géographie, University of Paris 1 Panthéon-Sorbonne, Paris, France. (e-mail: gaele.lesteven@yahoo.fr).
2 Bianca Bianchi Alves, Departamento de Engenharia de Transportes, Es-cola Politécnica, Universidade de São Paulo, São Paulo, SP, Brasil. (e-mail: biancaalves@gmail.com).
Manuscrito recebido em 19/4/2011 e aprovado para publicação em 8/8/2011. Este artigo é parte de TRANSPORTES v.19, n.2, 2011. ISSN: 2237-1346 (online).
The objective of this research is to analyze impacts on household travel behavior due to travel time increase and travel time variability increase in two major cities, Paris and São Paulo. Besides socio-economic and cultural differ-ences, these major cities are characterized by different ur-ban forms and rates of motorization, both presenting high levels of traffic congestion. This paper aims to answer three main questions. (1) What types of behaviors do travelers state when facing increasing travel times? (2) Do they re-spond differently when congestion increases variability in travel time but do not modify average travel times? (3) Do travelers state similar behaviors in two different megalopo-lises?
The structure of this paper is as follows. Section 1.2 out-lines general characteristics of each city. Section 2 presents the methodology and the sample. Section 3 depicts main re-sults and conclusions are drawn in section 4.
1.2. Motorization, daily mobility and traffic congestion in São Paulo and Paris
The data presented in this section, otherwise noted, were obtained from two household travel surveys: the 2007 Ori-gin-Destination Survey developed by the São Paulo Sub-way Company (METRÔ, 2007) and the 2001 Enquête Globale Transport developed by the Direction Régionale de l’Equipement d’Ile-de-France (DREIF, 2001). A French national household travel survey, with a small Ile-de-France sample, was conducted in 2008. This survey under-lined a stability of travel patterns. Therefore, the 2001 sur-vey, although not recent, is still valid for current analysis.
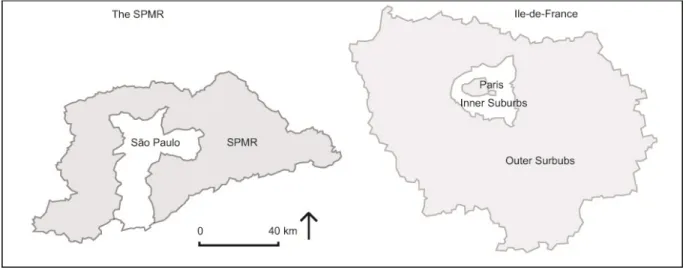
São Paulo is the 4th most populous city in the world (UN, 2009), with an estimated population of approximately 11 million residents within an area of 1,509 square kilometers
findings from São Paulo and Paris
Gaële Lesteven1 e Bianca Bianchi Alves2
Resumo: Este estudo apresenta o conjunto de respostas comportamentais ao congestionamento em duas cidades, São Paulo e Paris. Uma pesquisa de respostas declaradas (jogo de simulação) foi realizada em São Paulo (2009) e Paris (2010) para indentificar o proces-so de escolha do domicílio diante de congestionamento recorrente (tempos de viagem maiores) e não-recorrente (tempos de viagem va-riáveis e imprevisíveis). As respostas comportamentais declaradas foram organizadas em cinco grupos: ajustes marginais, alterações de modo, alterações espaciais, alterações temporais e alterações radicais. Um conjunto de respostas comportamentais semelhante foi veri-ficado em São Paulo e Paris, mas diferentes frequências de ocorrência segundo tipo de viagem (compulsória, não-compulsória e dia in-teiro) e tempo de viagem (mais de 30 minutos) foram observadas. Observou-se que respondentes em Paris apresentam comportamentos menos flexíveis do que em São Paulo, i.e.; para eles, o limiar para alterações de comportamento ocorreu para níveis de congestiona-mento piores.
Palavras-chave: respostas ao congestionamento, comportamento de viagem, métodos de respostas declaradas.
Abstract: This paper presents household behavioral responses to traffic congestion in two major cities, São Paulo and Paris. An inter-active stated response survey (simulation game) was conducted in São Paulo (2009) and Paris (2010) to identify and understand house-hold choice process when facing both recurrent congestion (longer travel times) and non-recurrent congestion (variable and unpredict-able travel times). Stated behavioral responses were organized in five groups: marginal adjustments, modal alterations, spatial altera-tions, temporal alterations and radical alterations. A similar behavioral response range was found for São Paulo and Paris, but different frequencies depending on the type of trip (compulsory, non-compulsory and whole day) and the revealed trip duration (more than 30 minutes) were observed for both cities. Paris respondents appeared to be less “flexible” than São Paulo respondents, i.e.; their threshold for behavior alteration occurred at worse traffic congestion conditions.
(IBGE, 2008). Its metropolitan region (SPMR) comprises 39 cities with a population of 19.5 million inhabitants within an area of 8,000 square kilometers. Population and employment occur mainly in the central region of SPMR (the city of São Paulo); around 60% of the metropolitan re-gion population lives and/or works there.
The city of Paris is less populated. 2 millions of inhabi-tants live in an area of 105 square kilometers (INSEE, 2006). The city has a higher density than São Paulo city; approximately 19 thousand inhabitants per square kilometer against 7 thousand in São Paulo. Its metropolitan region (Ile-de-France) has a population of 11.5 millions inhabi-tants within an area of 12,000 square kilometers, which classifies Ile-de-France as a major metropolis in the world. Population (57%) and employment (67%) are mainly con-centrated in Paris and its inner suburbs.
Table 1 presents data on transport supply and travel de-mand in the two metropolitan areas, in order to understand the context in which metropolitan households live and travel. Some items deserve attention, especially the motori-zation rate and the public transport network.
Motorization rate in Ile-de-France is 410 cars/1000 in-habitants compared to 180 cars/1000 inin-habitants in SPMR. Mobility (in motorized trips/inhabitant) is also greater in France (2.3 against 1.3 in SPMR). Although Ile-de-France residents own many more cars than SPMR residents do, on average they do not use it as often, as the trip gen-eration does not follow the same proportion as the mobility index. Moreover, SPMR residents are traveling for longer periods, as average travel time is more than twice than in
Ile-de-France.
SPMR owns a short but efficient subway system. Its ex-tension of 71 km, a lower length than the Paris subway (214 km), carries 3.4 million passengers per day (against 2.2 million passengers per day in Paris). The bus system remains the main public transport mode in SPMR (9 mil-lion of trips/day against 1.8 in Ile-de-France). Besides the Parisian subway, the suburban rail system carries 2.5 mil-lion passengers per day.
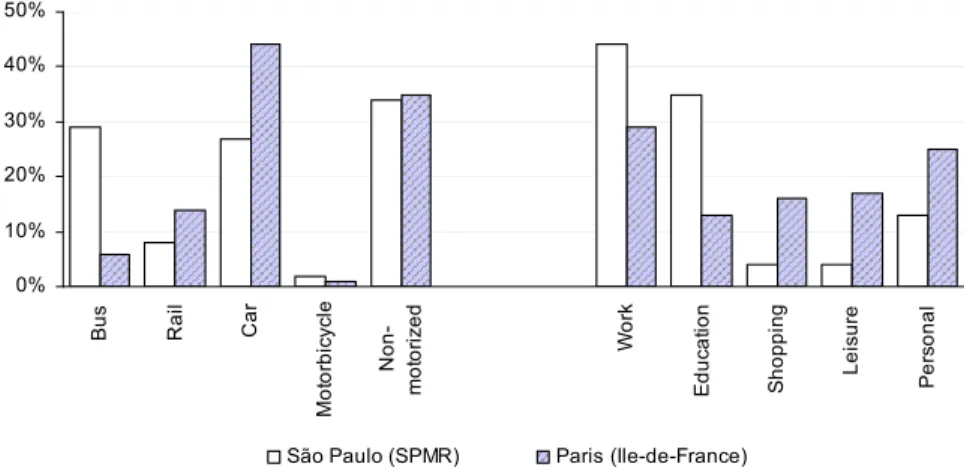
Figure 2 depicts mode share and trip purposes for the two metropolitan areas. Work and education trips are still dominant in SPMR (79%), while shopping, leisure and per-sonal trips represent a larger share in Ile-de-France (58%). In Ile-de-France, people travel mainly by car, (44% against 27% in SPMR). Bus share in Ile-de-France is lower (6% against 29% in SPMR) but rail share is higher (14% against 8% in SPMR). In Paris city, on the other hand, car share is only 18%, against 41% in São Paulo city and 59% in Ile-de-France outer suburbs. In Ile-Ile-de-France, private car own-ership is much higher in the outer suburbs, where transit network is less efficient. The opposite occurs in SPMR where motorized households are more concentrated in São Paulo city. In SPMR, the motorization rate seems to reflect the income distribution.
The average traffic speed on São Paulo main arterials has been decreasing. During the evening peak hours, it fell from 19.4 km/h in 2000 to 14.8 km/h in 2008 (CET, 2010). Daily average speed on main Parisian arterials has dropped from 18.1 km/h in 1998 to 15.7 km/h in 2007. Contrary to São Paulo, traffic volume has decreased by 25% during the
Figure 1. Study zones
Table 1. Data on transport supply and travel demand in SPMR and Ile-de-France (METRÔ 2007, INSEE 2006, DREIF 2001)
Data São Paulo (SPMR) Paris (IDF)
Population (millions of inhabitants) 19.5 11.5
Area (km2) 8,000 12,000
Subway system (km) 61 200
Rail system (km) 261 1,375
Number of cars (million) 3.6 4.6
Motorization (cars/1000 inhabitants) 180 410 General mobility (trips/inhabitant) 2.0 3.5 Motorized mobility (motorized trips/inhabitant) 1.3 2.3 Trips per day all modes (million) 38.1 35 Trips per day by car (million) 10.4 15.5 Average travel time by car/ two-wheelers (min) 31 22 Average travel time by transit (min) 67 45
same period because of the municipality policy to reduce car use in Paris (Mairie de Paris, 2010).
In SPMR, traffic congestion is worse in São Paulo city, although some suburban areas have been also starting to experience congestion. The highest income groups that use cars intensively and mainly live in São Paulo city invest much more time, space and money to travel around and so contribute to traffic congestion (Vasconcellos, 2005). In Ile-de-France, traffic congestion is, spatially and socially, more spread out. It occurs mainly on expressways in the suburbs (DIRIF, 2010), where middle and low middle classes live. Real estate prices in Paris encourage people and jobs to move from Paris to the suburbs. The public transport system is efficient within Paris and for linking the suburbs to Paris but less within the suburbs traveling, for which car is preferred.
2. INTERACTIVE STATED RESPONSE SURVEY
2.1. The method
In order to understand how drivers adapt their travel and activity patterns to a congested situation, an interactive stated adaptation survey is proposed. A stated adaptation survey is a type of stated response survey that simulates the respondents’ reactions to selected types of constraints (for a review of stated response methods see Lee-Gosselin, 1996). The best-known example of a simulation-based tech-nique is HATS (Household Activity and Travel Simulator) developed by Jones (1980). It gave rise to the development of several types of surveys regarding inexperienced condi-tions of transport (Lee-Gosselin, 1990; Kurani et al., 1994; Andan and Faivre d’Arcier, 2000; Lejoux and Raux, 2009; Weis et al., 2010).
The method has 2 stages: 1) The respondent fills up a trip diary listing all trips, for whatever purpose or mode of transport used, during several sequential days. 2) During an in-depth face-to-face interview, the respondent reacts to hypothetical situations built up based on the trip diary. Sev-eral times the interviews are conducted with more than one member of the household present, even if only one individ-ual is participating in the survey. Using this method, the re-spondent can appreciate the potential consequences of the hypothetical situations on his or her activity pattern (or on others) and all present can check the validity of stated re-sponses. Furthermore, increasing constraints during the
game forces the respondent to adopt behavioral strategies. The aim of the method is not to reach behavioral represen-tativeness but to explore and understand the choice process. For this reason, the sample (15 to 20 households) is small (Lee-Gosselin, 1996).
2.2. The sample
The survey took place in two metropolitan regions: São Paulo (in September and October 2009) and Paris (a first round in January and February 2010 and a second round in May and June 2010). All selected households owned at least one car and used it several times a week. Only fre-quent car users of the household were interviewed. Even if only one member of the household was interviewed, all adult members of the household had previously filled a trip diary, during a whole week in Paris and three subsequent days in São Paulo, in order to identify travel and activity decisions which have been taken within the household.
17 SPMR households (12 men and 11 women) and 23 Ile-de-France households (16 men and 15 women) partici-pated in the survey. They were mostly recruited by indirect relationships; 25% of the Ile-de-France household sample was selected by a random recruitment, using a door-to-door interview list for two suburban towns. All respondents were offered a gift at the end of the interview.
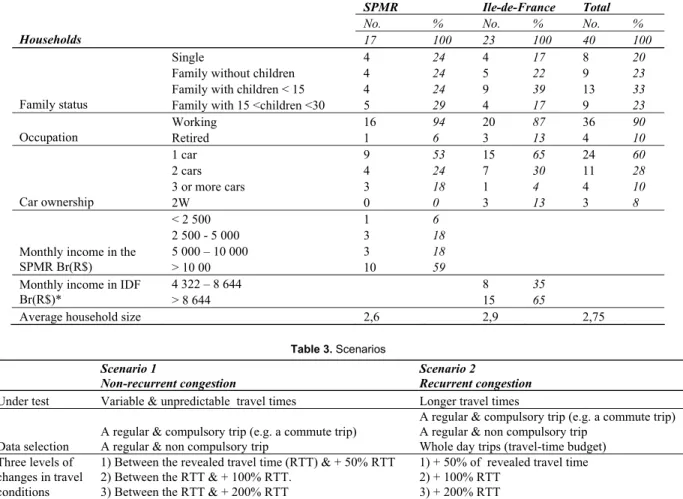
Table 2 presents the main socio-economic characteristics of households and respondents. Public transport use in Ile-de-France was much more frequent; 39% of the 31 respon-dents in Ile-de-France said they use it more than once a week, against only 13% of the 23 respondents in SPMR. In SPMR, motorized two-wheelers were not available in any of the households, despite its rapidly growing presence. This might have occurred since motorized two-wheelers are, in SPMR, a phenomena common in lower income households, which were not frequent in the sample. No lower income households were interviewed in France. Households came from all parts within Ile-de-France (4 from Paris city, 9 from inner suburbs and 10 from outer suburbs) and SPMR (12 from São Paulo and 5 from SPMR).
2.3. A set of scenarios
The one-hour interview took place at the respondents’ home. The interviewer initiated by reminding the respon-dent about the contents of the trip diary and selecting, with his/her help, three types of trips. Most of the time, the
com-0% 10% 20% 30% Bu s Rail Car M o to rb ic yc le No n-mo to ri ze d Wo rk E duc at io n S hop pi n g Leis u re P e rs onal
São Paulo (SPMR) Paris (Ile-de-France)
pulsory trip was a commute trip or a drop children off to school trip. The selected non-compulsory trip occurred mostly for shopping or leisure. The travel-time budget was the sum of the trips made during a representative week day. Then, respondents’ reactions to scenarios were “tape” re-corded.
The 1st scenario considered non-recurrent congestion, presenting variable and unpredictable travel times. The 2nd scenario considered recurrent congestion, presenting longer travel times. For both scenarios, both compulsory and non-compulsory trips were taken into account. For the 2d sce-nario, whole day trips (travel time budget) were computed in an “all trips” scenario. Scenarios are presented in Table 3. For simplicity, in the analysis (section 3), regular com-pulsory trip will be called “business”, regular non-compulsory trip “non-business” and whole day trips “all”. SPMR will be named simply “São Paulo” and Ile-de-France simply “Paris”.
3. QUANTITATIVE FINDINGS: DESCRIPTION OF BEHAVIOURS
3.1. Typology of behaviors: from marginal adjustment to radical alteration
One aim of the survey was to establish an exhaustive list of behavioral responses to traffic congestion (Mokhtarian et al., 1997). Respondents often selected two or three differ-ent adaptations for a same scenario. All responses were listed and counted and 14 different behavioral responses
were found. All responses occurred both in Paris and São Paulo, with one difference: The São Paulo “other mode” was split into three options for Paris (public transport, mo-torized two-wheelers and walk).
Regarding their impacts on household travel and activity patterns, the behavioral responses can be organized in five groups. Group 1 consists of marginal adjustments (“main-tain behavior”, “leave earlier, “change route”). The four remaining groups are composed of behavioral alterations. Group 2 is modal alterations (“other mode”, “carpooling”). Group 3 is spatial alterations (“change destination”, “trip chaining”, “work from home”), and group 4 temporal al-terations (“reschedule”, “decrease frequency”, “change shift”). Modal, spatial and temporal alterations affect household travel patterns and even activity patterns. Radi-cal alterations, which name the group 5 (“quit”, “quit job”, “move”), are ruptures in the activity pattern.
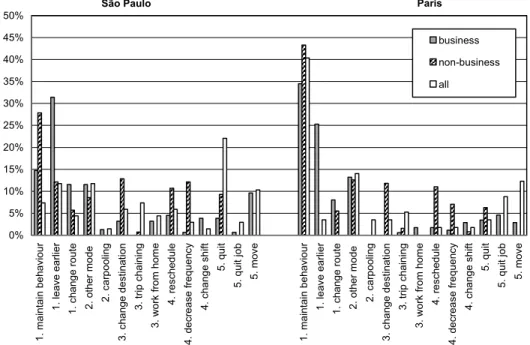
3.2. Different responses for different types of trips Figure 3 presents the frequency of the sum of behavioral responses for both scenarios for three tested types of trips: “business”, “non-business”, and “all”. It is interesting to notice that when facing “all” trips, respondents show a wider range of behaviors, both for São Paulo and Paris data. Furthermore, for “all” trips, alteration behaviors ap-pear more frequently than when respondents face only one type of trip (“business” or “non-business”).
Despite respondents choosing mainly marginal adjust-ment measures for both “business” and “non-business” trips, the ones traveling for non-business related activities
Table 2. The sample
SPMR Ile-de-France Total
No. % No. % No. %
Households 17 100 23 100 40 100
Single 4 24 4 17 8 20
Family without children 4 24 5 22 9 23
Family with children < 15 4 24 9 39 13 33
Family status Family with 15 <children <30 5 29 4 17 9 23
Working 16 94 20 87 36 90 Occupation Retired 1 6 3 13 4 10 1 car 9 53 15 65 24 60 2 cars 4 24 7 30 11 28 3 or more cars 3 18 1 4 4 10 Car ownership 2W 0 0 3 13 3 8 < 2 500 1 6 2 500 - 5 000 3 18 5 000 – 10 000 3 18
Monthly income in the
SPMR Br(R$) > 10 00 10 59
4 322 – 8 644 8 35
Monthly income in IDF
Br(R$)* > 8 644 15 65
Average household size 2,6 2,9 2,75
Table 3. Scenarios Scenario 1
Non-recurrent congestion
Scenario 2
Recurrent congestion Under test Variable & unpredictable travel times Longer travel times Data selection
A regular & compulsory trip (e.g. a commute trip) A regular & non compulsory trip
A regular & compulsory trip (e.g. a commute trip) A regular & non compulsory trip
Whole day trips (travel-time budget) Three levels of
changes in travel conditions
1) Between the revealed travel time (RTT) & + 50% RTT 2) Between the RTT & + 100% RTT.
3) Between the RTT & + 200% RTT
1) + 50% of revealed travel time 2) + 100% RTT
are more inclined to perform intermediate alterations in their behavior (change mode, carpooling, trip chaining, re-scheduling, and change shift). When faced with higher de-grees of congestion, respondents will present more radical behaviors for business trips than for non-business trips.
Figure 3 also shows that Paris respondents were in gen-eral more willing to change modes than São Paulo respon-dents were. However, while Paris responrespon-dents would also choose to walk or to use a motorized two-wheeler as an al-ternative mode, São Paulo respondents would predomi-nantly choose public transport modes, so that the frequency
of respondents choosing public transport is higher in São Paulo.
Figure 4 presents the frequency of the sum of behavioral responses for both scenarios for “business” and “non-business" trips. The responses were grouped in 3 classes (group 1 – marginal adjustment, groups 2, 3 and 4 – altera-tion and group 5 – radical alteraaltera-tion). The individuals were classified by trip duration. Short trips had a revealed travel time equal or less than 30 minutes and long trips had with a revealed travel time more than 30 minutes. Both for “busi-ness” and “non-busi“busi-ness” trips, respondents seem to
per-0% 5% 10% 15% 20% 25% 30% 35% 40% 1. mai n ta in b e ha vi our 1. lea ve earl ier 1. ch an ge rout e 2. o the r mode 2. car poo lin g 3. c ha n ge de st in at io n 3. tri p c hai nin g 3. w ork fr om ho m e 4. r e sc he dul e 4. d e cr eas e f requ en cy 4. ch an ge shi ft 5. qu it 5. qui t jo b 5. mo ve 1. mai n ta in b e ha vi our 1. lea ve earl ier 1. ch an ge rout e 2. o the r mode 2. car poo lin g 3. c ha n ge de st in at io n 3. tri p c hai nin g 3. w ork fr om ho m e 4. r e sc he dul e 4. d e cr eas e f requ en cy 4. ch an ge shi ft 5. qu it 5. qui t jo b 5. mo ve non-business all
Figure 3. Behavioral responses for business, non-business and all trips in São Paulo and Paris
"Business" trips 0% 20% 40% 60% 80%
São Paulo Paris São Paulo Paris
<30 >30
marginal adjusment alteration radical alteration "Non-business" trips 0% 20% 40% 60% 80%
São Paulo Paris São Paulo Paris
<30 >30
marginal adjusment alteration radical alteration
form more marginal adjustments for shorter trips. For longer trips, alteration behaviors appear more frequently. 3.3. Behavioral Thresholds
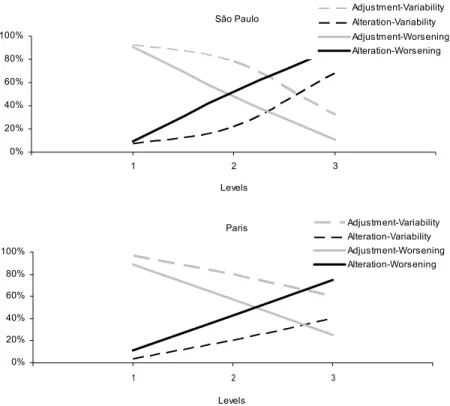
Figure 5 presents the frequency of marginal adjustments and alterations across the 3 levels (+50%, +100%, +200%) for each of the two scenarios, for São Paulo and Paris busi-ness trips. Since there is a gradual worsening of congestion across the 3 levels, there is a gradual decrease in marginal adjustment behaviors and an increase of alteration behav-iors. The point where the curves cross can be considered the threshold, in which respondents start to alter their be-havior more than they would adjust it. This threshold can be a function of several respondents’ socio-economic char-acteristics such as income levels, family status, car owner-ship, or access to public transport. Moreover, it can be a function of the city urban form.
When analyzing behavioral responses from São Paulo and Paris, we observe that Paris respondents choose consis-tently more marginal adjustments than São Paulo respon-dents do. When altering behavior, they will mostly select transport mode alterations: public transport first, motorized two-wheelers next and walking last. In São Paulo, despite change of mode being chosen more often only when only when congestion is extreme, other types of alteration be-haviors start to appear consistently when travel times dou-ble (+100%). As the graph below shows, the threshold for Paris occurs for both scenarios later than the threshold for São Paulo. For instance, if we consider scenario 2 (longer travel times), the threshold for São Paulo occurs at around the second level (+100%), while in Paris it occurs some-where between the second (+100%) and third (+200%) lev-els.
Another interesting observation can be made in the com-parison between scenarios 1 and 2 on Figure 5. Both for
São Paulo and Paris, the threshold of behavior alteration for the variability scenario (scenario 1) occurs after (to the right of) the threshold for the worsening scenario (scenario 2). This is also the case for “non business” and “all” trips.
Several studies state that reliability of travel time is val-ued more highly than travel time itself (Alves and Strambi, 2010; de Jong et al., 2009; Lam and Small, 2001). There-fore, one would expect that when facing variability (sce-nario 1), individuals would state more behavior alterations than when facing a non-variable scenario (scenario 2). This means that alterations would be starting at a lower level when facing variability, i.e., the dotted curves would be to the left of the continuous lines on the graph. There are two possible reasons for this apparent inconsistency. The first reason is relative to a possible incorrect comprehension of the scenarios. Since respondents are accustomed to a cer-tain degree of variability, it is possible that respondents fac-ing the non-variable scenario (scenario 2) assumed some recurrent variability. Therefore, this presumed variability for scenario 2 would lead it to be always worse than sce-nario with variability but lower average travel time (sce-nario 1). The second reason relates to the way sce(sce-nario lev-els were defined. If we compare scenarios 1 and 2 level 1 (+ 50%) for a reported travel time of 20 minutes, the aver-age travel time for the first scenario will be 25 minutes (from 20 to 30 minutes) against 30 minutes (with no vari-ability) for the second scenario. Therefore, even with the importance of reliability - generally represented by the standard deviation of the distribution - being higher than travel time, we can have the situation pictured on the above graphs.
4. CONCLUSION
When facing growing congestion, behavioral responses São Paulo 0% 20% 40% 60% 80% 100% 0 1 2 3 4 Levels Adjustment-Variability Alteration-Variability Adjustment-Worsening Alteration-Worsening Paris 0% 20% 40% 60% 80% 100% 0 1 2 3 4 Levels Adjustment-Variability Alteration-Variability Adjustment-Worsening Alteration-Worsening
sponses when facing congestion worsening for whole day trips (“travel time budget”) in opposition to when facing only one specific trip. One reason for this could be that, when facing longer travel times exclusively for one type of trip, respondents assume they can rearrange their travel time budgets so that it remains constant, thus responding with only marginal adjustments for this specific trip.
Paris respondents showed a relatively low rate of re-sponse “change to public transport” when compared to São Paulo, especially when whole day trips were considered. One would expect the opposite, since there has been mas-sive resources being invested by governments in public transport in Paris throughout the years (IAU-IDF, 2010), supported by general public opinion in favor of public transport. This findings are in agreement with Massot et al. (2006). The author found (for Paris and Lyon) that even when public transport is an alternative for car users, i.e., when the shift to public transport would maintain their mo-bility patterns without increasing their travel time budget, the reduction of car use is only marginal.
In all scenarios, for compulsory, non-compulsory and whole day trips, for both short and long travel times, Paris respondents presented less flexible behaviors; i.e., their threshold for behavior alterations (such as modal, spatial and temporal alterations) occurred at worse congestion con-ditions than in São Paulo. Weis et al. (2010), who tested the scenario of longer travel times in Zurich, Switzerland, also found that people are reluctant to change their trans-port and activity patterns. They are very selective when making adaptations to their routine, even under extreme circumstances. As Zurich travelers, Ile-de-France travelers seem to think that altering their transport patterns will not result in greater utility, even when travel times increase considerably.
We assume that the lower flexibility in the Paris sample is related to cultural issues, built upon long exposure to a different urban environment. The differences in availability of travel options and transport alternatives to the car cer-tainly contribute to that. We suspect that, contrary to Ile-de-France where spatial stability makes transport choices to be made upon “mature” circumstances, in SPMR - a metro-politan region in transformation - respondents envision that behavior alterations could result in a greater utility and state behavior alterations more often. This point will deserve some further exploration.
This paper raises important differences in travel behavior when considering two different megalopolises with severe congestion problems. Although some reasons for theses dif-ferences are pointed out in this text, the objective of this work was to collect and describe the full range of behav-ioral responses to congestion. A version of the HATS tech-nique was used in order to widen the spectrum of responses obtained when compared with standard stated preference techniques. An extension of the theme presented here would include investigating the reasons for the observed differences in behavior flexibility. Further contributions could explore responses to congestion in light of land use aspects such as real state price inequalities, residential mo-bility and land use regulations.
Professor Gabriel Dupuy, La Sorbonne University, Paris, and from the help of CAPES.
BIBLIOGRAPHY
Alves, B. B. e O. Strambi (2010) Travel Time Reliability on Airport Ground Access. 12th World Conference on Transport Research, Lisbon, Portugal.
Andan, O. e B. Faivre d’Arcier (2000) Les comportements de choix d’itinéraire entre route et autoroute pour les déplacements régionaux (50 à 200 km). Laboratoire d’Economie des Transports, Lyon, France.
CET (2010) Relatório de Atividades Operacionais. Companhia de Enge-nharia de Tráfego, São Paulo.
Dowling, R.; A. Skabardonis; M. Carroll e Z. Wang (2004) Methodology for Measuring Recurrent and Nonrecurrent Traffic Congestion. Transportation Research Record, v. 1867, p. 60–68.
Downs, A. (2004) Still Struck in traffic, Coping with peak-hour traffic congestion. The Brookings Institution, Washington, DC, USA. DIRIF (2010) Les déplacements sur les réseaux de voies rapides urbaines
d’Ile-de-France en 2008. Direction Interdépartementale des Routes d’Ile-de-France, Paris, France.
DREIF (2001) Enquête Globale Transport. Direction Régionale de l’Equipement d’Ile-de-France, Paris, France.
IAU-IDF (2010) La saga des rocades de métro au cœur de la région capitale. Note rapide de l’Institut d’Aménagement et d’Urbanisme –Ile-de-France, n. 502.
IBGE (2008) IBGE releases municipal population estimates for 2008. Disponível em: < http://www.ibge.gov.br>. Acesso em 01/09/2010.
INSEE (2006) Recensement général de la population. Institut National de la Statistique et des Etudes Economiques, Paris, France.
Jones, P. (1980) Experience with Household Activity-Travel Simulator (HATS), Consumer Perspectives. Transportation Research Re-cord, v. 765, p. 6–12.
de Jong, G.; M. Kouwenhoven; E. Kroes e P. Rietveld (2009) Preliminary Monetary Values for the Reliability Travel Times in Freight Transport. EJTIR, v. 9, n. 2, p. 83–99.
Kurani, K.; T. Turrenrine e D. Sperling (1994) Demand for electric vehi-cles in hybrid households: an exploratory analysis. Transport Pol-icy, v. 1, n. 4, p. 244–256.
Lam, T. e K. Small (2001) The Value of time and reliability: measurement from a value pricing experiment. Transportation Research Part E, v. 37, n. 2, p. 231–251.
Lee-Gosselin, M. (1996) Scope and Potential of Interactive Stated Re-sponse Data Collection Methods. Conference on Household Travel Surveys: New Concepts and Research Needs, Transporta-tion Research Board Conference Proceedings 10, NaTransporta-tional Acad-emy Press, Washington, DC, USA.
Lee-Gosselin, M. (1990) The Dynamic of Car Use Patterns under Different Scenarios: A Gaming Approach. In: Jones, P. (ed.) Transport re-search: new developments in dynamic and activity-based ap-proaches, Gower Press, Aldershot, UK.
Lejoux, P. e C. Raux (2009) CarbonAuto : résultats de l’Enquête Interactive de Réponses Déclarées. ADEME/PREDIT, Paris, France.
Mairie de Paris (2010) Paris transport and travel 2007 report. Mairie de Paris, Paris, France.
Massot, M.-H.; J. Armoogum; P. Bonnel e D. Caubel (2006) Potential for car use reduction through a simulation approach: Paris and Lyon case studies. Transport Reviews, v. 26, n. 1, p. 25–42.
METRÔ (2007) Pesquisa Origem e Destino 2007 – Região Metropolitana de São Paulo. Metrô, São Paulo.
Mokhtarian, P. L.; E. Raney e I. Salomon (1997) Behavioral response to congestion: Identifying patterns and socio-economic differences in adoption. Transport Policy, v. 4, n. 3, p. 147–160.
Vasconcellos, E. (2005) Transport metabolism, social diversity and equity: the case of São Paulo, Brazil. Journal of Transport Geography, v. 13, n. 4, p. 329–339
Weis, C.; C. Dobler e K. Axhausen (2010) Stated adaptation survey of ac-tivity scheduling reactions to changing travel conditions: Field work and preliminary results. 12th World Conference on