Assessing the impact of operational
performance improvement on business
partners’ profitability
The case of a luxury fashion e-commerce
Luís José Preto Peres Marcos
Master’s Dissertation Supervisor: Prof. Isabel Horta
Integrated Master in Industrial Engineering and Management
2019-07-01Abstract
The present dissertation proposes a model that translate an improvement of the fulfillment opera-tions performance of Farfetch partners into a growth of their profitability.
Farfetch itself does not have direct control of the order fulfillment process, so, having oper-ational efficient partners is key for the long-term success of the company. The Fulfillment De-velopment team, where the current project was developed, focuses on reducing the gap between Farfetch and the order fulfillment process, by providing free operational consulting services to its boutique partners. Many times, convincing these partners to engage on these projects may rep-resent a difficult task as they may not understand how they can benefit from it. The described model, that did not exist before, addresses this issue to more easily convince partners to improve performance.
Many are the variables that affect the partner’s profitability, but without having deep insight of each partner’s resources and structure it would be impossible to build a scalable model. Hence, the proposed model focuses on the two factors that Farfetch has visibility on: sales volume and Service 4.0. return.
Initially, the boutiques were segmented into groups that have similar demand for their stock, by creating two segmentation variables to characterize each boutique’s stock. The two variables are: Value Score - represents the attractiveness of the boutique’s stock in terms of value transacted; and Demand Score - represents the demand generated by the boutique’s stock in terms of order volume. After obtaining such segments, benchmark techniques were applied on actually comparable parts, so one could identify the partner to benchmark for a poor operational performer boutique and understand how the improvement of the operational metrics could affect the orders’ growth.
After understanding how a poor operational performer boutique could have performed, in the past, in terms of orders volume, matching the benchmark’s operational performance, a forecasting was applied to each boutique’s actual and obtained potential orders, creating the boutique’s base-line and potential orders. The difference between the two forecasts are the incremental orders due to an improvement of operational performance by the partner.
Finally, the incremental orders were translated into profitability, in addition to the return ob-tained by the incentive service created by Farfetch - Service 4.0. - that was computed for both scenarios - maintaining the same operational performance or improving to match the benchmark.
The difference between each boutique’s baseline and potential revenues are the benefits due to the improvement of operational performance, resulting on model that estimates these incremental cash flows. The expected investment costs required by the boutique, to achieve such operational performance, are an input to obtain some financial metrics, such as ROI. Given the financial met-rics, the boutique can then decide whether it is beneficial or not to engage on a consulting service provided by Farfetch to improve operational performance.
Resumo
A presente dissertação propõe um modelo capaz de traduzir uma melhoria da performance opera-cional dos parceiros da Farfetch num crescimento da sua rentabilidade.
A Farfetch não posssui controlo direto sobre o processamento de encomendas, portanto, ter parceiros operacionalmente eficientes é fundamental para o sucesso a longo prazo da empresa. A equipa de Fulfillment Development, onde o projeto de dissertação foi desenvolvido, dedica-se a mitigar a lacuna entre a Farfetch e o processamento de encomendas, fornecendo serviços de con-sultoria operacional gratuitos às boutiques. Por vezes, convencer estes parceiros a participar num projeto pode apresentar-se como uma tarefa difícil, pois podem não reconhecer imediatamente os benefícios de uma melhoria operacional. O modelo descrito, que até então não existia, aborda esse problema, para que mais facilmente se possa convencer os parceiros a melhorar a sua performance. São várias as variáveis que afetam a rentabilidade dos parceiros, mas sem ter uma visão pro-funda dos recursos e da estrutura de cada um, seria impossível construir um modelo escalável. Assim, o modelo proposto baseia-se nos dois fatores sobre a qual a Farfetch possui visibilidade: volume de encomendas e receitas do Service 4.0..
Inicialmente, as boutiques foram segmentadas em grupos com procura semelhante para o seu stock, criando duas variáveis de segmentação para caracterizar o stock de cada boutique. As duas variáveis são: Value Score - representa a atratividade do stock da boutique em termos de valor transacionado; e Demand Score - representa a procura gerada pelo stock da boutique em termos de volume de encomendas. Após a obtenção dos segmentos, foram aplicadas técnicas de benchmark entre boutiques efetivamente comparáveis, para que se pudesse identificar o parceiro alvo de benchmarking para uma boutique com fraco desempenho operacional e entender como a melhoria das métricas operacionais poderia afetar o crescimento de encomendas.
Após compreensão dos efeitos numa boutique, com fraca performance operacional, teria no volume de encomendas - encomendas potenciais - igualando o desempenho operacional do bench-mark, foi aplicado o modelo de previsão às encomendas efetivas e potenciais de cada boutique, criando a baseline e potencial de encomendas. A diferença entre as duas previsões são as en-comendas adicionais devido a uma melhoria da performance operacional do parceiro.
Por fim, as encomendas adicionais foram traduzidas em rentabilidade bem como obtido o retorno do serviço de incentivos criado pela Farfetch, Service 4.0., para ambos os cenários -manutenção do desempenho operacional atual ou com a melhoria até igualar o respetivo bench-mark.
A diferença entre a baseline e potencial de receitas de cada boutique serão os benefícios devido à melhoria operacional, resultando num modelo que estima esses fluxos de caixa incrementais. Os custos de investimento esperados exigidos pela boutique, para alcançar tal nível operacional, são um input ao modelo, permitindo obter algumas métricas financeiras, como ROI. Dadas as métricas financeiras, a boutique pode, então, decidir se é benéfico ou não envolver-se num serviço de consultoria fornecido pela Farfetch com vista a melhorar o desempenho operacional.
Acknowledgements
Despite being an individual work, the following dissertation would not have been possible to conclude without direction, support and insights from various people.
Firstly, I want to give my gratitude to Farfetch and its culture, specially to the team where the project was developed within. To the guidance given by my supervisor, Tiago Pinto, the support and help by António Freitas and all the insights and collaboration shared with Beatriz Pinto. To the remaining Fulfillment Development team, thank you for making every day at Farfetch a lesson and teaching me the true meaning of causing impact, together. Todos Juntos!
To FEUP and my teachers, I want to appreciate all the transmitted knowledge and giving me the necessary tools to become a skilled professional, in particular to my academic supervisor, Pro-fessor Isabel Horta, who gave me valuable guidance and insight during the project’s development. I cannot thank enough the support of my parents and my brother, whose unconditional love, understanding and patience allow me to face every challenge with confidence and self belief. To my remaining family, thank you for the inspiration and teaching me the meaning of love and care. To my friends, I’m grateful for every shared moment and companionship, specially to Alexan-dre Teles, Gonçalo Pinho and Beatriz Custódio who always succeed on putting a smile on my face.
"Que quem quis, sempre pôde"
Contents
1 Introduction 1 1.1 The Company . . . 1 1.2 Project Motivation . . . 2 1.3 Project Goals . . . 2 1.4 Methodology . . . 3 1.5 Dissertation Structure . . . 32 State of the Art 5 2.1 Luxury Fashion: Adapting to the Digital Future . . . 5
2.2 Adapting Supply Chain to E-commerce . . . 6
2.3 Benchmarking: Application in Operational Performance . . . 7
2.4 Clustering Techniques . . . 9
2.5 Forecasting with Prophet . . . 11
3 Problem Statement 15 3.1 Partner’s Fulfillment Operations . . . 15
3.2 Metrics for Performance Evaluation . . . 16
3.3 Order Allocation Algorithm . . . 18
3.4 Service 4.0. . . 19
3.5 Performance Projects . . . 19
4 Developed Model & Achieved Results 21 4.1 Boutique Segmentation . . . 21
4.1.1 Gender-Brand-Family Attractiveness . . . 22
4.1.2 Boutique’s Stock Attractiveness . . . 23
4.1.3 Segmentation through Clustering . . . 25
4.2 Segment’s Ideal Boutique . . . 27
4.3 Effects of Operational Improvement . . . 28
4.4 Orders Forecast . . . 30
4.5 Performance Project Outcome Evaluation . . . 34
4.5.1 Project Benefits . . . 34
4.5.2 Financial Metrics . . . 38
4.6 Model Deployment . . . 40
5 Conclusions & Future Work 45
A Manual Model Overview 51
D Model’s Accuracy - Sensitivity Analysis 69
Acronyms and Symbols
AOV Average Order Value ATV Actual Transaction Value AW Autumn Winter
DS Demand Score
ERP Enterprise Resource Planning GBFS Gender-Brand-Family-Season GMV Gross Merchandise Value IPO Initial Public Offering KPI Key Performance Indicator NPS Net Promoter Score NPV Net Present Value NS No Stock
PDCA Plan Do Check Act
SQL Structured Query Language SS Spring-Summer
SoS Speed of Sending ROI Return on Investment VS Value Score
List of Figures
2.1 Comparison Chart of K-Means and K-Medoids in Arora and Varshney (2016). . . 10
2.2 Number of events created on Facebook. There is a point for each day, and points are color-coded by day-of-week in Taylor and Letham (2018). . . 11
2.3 Forecasts on the time series from Figure 2.2 using a collection of automated fore-casting procedures in Taylor and Letham (2018). . . 12
2.4 Prophet forecasts results corresponding to those of Figure 2.3 in Taylor and Letham (2018). . . 13
3.1 Farfetch’s order fulfillment steps. . . 16
4.1 Elbow method plot for the boutique’s Value and Demand Score dataset. . . 25
4.2 Distribution of the boutiques within the segments. . . 26
4.3 Average number of boutiques per segment in each quarter. . . 27
4.4 Average percentage of stock Sent to Out of Origin Country at GeoPrice per Oper-ational Score. . . 29
4.5 Average orders per segment for a 24 month horizon. . . 31
4.6 Seasonality of segment A. . . 32
4.7 Logic used for the forecasting algorithm. . . 33
4.8 Boutique’s actual and potential orders and the respective forecasts. . . 34
4.9 Boutique’s and its benchmark operational performance comparison. . . 37
4.10 Boutique’s cash flow plus project predicted investment needed. . . 39
4.11 Project financial metrics for a particular boutique. . . 39
4.12 Assumptions considered to obtain the project cash flows. . . 40
4.13 Model’s Financial Overview per Partner. . . 41
4.14 Model’s Partner Analysis. . . 42
4.15 Model’s Financial Analysis of a Partner. . . 43
A.1 Benchmark Modeling per Segment, Region and Quarter. . . 52
A.2 List of modeled Benchmarks per Segment, Region and Quarter. . . 53
A.3 Comparison between a selected Boutique and the respective benchmark per Quarter. 54 A.4 Selected Boutique baseline forecast and potential forecast with respective sales profit and Service 4.0. return. . . 55
E.1 Forecasting results for a boutique simply applying prophet. . . 71
E.2 Forecasting results for the same boutique in Figure E.1, but applying the Seg-ment’s seasonality to last six months average orders. . . 72
List of Tables
4.1 Stock quantity and value of two example boutiques, specified per GBFS
combina-tion. . . 24
4.2 Average Value Score and Demand Score per segment and its meaning. . . 26
4.3 AOV used for the months being forecast for an example boutique. . . 35
4.4 Example of the markup calculation per partner. . . 36
4.5 Example of the profitability per month generated by the extra orders. . . 36
4.6 Example of the operational performance baseline considered for the forecast months. 37 4.7 Example of the incremental cash flows generated from an improvement of the operational performance. . . 38
D.1 Results of Model’s Accuracy depending on Benchmark and Regression Factors. . 69 D.2 Results of Model’s Accuracy depending on Value Score and Demand Score Factors. 69
Chapter 1
Introduction
The current dissertation describes a project developed in the context of Farfetch, a global mar-ketplace for luxury fashion, aiming to address one of the many challenges the company currently faces.
The initial chapter, Chapter 1, contextualizes the environment the project was developed within. It is divided in five sections: a description of the company, Farfetch; the motivation be-hind the project; a brief description of the project goals; an overview of the methodology used to approach the proposed challenge; and, finally, the structure of the present document.
1.1
The Company
Farfetch presents itself as the global technology platform for luxury fashion. The online market-place was launched by José Neves in 2008 and has been growing ever since, valued at roughly 6.2 billion dollars after the IPO launch at NYSE in October 20181.
Being no longer classified as a startup, Farfetch has currently over 3500 employees with of-fices in Porto, Lisbon, Guimarães, Braga, London, Los Angeles, New York, São Paulo, New Delhi, Dubai, Shanghai, Hong Kong and Tokyo, covering all time zones for both customer and partner support2. With more than 1000 rigorously selected partners, distributed among brands and multi-brand boutiques worldwide, the company connects, in one single platform, the creators with the fashion lovers, shipping to 190 countries. These boutiques and brands expose their best and most exclusive items to a client base of more than 2 million, regardless of the consumer’s location.
As the items are owned by the brands and boutiques - named as partners, Farfetch holds no stock itself, establishing the bridge between demand and supply. This business model allows the customers to have access to a vast catalogue of products from more than 3200 brands, which often
1in Reuters: Farfetch IPO Lauch -https://www.reuters.com/article/us-farfetch-ipo-luxury/
farfetch-tops-price-range-in-ipo-in-boon-to-luxury-market-idUSKCN1M11BQ - Accessed 2019-05-10, 15:10.
2 in Farfetch Investors - https://www.farfetchinvestors.com/our-company/about-farfetch/
would not be possible to find directly in each brand website, being this one of Farfetch’s main competitive advantages.
The orders placed at Farfetch.com are allocated to a partner who has the requested item, who then picks it from their stock and prepares the packaging, being the package collected by a third-party logistic company who delivers it to the final customer.
Although, the absence of inventory is an advantage for Farfetch, it comes with challenges, as the operations and logistics rely on the partners who are typically focused on offline trading. Farfetch must then assure a smooth flow of all complex operations to achieve service consistency and excellence.
1.2
Project Motivation
As upper mentioned, holding no stock comes with challenges, since Farfetch has no control on the order fulfillment process, relying on the partners’ operations and capacity. Most of these partners have limited, if none, experience in online operations, so, many not be prepared to respond to the demand that emerged with the fast Farfetch’s growth, and thus not being able to fulfill orders that meet customer expectations in terms of speed, accuracy and experience.
With the belief in mind that better operations by the partners lead to customer satisfaction and more committed customers - crucial for the success of the company - arises the department of Fulfillment Development, in which this dissertation was developed. The Fulfillment Development department’s aims to mitigate the gap between Farfetch and the control of order fulfillment pro-cess. This is accomplished by monitoring partner’s operational performance, aiding new partners with complex logistics on-boarding and developing consulting projects to improve their opera-tions.
These consulting services provided to the partners, henceforward mentioned as Performance Projects, aim to improve their processes, set efficient logistics setups and layouts, to guarantee partner’s achieve desired level of service and higher capacity, without struggling even when order volume increases. Unfortunately, spending resources on better operational performance, is often seen by partners as a cost rather than an investment with return.
The motivation for the development of this dissertation is to tackle this problem and then be able measure how better operational performance leads to higher partner profitability, in order to more easily convince them to engage on these projects.
1.3
Project Goals
The present dissertation will focus on a clear understanding of how the partners profitability is affected by their operational performance.
The improvement of the operational performance may require financial investment from the partners, thus it is utterly fundamental to understand and evaluate the expected results versus the required investment to achieve them. Having to perform such comparison arises from the need
Assessing the impact of operational performance improvement on business partners’ profitability
to properly allocate resources and support financial decisions that focus essentially on internal profitability.
This dissertation absolute goal is then, to tackle the uncertainty a partner may have on under-standing and evaluating the expected return of improving their operational performance through a project provided by Farfetch. Therefore, is to be developed a model able to:
• predict orders growth from operational performance improvement;
• estimate future incremental cash flows generated from orders growth and Service 4.0.; • develop a tool to input possible project costs and calculate Return on Investment (ROI).
This way, the Fulfillment Development team can estimate the partner’s outcome of undergoing on a consulting project, will be developed focused on the improvement of their operations.
1.4
Methodology
To achieve the proposed goal is fundamental to understand every aspect that affects, directly or not, the partner’s profitability. For that, it will be necessary to get full acknowledgment of Farfetch’s business as a whole, from processes, architecture and key performance indicators (KPIs), as well as a clear identification of all touching points with partners. These insights will be collected by close interaction with different departments within the company, which aided in aligning the project structure and setting milestones. Alongside, it will be indispensable to get broader knowledge from relevant literature that will guide and support the project structure - explained in greater depth in Chapter 2.
Due to every partner being different from one another, and not being scalable to analyze each one separately, they will be split into groups of similar partners. Once mentioning groups - or segments, as to be explained in the following sections - it is necessary to identify which features should be considered for aggregating the partners.
After the segmentation, it will be fundamental to identify the top operational performers of each segment, and define the metrics for an ideal partner in each segment, to be considered as the benchmark of that segment.
Later, it will be estimated the effect that the improvement of operations has on direct return and potential sales growth of the low performers of each segment. Resorting to the use of forecasting techniques, it will be possible to predict the differential of the return by maintaining operational performance and the potential of each partner.
Finally, the results can be grouped by each partner in order to compute the potential profitabil-ity increase and enable the prioritization of performance projects developed by Farfetch.
1.5
Dissertation Structure
Chapter 2 consists on a review of relevant literature considered to be of interest to support the scientific side of the project, reviewing the luxury fashion adaptation to the growing digital channels, how businesses are adapting their supply chain to this new channel and the use of bench-marking techniques. Also, a review is made of clustering technique and the prophet forecasting method.
Chapter 3 scrutinizes both company and department’s current processes and metrics, allowing a clear understanding of the two main key performance indicators that affect both the order allo-cation, as well as other factors that influence partner’s return. The framework of the Performance Projects is also scrutinized.
Chapter 4 is dedicated to thoroughly describe the methodology used in the development of the partner’s profitability prediction model, together with the followup of a boutique throughout the model. It is divided in 6 parts: partner segmentation, defining the ideal partner, estimation of operational performance improvement orders growth and return, followed by order forecasting per partner and the outcome of engaging on a performance project. Also, the automation of the model is described in the final section of the chapter.
The final chapter, Chapter 5, outlines some conclusions and assess the project’s final outcome. Also, a series of recommendations and future opportunities are identified as final consideration, resulting from a deeper understanding of the process and worthy feedback collected.
Chapter 2
State of the Art
The aim of this chapter is to gather and review existing theoretical and empirical research of key subjects and aspects considered to be relevant for the present dissertation.
It is organized in five parts: first, it explores the relationship between the luxury fashion indus-try and the growing digital world; second, a review of how companies are adapting their supply chain to e-commerce and the digital distribution channel; third, how benchmarking techniques can be used for target setting and operational improvement as well as a small section of how cluster-ing methods can be combined with benchmarkcluster-ing; fourth, a review on clustercluster-ing models used for pattern detection in data; and finally, a review of a forecasting model proposed by Facebook.
2.1
Luxury Fashion: Adapting to the Digital Future
In 1988, Grossman and Shapiro conceptualized one of the first formal definitions of luxury goods described as products that “bring prestige to the owner, apart from any functional utility” (Gross-man and Shapiro, 1988). In addition to the social statement luxury gives, the main driving forces of luxury consumption are exclusivity sensation, emotional and quality value(Melika and Muris, 2009).
The luxury industry includes luxury goods as well as experiences. It comprises nine main segments, led by cars, hospitality and personal goods, representing more than 80 percent of the total luxury market together.
Overall, the luxury market grew 5 percent in 2018, to an estimated C1.2 trillion globally. (Bain&Company, 2019) While the retail channel grew 4 percent, the wholesale channel grew by just 1 percent, facing tough competition from online channels, which continued to accelerate in 2018, growing by 22 percent to nearly C 27 billion. The Americas market accounted for 44 percent of online sales, but Asia is emerging as a new growth engine for luxury online, slightly ahead of Europe. By 2025, the online channel is estimated to represent 25 percent of the market value, up from 10 percent today.
For the coming years, McKinsey&Company (2019) anticipates that risks of trade disruptions and slowing economic growth, even in emerging markets like Asia, could undermine global growth
prospects, whereas could uncertainty over events such as Brexit or the possible global economic slowdown. While Europe is facing a deceleration and US growth may have peaked in 2018, Greater China is expected to overtake the US as the largest fashion market in the world in 2019.
The demand for an omnichannel strategy is a natural evolution from the emerging digital tech-nology and ecommerce markets (Deloitte, 2018). A differentiating factor to keep up with this process of change will be the ability of luxury brands to leverage available inventory. Having a physical and an online store increases the chances to get a wider client base and build a strong brand awareness as well. Most luxury brands have adopted the so-called "click and mortar" con-cept (companies who own both, retail and online stores) to increase sales and awareness. (Castillan et al., 2017)
Now more than ever, the luxury fashion players need to be agile, think digital-first and achieve faster speed to market. Technology leaders such as Amazon, Uber and Netflix have raised cus-tomer expectations in terms of speed and convenience, shortening lead times. It is also a crucial aspect for the digital channels of luxury fashion, as well as the whole experience to amaze the customer since product discovery, delivery, until post-sale support. (Okonkwo, 2010)
In the mobile consumer journey, the gap between discovery and purchase has become a pain-point for a more impatient fashion consumer, who seeks to purchase exactly the products they discover, immediately. Also, according to a 2017 millennial survey (Dealspotr, 2017), consumers are more likely to find inspiration from external sources (social media, influencers, TV) than di-rectly from the brand or retailer.
E-commerces should focus on bridging this gap by shortening lead times, increasing the avail-ability of advertised products and new technologies such as visual search. McKinsey&Company (2019) projects that as the race to be the luxury brand platform of choice for both customers and brands heats up, e-commerce players will continue to innovate by adding other profitable services for customers and suppliers.
One of the major keys to establish as a leader in the online luxury fashion industry will be integration of value added services that improve the flow between supplier and consumer, through powerful use of data analytics.
2.2
Adapting Supply Chain to E-commerce
The ability to perform commerce transactions electronically has become an important factor in today’s business world. The accelerated proliferation of home broadband connectivity, together with improved search engine technology, has resulted in rapid growth in Internet research and acquisitions (Pentina and Hasty, 2009).
Traditionally, purely retail stores are unique in enabling the consumers to touch and feel the products and providing instant gratification Meanwhile, with the development of technology and growth of internet transactions, online stores are providing wider product choice and better prices (Brynjolfsson et al., 2013).
Assessing the impact of operational performance improvement on business partners’ profitability
According to Grewal et al. (2004), Internet retailing offers customers the advantages of easier access to price comparison information, an exclusive shopping experience, and the convenience of a ‘store’ open 24 hours a day, seven days a week.
The rapid growth of e-tailing as a consumer retail channel has made it a serious competitor to traditional physical channels (Kumar et al., 2016) so, globally, more stores are working to explore synergies between their physical infrastructure and digital channels to build a larger customer base, increase return, as well as extending the physical storefront and complement customer relation-ships (Gulati and Garino, 2000; Bernstein et al., 2008). However, these strategies comprise several challenges, such as managing channel gaps and extensive online-offline integration.
Saeed et al. (2003) suggests, despite being a complex strategy and demanding high organiza-tional level, the addition of online channels with the maintenance of physical presence, contributes towards the enhancement of the firm’s performance.
The online channel and its supply chain differ from traditional ones, within customer types, order fulfilment, costs and profit, logistical requirements, expectations of service quality, degree of market segmentation, access to demand/supply information, and returns policies among other elements (De et al., 2014). The addition of the online channel to the traditional portfolio of re-tailers can bring opportunities and challenges concerning operations management. According to (Agatz et al., 2008), the integration of channels may yield synergies that reduce e-fulfilment costs. However, these different channels may have different requirements that should be addressed dif-ferently.
Steinfield (2002) states that the the main sources of synergy from integration are common infrastructures and operations. However, a risk of integration is channel conflict, hence, and as stated by the aforementioned author, business owners should align objectives for each channel to coordinate and develop mechanisms of control that promote operational compatibility and develop firms’ capabilities to support the integration.
Traditional channels can be integrated with digital ones by using an enterprise resource plan-ning (ERP) system, to provide efficient and effective flow of information (Sarker et al., 2012). In spite of the positive outcome, ERP system implementations are often characterised by high capital investment, long implementation duration, and high chance of failure (Bingi et al., 1999).
Kumar et al. (2016) assumes that the future idealized supply chain can develop into a hybrid supply chain that includes both e-tail and physical retail channels. Retail warehousing practices with cross-docking and consolidation have proved to be an efficient in retail supply chain, as such, these practices should be carefully applied and integrated into future e-commerce operations. The switch from pure traditional retail products to the e-tailing model will eventually become inevitable.
2.3
Benchmarking: Application in Operational Performance
The essence of benchmarking is the process of identifying the highest standards of excellence and quality of any process, product or service, and then implement the necessary changes to achieve
or even surpass those standards.
There is no need to reinvent the wheel when we’re able to recognize that someone is doing a better job than we are. By learning how things are being done by others, benchmarking forces one to focus on the external environment to become more competitive and may point the way to a more innovative thinking (Landry, 1993).
Andersen and Pettersen (1996) define benchmarking as a process of continuous measurement and comparison of business processes with comparable processes in foremost organizations to obtain information that could help the organization identify and implement improvements.
Benchmarking is also used as a goal-setting process, helping to set targets to achieve per-formance improvements, and if carried out using the best-in-class companies, these goals are likely to be stretch goals which are important for improving performance and learning (Roth and Marucheck, 1994). In a research involving European companies, Voss et al. (1997) proposed, empirically tested and confirmed a direct link between the use of benchmarking techniques and operational performance improvement.
As a continuous process, Bhutta and Huq (1999) considers that benchmark follows the PDCA cycle (plan, do, check, act) where the "plan" phase focuses on selecting the benchmarking pro-cesses and the type of benchmark to be used. In the "do" phase, propro-cesses are characterized using metrics and current business practices already documented. In addition, those same metrics and practices are collected from the reference organization. "Check" refers to a gap analysis compari-son of findings to determine whether there are positive or negative gaps relative to the benchmark-ing partner. The final “act” phase refers to launchbenchmark-ing projects to close down those negative gaps or to maintain the positive ones.
Shetty (1993) identifies three basic types of benchmarking: (1) strategic benchmarking in-volves the comparison of different business strategies to identify key elements in a successful strategy; (2) operational benchmarking focuses on relative cost position or ways to increase com-petitiveness, depending on the function under analysis, different factors must be focused on; and (3) management benchmarking which involves an analysis of virtually any support functions, like management information systems, logistics and order processing.
Benchmarking can be carried out in many steps. Some companies have taken up to 33 steps while others have only used four steps (Bhutta and Huq, 1999). Shetty (1993) proposes the use of five basic steps with continuous iterations: (1) identification of the functions to be bench-marked, (2) selection of superior performers (competitive or non-competitive), (3) data collection and analysis of pinpoint gaps in performance, processes and practices, (4) set performance goals for improving and surpassing the best-in-class, (5) implement plans to bridge the gap and monitor results.
Although benchmarking is widely used, it has limitations. It is a difficult process which re-quires significant time, effort and high financial investment, it can be difficult to collect data from competitors or partners (Prescott, 1989). Boxwell (1994) states that the benchmarking technique should be used as a guide and not for statistical precision.
Assessing the impact of operational performance improvement on business partners’ profitability
Cluster Based Benchmarking
As concluded in the section above, the identification of the right partner to rely the benchmark study on, is key for translating the knowledge acquired into relevant and actionable changes in the context of one’s area of operation/business. Not only the core activity of the two parts should be similar, but also should be comparable in terms of magnitude.
Sarkis and Talluri (2004), in what the authors considered to be one of the first papers applying clustering methods for benchmarking purposes, recognized that the segmentation, dependent on the right choice of the clustering algorithm, is fundamental to obtain meaningful benchmarking results. In the above mentioned study, the authors used the same three metrics for companies in the energy regulation sector to input on the clustering algorithm, as to further choose the ideal benchmark for each cluster - based on their efficiency. Sarkis and Talluri (2004) supports that the ideal benchmark should be the top performer in each cluster, regardless of being a partner with ideal efficiency, ensuring there is always at least one reference for each cluster.
In a research focused on US airports (Dai and Kuosmanen, 2014), it was stated that the bench-marking between comparable airports is a way for operations managers to ensure competitiveness, allow the relative evaluation of performance and identify useful benchmarks.
In both of these cases, the objects were clustered based on their characteristics and only fo-cused on their efficiency after establishing the clusters, thus allowing the identification of the partners with the most efficient use of resources among groups of comparable parts.
The clustering based benchmarking frameworks proposed by Sarkis and Talluri (2004) and Dai and Kuosmanen (2014) take into account the heterogeneity of parts and the operating environment, and thus leading to a more realistic and valuable benchmarking result.
2.4
Clustering Techniques
Data Mining is known to identify useful, valid and comprehensible patterns in data. Velmurugan and Santhanam (2011) defines data mining as a way of turning raw data into useful information. Clustering, as data mining technique, is the organization of a collection of variables into groups based on similarity (Jain et al., 1999).
Madhulatha (2011) considers it to be “the most important unsupervised learning problem”, as it deals with identifying patterns based on similarities found in a selection of unlabeled data. A cluster is then a collection of objects similar between them and dissimilar to the objects belonging to other clusters (Madhulatha, 2011; Han et al., 2001).
There are several clustering methods (Jain et al., 1999; Velmurugan and Santhanam, 2011), the most relevant are as follows:
• Partitioning Clustering; • Hierarchical Clustering; • Model-based Clustering.
The most commonly used partitioning based clustering methods are K-Means and K-Medoids. K-means clustering iteratively selects random centroids and assigns every object to the nearest k centroid, where the coordinates of each centroid is the mean of the coordinates of the objects within the cluster. Even though this method is efficient regarding computational time, it is known to be sensitive to the outliers (Park and Jun, 2009). For this reason, K-medoids methods are used where, instead of selecting a random centroid, representative objects called medoids are considered, being the cluster based on the most centrally located, turning the K-medoids method much more robust to outliers in comparison with the K-means (Arora and Varshney, 2016).
Figure 2.1: Comparison Chart of K-Means and K-Medoids in Arora and Varshney (2016).
The results, presented on Figure 2.1, of the comparison of k-means and k-medoids show that in all aspects such as execution time, sensitivity to outliers and noise reduction, k-medoids is much better than k-means but with the drawback that it is much more complex. (Arora and Varshney, 2016)
The most powerful algorithm for k-medoids method is partitioning around medoids (PAM) (Kaufman and Rousseeuw, 1990), however, it is inefficient for a large data sets due to its time complexity (Han et al., 2001).
The two types of hierarchical clustering algorithms are the agglomerative method and the divisive method (Dai and Kuosmanen, 2014) which, based on the selected criteria, combines or divides a set of objects into larger or smaller groups. The most popular criteria used are the single-link algorithm (Trevor et al., 2009), in which the distance between two clusters is the minimum of the distances between all pairs of patterns drawn from the two clusters and the complete-link algorithm (Trevor et al., 2009), in which the distance between two clusters is the maximum of all pair distances between patterns in the two clusters. In both cases, two clusters are merged from a larger cluster based on minimum distance criteria (Jain et al., 1999).
Assessing the impact of operational performance improvement on business partners’ profitability
Hierarchical clustering is favored since it is straightforward (Dai and Kuosmanen, 2014), as the results are then shown in a dendrogram representing the nested groups of patterns and similarity levels at which the groups change (Jain et al., 1999). Furthermore, the number of clusters depends on the user’s selected granularity, requiring additional effort and care while selecting the desired number of groups to avoid distorting the results.
Model-based methods attempt to streamline the fitness between the data and the model where the data is assumed to be generated (Zhong and Ghosh, 2003). These can be further classified into more exclusive groups. The advantage of this clustering technique is that, in addition to being computationally efficient, the determination of the number of clusters does not rely on user intervention (Dai and Kuosmanen, 2014), delivering more reliable results.
2.5
Forecasting with Prophet
Forecasting is a data science activity central to many activities within an organization. Organiza-tions across all sectors of industry must engage in capacity planning to efficiently allocate their limited resources and set goals to measure performance relative to a baseline.
Nevertheless, analysts capable of producing high quality forecasts are rare since forecasting is a specialized skill that requires experience. Hence, being able to use a robust forecasting method, with few customizable features to adapt to the context of each business, is of high demand.
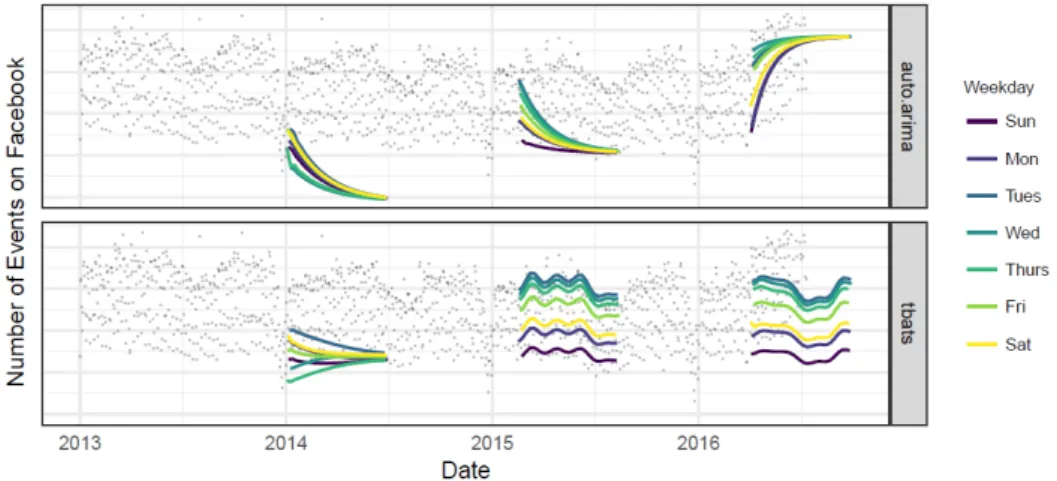
Figure 2.3 shows results using two alternative automatic forecasting models applied to dataset presented on Figure 2.2. The forecasts were made at three points in the history, each using only the portion of the time series up to that point to simulate making a forecast on that date.
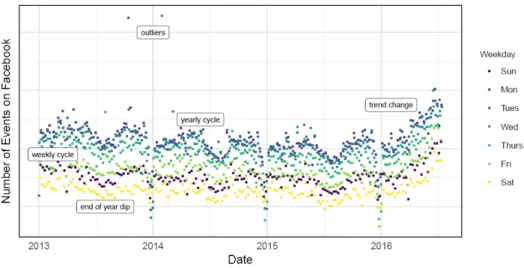
Figure 2.2: Number of events created on Facebook. There is a point for each day, and points are color-coded by day-of-week in Taylor and Letham (2018).
The methods shown in Figure 2.3 are: ARIMA, which fits a range of ARIMA models and automatically selects the best one; and TBATS, a model with both weekly and yearly seasonalities.
Figure 2.3: Forecasts on the time series from Figure 2.2 using a collection of automated forecasting procedures in Taylor and Letham (2018).
Both methods struggle to produce forecasts that match the characteristics of these time series, as well as overreact to the end-of-year dip since they fail to model yearly seasonality. When a forecast produces poor results, is important to tune the parameters of the method to the problem at hand, skills that the typical analyst lack.
The time series forecasting model proposed by Taylor and Letham (2018), called prophet, is designed to handle the common features of business time series seen in Figure 2.2. Importantly, it is also designed to have parameters to be adjusted without knowing the details of the underlying model. The model uses a decomposable time series model with three main model components: trend, seasonality, and special events. They are combined as formulated in Equation 2.1.
y(t) = g(t) + s(t) + h(t) + ε(t) (2.1)
Here g(t) is the trend function which models non-periodic changes in the value of the time series; s(t) represents periodic changes, i.e., seasonality; and h(t) represents the effects of special events which occur on potentially irregular dates. The error term, ε(t), represents any changes not accommodated by the model.
Prophet was implemented with two trend models that cover many applications: a logistic growth and a linear growth model. For logistic growth forecasting, the core component of the data generating process is a model for how the population has grown and how it is expected to continue growing, for example, the market size and its expected growth. For other forecasting problems that do not exhibit saturating growth, a constant rate of growth, i.e., linear growth, often provides satisfactory results.
Business time series often present seasonality as a result of the human behaviors. For instance, a week can produce effects on a time series that repeat every week, while the year’s seasons or vacation schedules can produce effects that repeat each year. To fit and forecast these effects,
Assessing the impact of operational performance improvement on business partners’ profitability
seasonality models that are periodic functions of t must be specified. For example, when dealing with a dataset with daily data, specify t equal to 365.25 to support the yearly seasonality.
Also, special events provide large predictable peaks or depressions to many business time series and often do not follow a periodic pattern, so their effects are not well modeled by a common smooth cycle. Prophet allows the analyst to provide a customized list of past and future events, identified by the event unique name. For example, Black-Friday happens every year in November, but not always on the same day. By being able to input to the model the past days where Black-Friday happened and the projected dates, the model will present more accurate results.
Figure 2.4 shows the Prophet model forecast to the Facebook events time series of Figure 2.3. These forecasts were made on the same three dates as in Figure 2.3, as before using only the data up to that date for the forecast.
Figure 2.4: Prophet forecasts results corresponding to those of Figure 2.3 in Taylor and Letham (2018).
The Prophet model successfully captures both weekly and yearly seasonality, and unlike the forecast models presented in Figure 2.3, does not overreact to the holiday dip in the first year.
A major theme of forecasting at scale is that analysts with a variety of backgrounds must make more forecasts than they can do manually. Prophet uses a simple, modular regression model that works well with default parameters, but also allows analysts to select the components that are relevant to their forecasting problem and easily make adjustments as needed.
Chapter 3
Problem Statement
The present dissertation will focus on providing a clear understanding of how the partners prof-itability is affected by their operational performance. This problem is contextualized within the Fulfillment Development team, as to support them into more easily convince and encourage part-ners in engaging on a Performance Project, and keep on aiming for operational excellence.
These Performance Projects aim at improving partner’s processes, set efficient logistics setups and layouts, by introducing proper tools and techniques to guarantee that partners achieve higher capacity and performance levels. However, the Fulfillment Development currently fails to provide the partner with an indication of what would be the potential return of their operational improve-ment. Therefore, the need to formulate a model able to rightfully quantify the return of investing on operations, since it is a very important information for partners to make an investment decision. Hence, is to be scrutinized in this section, all relevant points to formulate the approach for evaluating the potential return achieved with the consulting project. First, a description of the interaction points the partner has with the order fulfillment process is to be provided, followed by the most relevant operational metrics that define and influence, on a partner level, the internal Farfetch algorithm for order allocation, which also directly affect the partner’s return of the Service 4.0.. Finally, a review of the framework of a Performance Project is made.
3.1
Partner’s Fulfillment Operations
As already mentioned, the items displayed online and available for purchase on Farfetch.com belong to Farfetch’s partners, leading to the order fulfillment process each time an order is placed by a customer.
There are three parts intervening in this process - Farfetch, partner and courier, where each one has clear tasks to complete in the 6 order fulfillment steps, shown in Figure 3.1. Partner’s operations on the order process will be deeply described.
Farfetch must approve customer payment and detect a possible fraud, which will lead to a cancelled order if suspicious, known as step 2, actually beginning simultaneously with step 1. The company is also responsible for step 4, by creating an Airway Bill (AWB) - document with the
Figure 3.1: Farfetch’s order fulfillment steps.
information of the customer and order destination - which in more than 98% of the cases is done automatically and almost instantaneously.
Farfetch’s partners who receive an order notification are responsible for the following steps:
• Step 1 - Check Stock: partners must confirm they still hold the requested item at the mo-ment the order is placed. If the stock is confirmed, the order will move on to the next steps, else a No Stock happens, and if available, the order is allocated to another partner;
• Step 3 - Decide Packaging: Farfetch has several boxes of different sizes and each item size has a recommended box depending on the item size. The partner must place the item in the box and is encouraged to include any additional details, to augment the customer experience;
• Step 5 - Ready (Send Parcel): comprises the bridge between the partner and the courier, as after the partner prints the AWB and attaches it to the order’s package, the order is ready to leave the stock point towards the customers desired address.
Finally, once the package is prepared to be sent, the courier must then pick the package from the stock point and deliver it to the end-customer. This is considered to be step 6, beginning as soon the order’s AWB is scanned by the courier.
3.2
Metrics for Performance Evaluation
Since Farfetch has no direct control on order fulfillment operations, controlling performance is a challenge. Hence, some metrics were developed in order to monitor and evaluate fulfillment performance of its partners. Regarding Fulfillment Development team, it is crucial to have clear vision of each partners’ performance.
Assessing the impact of operational performance improvement on business partners’ profitability
Currently, Speed of Sending (SoS) and No Stock (NS) are the most important operational KPIs, being considered the most appropriate metrics to evaluate partners’ commitment to Farfetch. Net Promoter Score (NPS) also plays an important role on aspects that will affect the partners’ profitability.
These three metrics are further explained below. • Speed of Sending
The Speed of Sending (SoS) is a KPI measuring the time, in days, between creating an order and the moment the courier picks it up from the partner’s shipping point (time between Step 1 and Step 5 - explained in section 3.1), understood as SoS Gross.
As some partners do not work on weekends and public holidays, there was the need to refor-mulate the SoS metric in a more partner-oriented way to evaluate its performance, resulting in the SoS Net, that excludes from the SoS Gross the weekends, public holidays in the partner’s country and the time the orders may spend on hold due to exceptions.
Speed of Sending is a crucial metric, impacting, together with the time the order spends in transit, the total lead time, affecting the customer experience regarding the expected date for the delivery of the requested item.
Farfetch does not set an operational target level for SoS Net for its partners, the SoS target for the partners is to have 80.0% and 96.3% of their orders with an Speed of Sending under 1 day and under 2 days, accordingly.
• No Stock
As mentioned before, it is possible the occurrence of a scenario where the item ordered by the customer is no longer available on partner’s stock, creating a situation where a No Stock occurs. Whenever this happens, if possible, the order will be allocated to another partner who has an indication of having the item available.
This metric compares the number of No Stock occurrences with the total of received orders, resulting on a percentage.
In terms of No Stock, Farfetch’s target for its partners is 1.30%.
• Net Promoter Score
Net Promoter Score (NPS) is a metric used to measure the customer loyalty and level of sat-isfaction. After every order, once the item is received by the customer, an email is automatically sent with a form.
Two questions are made about how likely the customer would recommend both Farfetch and the partner, in a 0-10 scale, being then used to calculate the NPS for both Farfetch and the partner.
An answer between 0 and 6 represents a “Detractor”; an answer between 7 and 8 represents a “Passive”; and, finally, an answer between 9 and 10 represents a “Promoter”.
%NPS = %Promoters − %Detractors (3.1) Regarding the Net Promoter Score, although there is no specific target, ideally, it should be over 70%.
The Farfetch’s target for these operational metrics can be consulted in Appendix C.
These three metrics are inputs for both the Order Allocation Algorithm and the Service 4.0, explained in Sections 3.3 and 3.4, respectively.
3.3
Order Allocation Algorithm
The allocation algorithm selects which partner will fulfill the order placed by a customer on Far-fetch.com. It is set in a way that is believed to optimize the customer’s satisfaction.
It works like a sequence of four strainers, beginning with a pool of all partners who claim to have availability of the requested item, narrowing that number down from level to level until only one partner remains.
The first level, selects, from all partners with the requested item, the ones that set the item’s price between the lowest available and an internally defined threshold. If more than one partner remains, it moves to the next level.
The second level, checks if any of the remaining partners is based on the customer’s country. If positive, it first checks if there’s a boutique with the item, and from boutiques within the same country, the tie breaker will be the Operational Score. In the case that no boutique has the requested item, the algorithm will use the same logic for brand partners.
In the third and fourth levels, the same logic as the second level is applied at Region and World level, respectively.
The partners’ Operational Score is an integer, obtained depending on three inputs: average SoS Net, NS rate and NPS score. The complete method to calculate this score should remain confidential, but it is possible to say that both the average of SoS Net and NS rate weight much more than the NPS score.
• Geographical Pricing
The geographical pricing is a concept where a price of an item is dictated by the brand, in a way that reflects different demands and price sensibilities in different countries or regions. For example, the same item from brand A may cost $500 in the UK and $800 in the USA.
These geo-priced items lead to sales which the boutiques have no control on price. Thus, when an order of a item under geographical pricing is placed, the boutiques with the item available will start off at the same level on the Order Allocation Algorithm, as the price will be equal for all
Assessing the impact of operational performance improvement on business partners’ profitability
of them, leaving more relevance to the Operational Score on selecting the boutique to fulfill the order.
Approximately, of Farfetch’s total orders, 32% were of items marked with geographical pric-ing1.
3.4
Service 4.0.
In order to align partner’s level of operations with Farfetch’s targets, in October 2018, Service 4.0. was introduced after a series of iterations. This service consists on a way to encourage partners to aim for high operational performance, resulting in a policy of monetary benefits or penalties for the partner.
The incentive or penalty is calculated based on various inputs: percentage of orders sent in less than 1 and 2 days, No Stock percentage, percentage of Wrong Items sent and Net Promoter Score. The most impactful metrics are the percentage of orders sent in less than 2 days (% SoS < 2d) and No Stock percentage, thus, given a combination of these two values, the incentive may go from +1.30% to -3.00% of the partner’s monthly actual transaction value (ATV). Also, for every No Stock occurrence, the partner is charged 10£ (approximately $12.75) for customer compensation. In addition to the above mentioned incentive, depending on the percentage of orders sent in less than 1 day (% SoS < 1d), the partner may be eligible to either receive an extra incentive of 0.20% or 0.40% of the monthly ATV, plus the refund of part or the totality of the packaging costs (approximately $1.70 each box).
The complete method for the calculation of the Service 4.0. is available in Appendix B. As the Service 4.0. results on an extra return or penalty for the partner, depending on its operational level of performance, it has a direct impact on partner’s profitability.
3.5
Performance Projects
The Performance Projects provided by the Fulfillment Development team to the partners aim to mitigate the gap between Farfetch and the control of order fulfillment process.
These consulting services are mainly focused on impactful partners for Farfetch who are strug-gling with their operations, for the purpose of improving their performance which will indirectly affect Farfetch’s long term customer commitment and satisfaction.
Once the most critical struggling partners for Farfetch are identified, it is scheduled a call between consultants from the Fulfillment Development team and the person responsible for the brand or boutique. In that call, is provided to the partner an explanation of Performance Projects’ purpose, areas of focus and framework. After the parties agree on the development of the project, the following phases are:
• Diagnostics: personal visit to partner’s stock point(s) and data collection of current fulfill-ment process;
• Identify Root Causes: use of collected data to identify key factors negatively impacting the fulfillment process;
• Identify Solutions: identify the best solutions to tackle the main challenges encountered, adapted to the context of the partner’s operational set up;
• Present Solution Plan: formulate action plan to deliver the proposed solutions;
• Implement: deploy selected solutions according to partner’s preference and monitor the progress;
• Control: after project sign-off, operational metrics are tracked weekly during 60 days to assess the success of the project, comparing to initial target.
It is relevant to mention that these projects do not represent any cost to the partner. Any pos-sible cost that arises from the project will come from the need to invest on operations, and these needs may vary a lot according to the partner’s state. For example, hiring more people, buying new materials, contracting developers to work on software integration, among others.
Currently, the Fulfillment Development team fails to demonstrate to the partner the potential increase on profitability obtained by investing on operational performance improvement, consti-tuting a crucial point in convincing them to engage on these projects. Thence, arose the need to develop a model that could estimate the benefits from the partner’s point of view, which the present dissertation pretends to fulfill.
Chapter 4
Developed Model & Achieved Results
The present chapter scrutinizes the methodology used for the creation of the model which will be able to estimate partner’s profitability derived from an operational improvement.
It is divided in six sections, as follows: boutique segmentation, modeling the ideal boutique within each segment using benchmarking, the effects that performing under the top performer (identified through benchmarking techniques) have on inefficient performers, orders forecasting based on each boutique’s historical and potential orders and, finally, translating the operational performance and orders increase into a potential financial output of engaging with a Performance Project. In every section, some of the obtained results are shown and examples of a boutique going through the model.
Although Farfetch’s partners are both brands and boutiques, the present dissertation focuses on building a model suitable for boutique partners, as these account for around 60% of all partners and were responsible for the fulfillment of more than 78% of all Farfetch’s orders1. Even though brand partners are important on a strategic point of view, Farfetch still holds a special consideration for boutiques, hence the Performance Projects provided by the Fulfillment Development team are only offered without costs to this partner type.
4.1
Boutique Segmentation
As mentioned in Chapter 2, in a benchmarking approach, comparing similar parts is key to obtain useful insight. The same logic is applied to the current dissertation, where the comparable parts should be the boutiques, as their main goal is shared: selling luxury fashion online.
Even though the main goal is shared, there are still many points of divergence, for example, in terms of size, some boutiques can be a small familiar business located in a traditional Italian city, while others can be big department stores located in commercial areas in big cities, plus others may even be a national network of stores with shared ownership.
Unfortunately, these are characteristics that Farfetch has no visibility on, and gathering these kind of data would be a rather complex and time consuming task given the number of boutique
partners Farfetch operates with. Thus, it was necessary to find the characteristics that make the boutiques comparable and that would support the current analysis. For that, a clustering method is to be used, where the inputs are the variables considered to be important.
The information regarding the boutiques that Farfetch has access to are country and city, data related to historical Farfetch.com orders - volumes and operational performance metrics - and the stock that the boutique sets available on Farfetch.com.
Ideally, the segments should be composed of boutiques with similar stock attractiveness, i.e. boutiques that should have similar sales potential of their stock, as to identify within each segment the boutiques that are performing better in terms of sales and operational performance - these will then be considered the benchmark of their segment.
Clustering the boutiques based on orders volume would gather boutiques with comparable number of transactions, which from a strategic point of view is important, but from an operational point of view would not add much value, as it would not give an indication of how much could the orders of a poor operational performer increase.
Segmenting the partners based on their stock - units and monetary value - would give an acceptable idea of the boutique size, but not all stock units are equal. For example, in a case where a boutique A has 10 Gucci bags with a total value of $5,000 in stock and another boutique B has in stock 10 Burberry shirts with a total value of $5,000 , a clustering algorithm would probably place these two boutiques in the same cluster, but these two kind of products might not have the same demand.
4.1.1 Gender-Brand-Family Attractiveness
Knowing that no item has exactly the same attractiveness as another, and even for the same item, the attractiveness will most certainly vary in time, it was necessary to translate these insights into actionable data.
For that reason and given the fashion business specificity, data was collected from Farfetch overall sales covering a complete year, since April 2018 until the end of March 2019, to take into consideration the two seasons - Spring-Summer (SS) and Autumn-Winter (AW) - and sale seasons - Black Friday, X20s, Christmas, among others.
As computing the attractiveness of every single item available on Farfetch’s website would be an exhaustive task, it was collected data in terms of number of products sold and value transacted from Gender-Brand-Family-Season (GBFS) combinations and grouped by quarter - from 2018-Q2 to 2019-Q1. An example of a possible GBFS combination could be Women-Burberry-Shoes-AW. The Product Families considered for the analysis were Bags, Accessories, Clothing and Shoes, which together account for more than 95% of Farfetch sales2, turning other product Families like Baby and Jewellery residual.
Assessing the impact of operational performance improvement on business partners’ profitability
After having all this data split into quarters, the Value Score (VS) and Demand Score (DS) of each GBFS combination could be computed. VS correlates to the amount of money generated by the transactions and DS correlates to the number of transactions of the GBFS combination.
For example, 5 sales of Women-Burberry-Shoes-AW could generate a total transacted value of $3,000, while 10 sales of Men-Gucci-Accessories-AW could generate a transacted value of $2,500. In this case the VS of Women-Burberry-Shoes-AW would be higher, though regarding the DS, it would be lower.
For each combination of GBFS, both VS and DS are obtained by a min-max normalization, multiplied by 1000, to facilitate human interpretation. The formulas to obtain VS and DS can be seen in Equations 4.1 and 4.2, respectively.
V Si= GMVi− min(GMV ) max(GMV ) − min(GMV )× 1000 (4.1) DSi= QtySoldi− min(QtySold) max(QtySold) − min(QtySold)× 1000 (4.2) where:
GMViis the value transacted of the GBFS i;
QtySoldi is the number of transactions of the GBFS i.
4.1.2 Boutique’s Stock Attractiveness
Per quarter, a value of both VS and DS was obtained for every GBFS combination. For each com-bination, the engineered features - namely VS and DS, provide one with the level of attractiveness regarding the transacted value and number of transactions, respectively, thus allowing the quan-tification of the boutique’s stock attractiveness. Data regarding the boutique’s stock was gathered and grouped by quarter, specifying the monetary value and units of every GBFS owned by the boutique.
As time passes, the boutique’s stock may suffer some fluctuations, for example, in the case the stock is sold or the boutique uploads more stock into Farfetch.com, the stock units and value will decrease or increase, respectively. For such reasons, arose the need to measure the average stock units and value a given boutique owned of each combination of GBFS during each quarter, engineered as seen on Equations 4.3 and 4.4, respectively.
StockValuei jk=
∑3m=1ValueMonthmi jk
3 (4.3)
where:
Value Monthmi jk is the monetary value in stock of boutique k, at the end of the first day of month m of quarter j, of the i GBFS combination.
StockU nitsi jk=
∑3m=1U nitsMonthmi jk
where:
Units Monthmi jk are the units in stock of boutique k, at the end of the first day of month m of quarter j, of the i GBFS combination.
The next step was to turn this absolute stock’s data comparable between the boutiques. Hence, was verified the percentage, in terms of stock units and value, that each GBFS combination, held by a boutique, accounted in the total stock of that GBFS available at Farfetch.com. Table 4.1 shows an example, using only two boutiques, of how the boutique’s stock data was displayed and the respective percentages on Farfetch.
Table 4.1: Stock quantity and value of two example boutiques, specified per GBFS combination.
Boutique GBFS Quarter Stock Value % Value on FF Stock Units % Units on FF A Women-Gucci-Shoes-AW 19Q1 $ 10 000 67% 10 56%
A Women-Balenciaga-Shoes-AW 19Q1 $ 2 500 56% 5 50% B Women-Gucci-Shoes-AW 19Q1 $ 5 000 33% 8 44% B Women-Balenciaga-Shoes-AW 19Q1 $ 2 000 44% 5 50% B Women-Prada-Bags-SS 19Q1 $ 6 000 100% 8 100%
The cases where a given boutique held 100% of volume of a certain combination of GBFS, were discarded, as orders of any item within that GBFS could only be fulfilled by that boutique, therefore, the order would not go through the Order Allocation Algorithm.
Having the percentage of possession each boutique has of the combinations of GBFS, and knowing that each one of these combinations has a VS and DS, the boutique’s overall VS and DS could be determined.
The boutique’s overall VS and DS define analytically the boutique’s stock attractiveness, there-fore, boutiques with similar VS and DS should be allocated with more or less the same amount of orders. These two features can be obtained as formulated in Equations 4.5 and 4.6.
BoutiqueV Sk j= n
∑
k=1 %ValueonFar f etchi jk×V Sji (4.5) where:% Value on Farfetchi jkis the percentage of monetary value held by boutique k, in quarter j, of the GBFS combination i, on Farfetch overall;
VSjkis the Value Score in quarter j, of the GBFS combination i.
BoutiqueDSk j= n
∑
k=1 %U nitsonFar f etchi jk× DSji (4.6) where:% Units on Farfetchi jk is the percentage of units held by boutique k, in quarter j, of the GBFS combination k, on Farfetch overall;
Assessing the impact of operational performance improvement on business partners’ profitability
4.1.3 Segmentation through Clustering
Having the right and relevant features is key to run an effective clustering algorithm. The two boutique variables, VS and DS, respectively, characterize attractiveness of the boutique’s stock, as previously mentioned. Hence, these were the two input variables to run the partitioning around medoids (PAM) clustering algorithm on RStudio.
Note that each boutique had different VS and DS values for each quarter, thus the PAM clus-tering was ran four times, once per each quarter dataset. The number of clusters was 10 and it was defined using the Elbow method.
The Elbow method looks at the total within-cluster sum of square (WSS) as a function of the number of clusters and, even though, one should choose a number of clusters so that adding another cluster does not improve marginally the total WSS, it was chosen a number of cluster higher than what should be normally used, to achieve an higher level of granularity. Figure 4.1 shows the plot obtained for the Elbow method.
Figure 4.1: Elbow method plot for the boutique’s Value and Demand Score dataset.
After these clusters were obtained, the average Boutique’s VS and DS, obtained as formulated in Equations 4.5 and 4.6, respectively, was computed for each of the clusters for each quarter. The data was gathered in a table with 40 rows (10 per each cluster of each of the four quarters) and three columns: Quarter-Cluster; Average VS and Average DS.
A second clustering algorithm was ran using the average VS and DS per Quarter-Cluster com-bination as inputs with a ideal number of clusters of 6. After obtaining the new clusters, there was a need to translate the assigned clusters to a meaningful term, being then ordered from highest to lowest average VS and DS and named from A to F.
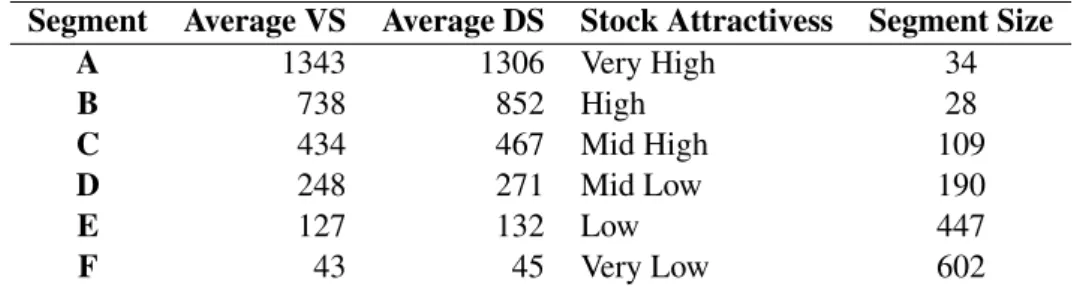
This technique allowed to allocate each one of the boutiques belonging to a given cluster in a quarter to a meaningful segment that holds consistency over time. Table 4.2 shows the average VS and DS for the six segments obtained.
Table 4.2: Average Value Score and Demand Score per segment and its meaning. Segment Average VS Average DS Stock Attractivess Segment Size
A 1343 1306 Very High 34 B 738 852 High 28 C 434 467 Mid High 109 D 248 271 Mid Low 190 E 127 132 Low 447 F 43 45 Very Low 602
Clustering methods are often used when the dataset has many observations and more than two features, as it turns human visualization and interpretation of the groups of similar parts rather difficult.
In this case, the clustering algorithms were ran using only two variables for the purpose of achieving automated and robust results, as the algorithm creates a collection of objects similar between them and dissimilar to other clusters.
The boutiques distribution among the obtained segments can be observed in Figure 4.2.