Phenotypic association between feed efficiency and feeding behavior,
growth and carcass traits in Senepol cattle
André Lasmar Guimarães1, Maria Eugênia Zerlotti Mercadante1*, Roberta Carrilho Canesin1, Renata Helena Branco1, Maria Lucia Pereira Lima1, Joslaine Noely dos Santos Gonçalves
Cyrillo1
1 Instituto de Zootecnia, Centro Avançado de Pesquisa Tecnológica do Agronegócio de Bovinos de Corte, Sertãozinho, SP, Brazil.
ABSTRACT - The objective of this study was to evaluate the associations between feed efficiency and feeding behavior, growth and carcass traits in Senepol cattle. A total of 137 animals were evaluated. Of these animals, 36 males were evaluated in a second test, totaling 173 records (initial age of 466±96 days and initial weight of 426±104 kg). Residual feed intake (RFI) was calculated as the difference between observed and expected dry matter intake, estimated by regression of dry matter intake on average daily gain and metabolic body weight (BW0.75), and the animals were classified as negative (high efficiency) and positive RFI (low efficiency). The mean RFI was –0.838±0.078 and 0.797±0.075 kg DM day–1 for negative and positive RFI animals, respectively, with a difference of 1.63 kg dry matter day–1. The dry matter intake of negative RFI animals, expressed as kg day–1 and percentage of mean body weight, was 11.3% and 13.1% lower than that of positive RFI animals. Negative RFI animals spent less time at the feed bunk and ingested less dry matter per visit than positive RFI animals, but did not differ in terms of chest girth, scrotal circumference, or hip height. However, negative RFI animals had lower rump fat deposition (7.13±0.477 mm) than positive RFI animals (7.83±0.473 mm). The Spearman correlation between RFI estimated in the first and second tests was 0.69, indicating that RFI is consistent when evaluated during two different periods of the life of the animal. Senepol animals with low residual feed intake (high efficiency) deposit less subcutaneous rump fat, but this reduction is not accompanied by a reduction in backfat thickness and longissimus muscle area.
Key Words: beef cattle, feed intake, residual feed intake
© 2017 Sociedade Brasileira de Zootecnia ISSN 1806-9290
www.sbz.org.br
R. Bras. Zootec., 46(1):47-55, 2017
Received: May 18, 2016
Accepted: October 19, 2016
*Corresponding author: [email protected] http://dx.doi.org/10.1590/S1806-92902017000100008
How to cite: Guimarães, A. L.; Mercadante, M. E. Z.; Canesin, R. C.; Branco, R. H.; Lima, M. L. P. and Cyrillo, J. N. S. G. 2017. Phenotypic association between feed efficiency and feeding behavior, growth and carcass traits in Senepol cattle. Revista Brasileira de Zootecnia 46(1):47-55.
Copyright © 2017 Sociedade Brasileira de Zootecnia. This is an Open Access article distributed under the terms of the Creative Commons Attribution License (http://creativecommons.org/licenses/by/4.0/), which permits unrestricted use, distribution, and reproduction in any medium, provided the original work is properly cited.
Introduction
With the increase in feed costs and unstable market sectors, the use of efficient animals will become a necessity rather than a preference (McGee et al., 2014), which justifies the growing interest in animals selected for feed efficiency. The inclusion of residual feed intake (RFI) analysis in the identification of superior animals provides a possible approach to improving the profitability of beef cattle production systems. This trait is moderately heritable, as estimated in meta-analysis by Del Claro et al. (2012) (0.255±0.008) and Berry and Crowley (2013) (0.33±0.013), with the range of heritability estimates from 0.07 to 0.62.
Evidence from a selection experiment on Bos taurus
indicates that differences in physical activity and feeding behavior explain 11% of the variation in RFI among animals, while differences in body composition account for only 5% of the variation in RFI (Richardson and Herd, 2004). Chen et al. (2014) observed high phenotypic correlations between RFI and feeding behavior in Bos taurus steers. Low-efficiency animals (positive RFI) spent less time in daily feeding and head down. Studies on Bos taurus and
Bos indicus have reported a greater longissimus muscle area
and less carcass fat thickness in high-efficiency animals compared with low-efficiency animals (Richardson et al., 2001; Basarab et al., 2003; Herd et al., 2003; Santana et al., 2012). On the other hand, a phenotypic correlation of low magnitude between RFI and subcutaneous fat thickness and similar fat thickness in high-efficiency and low-efficiency animals has been reported (Lancaster et al., 2009a; Ribeiro et al., 2012; Bonilha et al., 2013; Chaves et al., 2015).
ascendance from West African taurine cattle, if it occurred, was probably counterselected in the first generations by the selection objectives designed to increase meat production and the hornless phenotype (Flori et al., 2012). The first Senepol animals came to Brazil in 2000. Over the last 15 years, the use of the breed has been growing in Brazil, taking market share and occupying space on large farms of the country, due to its economically relevant productive traits.
The objective of this study was to evaluate the associations between feed efficiency and feeding behavior, growth and carcass traits in Senepol cattle.
Material and Methods
The feed efficiency tests were conducted in Sertãozinho, northern region of São Paulo State, Brazil. The climate of the region is tropical humid, with an annual average temperature of 21.4 °C and annual average rainfall of 1,518 mm. The tests were approved by the Ethics Committee on Animal Use of Instituto de Zootecnia, Nova Odessa, SP, Brazil, in accordance with the Brazilian Code of Best Practice and Animal Use (São Paulo State Law no. 11.977).
A total of 137 pure Senepol animals, including 108 uncastrated males and 29 females, from 19 private farms were used. The mean age and BW of the animals at the start of the tests were 471±107 days and 321±116 kg, respectively. Of these animals, 36 males tested in 2015 were evaluated in a second test (initial age of 443±26 days and initial weight of 443±37 kg), corresponding to 173 records (initial age of 466±96 days and initial weight of 426±104 kg). The feed efficiency tests had a mean duration of 72±4 days, preceded by 28 days of adaptation to the diet and facilities.
In 2013 (n = 47), the animals were housed in individual pens (12 m2 with a concrete floor), which were partially covered and contained a concrete feed bunk and water trough. In 2014 and 2015 (n = 90), the animals remained in the feedlot area equipped with automatic feeders of the GrowSafe® system (GrowSafe Systems Ltd., Airdrie, Alberta, Canada), which records natural feed intake every time the animal visits the bunk, in addition to feeding behavior information such as the duration, frequency, and feed intake at each visit to the bunk.
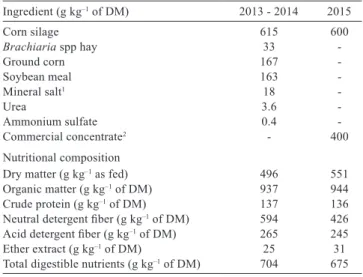
Animals were fed twice daily (9.00 and 15.00 h) and had free access to water and diet. Diets offered in 2013 and 2014 consisted of corn silage, Brachiaria brizantha hay, ground corn, soybean meal, and mineral and the diet in 2015 consisted of corn silage and commercial concentrate (Table 1). Isoenergetic and isoprotein diets were formulated to achieve an average daily gain of 1.0 kg day–1 (NRC, 2000).
The amount of feed offered was calculated based on a quantity of 5 to 10% leftovers of the total feed offered to ensure ad libitum intake. Feed samples were collected once a week, pre-dried in a forced-ventilation oven at 55 °C for 72 h, and ground in a Wiley mill (Arthur Hill Thomas Co., Philadelphia, PA) using a 2-mm sieve for subsequent chemical analysis. Dry matter (DM), mineral matter (AOAC Official Method 942.05), and ether extract (AOAC Official Method 920.39) contents were determined according to the AOAC (1990). Neutral detergent fiber, with α-amylase and without the addition of sodium sulfite, and acid detergent fiber were analyzed in a TE-149 apparatus (Tecnal, Piracicaba, SP, Brazil) using the methods described by Mertens (2002). Nitrogen was determined by the Dumas method (Etheridge et al., 1998), which is based on the release of nitrogen by combustion at high temperature in pure oxygen, in a LECO® analyzer (FP-528, St. Joseph, MI, USA).
Records of daily feed intake were excluded when there were no leftovers in the individual pens or in the case of evidence of malfunction of the GrowSafe System®, totaling 59±13 valid days animal–1. In 2013, the animals were weighed at intervals of 15 days without previous fasting. In 2014 and 2015, the animals were weighed at the beginning and end of the test after fasting for 16 h from solids and water.
Table 1 - Percentage of ingredients and nutritional composition of the diets during the test
Ingredient (g kg–1 of DM) 2013 - 2014 2015
Corn silage 615 600
Brachiaria spp hay 33
-Ground corn 167
-Soybean meal 163
-Mineral salt1 18
-Urea 3.6
-Ammonium sulfate 0.4
-Commercial concentrate2 - 400
Nutritional composition
Dry matter (g kg–1 as fed) 496 551
Organic matter (g kg–1 of DM) 937 944
Crude protein (g kg–1 of DM) 137 136
Neutral detergent fiber (g kg–1 of DM) 594 426
Acid detergent fiber (g kg–1 of DM) 265 245
Ether extract (g kg–1 of DM) 25 31
Total digestible nutrients (g kg–1 of DM) 704 675 DM - dry matter.
1 Composition: phosphorus, 80 g kg–1; calcium, 140 g kg–1; sodium, 137.2 g kg–1; sulfur, 12 g kg–1; copper, 1,600 mg kg–1; cobalt, 210 mg kg–1; iodine, 180 mg kg–1; manganese, 1,400 mg kg–1; selenium, 27 mg kg–1; zinc, 4,500 mg kg–1; nickel, 11 mg kg–1; fluoride, 800 mg kg–1.
The mean observed dry matter intake (DMI) was calculated using all valid days of feed intake, multiplied by the DM content of the diet offered. In 2013, the average daily gain (ADG) of each animal was calculated as the linear regression coefficient of weights as a function of days in test and in 2014 and 2015, as the difference between final and initial weight, divided by days in test. Mean body weight (BW) was calculated from the mean weights obtained during the test and mean metabolic body weight as the mean body weight raised to 0.75 power (BW0.75).
Residual feed intake was calculated as the difference between observed and expected DMI, estimated by regression of DMI on ADG and BW0.75 for each of the six contemporary groups (Gi) evaluated using the PROC GLM procedure of SAS (Statistical Analysis System, version 9.2). The Gi were defined as year of test (2013, 2014, and 2015), sex (male and female), and age at entry (difference ≤ 126 days within group, which was 80 days in G1, 87 days in G2, 126 days in G3, 88 days in G4, 76 days in G5, and 76 days in G6). The following regression equations were fitted to estimate the expected DMI (eDMI) for each contemporary group. The term αi corresponds to the mean DMI of each contemporary group (Gi):
(G1, n = 27): eDMI = α1 + 1.239 (±0.390) × ADG + 0.089 (±0.005) × BW0.75 (R2 = 0.996);
(G2, n = 20): eDMI = α2 + 2.474 (±0.505) × ADG + 0.067 (±0.006) × BW0.75 (R2 = 0.993);
(G3, n = 23): eDMI = α3 + 2.368 (±1.208) × ADG + 0.082 (±0.016) × BW0.75 (R2 = 0.979);
(G4, n = 29): eDMI = α4 + 1.486 (±0.583) × ADG + 0.110 (±0.008) × BW0.75 (R2 = 0.995);
(G5, n = 38): eDMI = α5 + 2.641 (±0.624) × ADG + 0.084 (±0.010) × BW0.75 (R2 = 0.991);
(G6, n = 36): eDMI = α6 + 1.560 (±0.706) × ADG + 0.097 (±0.007) × BW0.75 (R2 = 0.996).
Dry matter intake is also expressed as a percentage of mean BW (DMI%BW). Feed conversion ratio (FCR) was obtained as the ratio between DMI and ADG.
The following feeding behavior traits were calculated as average of the test period using the number of visits and time spent at the feed bunk recorded with the GrowSafe System®: bunk visit duration, bunk visit frequency, and DMI per visit according to Chen et al. (2014).
Body growth traits were obtained at the end of each test. Hip height was measured with a tape measure in restrained animals from the pelvic bone to the floor surface. Chest girth and scrotal circumference were also measured with a tape measure. The following carcass traits were obtained on that occasion by ultrasonography as described by Pinheiro
et al. (2011) using a Pie Medical Aquila Ultrasound System (Esaote Europe B.V., Maastricht, The Netherlands) and a 17-cm probe: longissimus muscle area, backfat thickness, and rump fat thickness. Longissimus muscle area and backfat thickness were measured between the 12th and 13th ribs and rump fat thickness was measured over the junction between the gluteus medius and biceps femoris muscles. The images were stored and the measurements were made with the Echo Image Viewer 1.0 program (Pie Medical Equipment B.V., Maastricht, The Netherlands).
The animals were classified as negative RFI (<0, high efficiency) or positive RFI (>0, low efficiency). The traits were analyzed using the MIXED procedure of the SAS program. The general model included the fixed effect of RFI class (negative and positive), the linear effect of the covariate age at the start of the test, and the random effects of contemporary group and residual. Exceptions were the models for the analysis of age at the start of the test, which did not include the covariate age at the start of the test, and of RFI, which did not include the effect of contemporary group. The likelihood test indicated heterogenous residual variances of the two RFI classes for average daily gain, bunk visit frequency, dry matter intake per visit, and chest girth. Thus, distinct residual variances were modeled for each RFI class using the GROUP option of the REPEATED command. Simple correlations [Pearson (rP)] were estimated among FCR, RFI, DMI%BW, and other traits. In the analyses described above, the records of 36 animals that were evaluated in two consecutive tests were considered independent, partially violating the assumption of independence of residuals.
Rank correlations of the 36 animals [Spearman (rS)] for BW0.75, DMI, ADG, FCR, RFI, DMI%BW, bunk visit duration, bunk visit frequency, DMI per visit, longissimus
muscle area, and rump fat thickness were estimated between the first (Test 1, 68 days) and second (Test 2, 76 days) periods of evaluation.
The rP and rS coefficients were estimated according to the following equations:
,
in which is the sample mean of trait x; is the sample mean of trait y; xi and yi are the observed values of traits x and y, respectively;
,
Results
Figure 1 shows the dispersion of observed and predicted DMI according to contemporary group. The points below each trend line are HE animals (negative RFI) and the points above each trend line correspond to LE animals (positive RFI). The mean initial weight and ADG of the animals studied were 426±104 kg and 1.35±0.36 kgday–1, respectively. No significant differences in initial age, initial weight, BW0.75, or ADG were observed within RFI classes (Table 2).
Negative RFI animals had lower DMI (kg/day) and DMI%BW than positive RFI animals. The FCR also differed significantly between the two RFI classes, with high-efficiency animals exhibiting better FCR than low-efficiency animals.
The feeding behavior traits bunk visit duration and DMI per visit, obtained as the ratio between DMI and number of visits, differed between RFI classes, while bunk visit frequency did not. The growth traits did not differ between RFI classes. Among the ultrasound-measured carcass traits, only rump fat thickness differed between RFI classes and high-efficiency animals (negative RFI) had lower rump fat thickness than low-efficiency animals (positive RFI) (Table 2).
Feed conversion was strongly and antagonistically correlated with ADG, but showed a weak and positive correlation with RFI, bunk visit duration, and DMI per visit
(Table 3). In contrast, a weak and negative correlation was observed with bunk visit frequency.
Residual feed intake showed a moderate positive correlation with DMI and DMI%BW, but was independent of initial weight and ADG. Among the feeding behavior traits, RFI was moderately and positively correlated only with bunk visit duration.
Pearson’s correlations between DMI%BW and the growth traits (initial age, initial weight, BW0.75, chest
Trait
Residual feed intake class
SEM P-value
High efficiency
(n = 83) Low efficiency(n = 90)
Initial age (days) 480 478 41.8 0.6420
Initial weight (kg) 430 425 17.4 0.4417
Metabolic body weight(kg) 101 100 3.41 0.3433
Dry matter intake (DMI; kg day–1) 10.9 12.3 0.365 <0.0001
Average daily gain (kg day–1) 1.37 1.35 0.088 0.6693
Feed conversion ratio 8.57 9.58 0.536 0.0022
Residual feed intake (kg DM day–1) −0.838 0.797 0.077 <0.0001
DMI%BW 2.37 2.73 0.099 <0.0001
Bunk visit duration (min day–1) 97.1 107 4.89 0.0004
Bunk visit frequency (visits day–1) 51.1 54.3 4.72 0.0811
DMI per visit (kg) 0.226 0.250 0.038 0.0072
Chest girth (cm) 186 185 3.11 0.2819
Body length (cm) 130 130 3.57 0.4130
Scrotal circumference (cm) 37.6 37.1 0.502 0.1763
Hip height (cm) 128 128 1.21 0.7307
Coat thickness (mm) 1.34 1.35 0.020 0.7619
Longissimus muscle area (cm²) 72.6 70.9 2.72 0.1699
Backfat thickness (mm) 3.31 3.48 0.387 0.3038
Rump fat thickness (mm) 7.13 7.83 0.475 0.0147
DM - dry matter; DMI%BW - dry matter intake expressed as a percentage of mean body weight; SEM - standard error of the mean.
Table 2 - Least-square means of feeding behavior, growth, feed efficiency, and carcass traits of Senepol cattle classified as high efficiency and low efficiency
Figure 1 - Relationship between observed and predicted dry matter intake according to contemporary group (G).
girth, scrotal circumference, and hip height) were negative and high. Furthermore, DMI%BW was moderately and antagonistically correlated with the carcass traits
longissimus muscle area and backfat thickness and with
DMI per visit, while there was a low positive correlation with rump fat thickness and a moderate correlation with bunk visit frequency.
A positive correlation of medium magnitude was observed for DMI, RFI, and DMI%BW between the first and second feed efficiency tests (Table 4). However, low and nonsignificant correlations were estimated between
ADG and FCR obtained in the two tests, demonstrating that these traits were less consistent over the period of evaluation. Moderate-to-high correlations were obtained among bunk visit duration, bunk visit frequency, DMI per visit, longissimus muscle area, and rump fat thickness in the two tests.
Discussion
The coefficient of variation of RFI for the contemporary groups, obtained as the ratio between the standard deviation of RFI and mean DMI, ranged from 6.26% to 14.78%. The highest coefficient was obtained for the contemporary group of animals that exhibited the greatest variation in age (G3, 126 days) (Figure 1). Initial weight, ADG, or BW0.75 did not differ between RFI classes as expected, since RFI is estimated with a multiple regression equation that includes ADG and BW0.75, leading to the phenotypic independence of these traits (Arthur et al., 2001; Sobrinho et al., 2011).
The ADG of the two RFI classes was similar and the difference in DMI of –1.493±0.160 kg day–1 shows that high-efficiency animals consumed 11.3% less feed than low-efficiency animals for the same ADG. At the same proportion as DMI, DMI%BW was 13.1% lower in high-efficiency animals compared with low-high-efficiency animals. Lancaster et al. (2009b), Montanholi et al. (2010), and Kayser and Hill (2013) reported a difference of 16%, 17%, and 10% in DMI, respectively, between high-efficiency and low-efficiency animals when they were classified as low RFI (≤0.5 standard deviation of the mean) and high RFI (≥0.5 standard deviation of the mean). Since feeding is one of the most expensive activities in beef cattle farming, the identification and use of high-efficiency animals should contribute to reduce the costs of production systems.
Since ADG did not differ between the two RFI classes, the difference in DMI reflectedthedifferenceinFCRbetween RFI classes. The FCR of high-efficiency animals was 10.6% lower than low-efficiency animals. Similar results were reported by Basarab et al. (2003), Nkrumah et al. (2006), and Kayser and Hill (2013), who obtained a difference of 9%, 18%, and 17%, respectively, in FCR between animals classified as low RFI (≤0.5 standard deviation of the mean) and high RFI (≥0.5 standard deviation of the mean).
A negative correlation of high magnitude between FCR and ADG (−0.83) was also reported by Santana et al. (2012) and indicates that the adoption of FCR as an indicator trait of feed efficiency in cattle may result in an increase in animal weight. Sobrinho et al. (2011) found a significant correlation of 0.25 between FCR and RFI in Nellore animals; Lancaster et al. (2009a) found correlation of 0.59 in Brangus heifers;
Trait FCR RFI DMI%BW
Initial age (days) –0.031 –0.003 –0.660* Initial weight (kg) 0.140 –0.068 –0.800* Metabolic body weight (kg) 0.043 –0.069 –0.780* Dry matter intake (DMI; kg) –0.050 0.554* –0.003 Average daily again (kg day–1) –0.834* –0.036 0.056
Feed conversion ratio - 0.264* –0.142 Residual feed intake (kg DM day–1) 0.264* - 0.512*
DMI%BW –0.142 0.512*
-Bunk visit duration (min day–1) 0.236* 0.332* 0.102
Bunk visit frequency (visits day–1) –0.268* 0.171 0.572*
DMI per visit (kg) 0.203* 0.149 –0.463* Chest girth (cm) –0.041 –0.080 –0.714* Body length (cm) –0.069 –0.035 –0.718* Scrotal circumference (cm) –0.019 –0.127 –0.794* Hip height (cm) –0.001 –0.034 –0.536* Coat thickness (mm) 0.009 –0.010 –0.086
Longissimus muscle area (cm²) –0.060 –0.104 –0.643* Backfat thickness (mm) –0.120 0.012 –0.522* Rump fat thickness (mm) 0.015 0.086 0.209*
Table 3 - Correlation of feed conversion ratio, residual feed intake, and dry matter intake expressed as a percentage of body weight with feeding behavior, growth, and carcass traits
FCR - feed conversion ratio; RFI - residual feed intake; DMI%BW - dry matter intake expressed as a percentage of mean body weight; DM - dry matter.
*P<0.05.
Trait Test 1 × Test 21 (n = 36)
Metabolic body weight 0.955* Dry matter intake (DMI) 0.500*
Average daily gain –0.113
Feed conversion ratio 0.125 Residual feed intake 0.699*
DMI%BW 0.609*
Bunk visit duration 0.704*
Bunk visit frequency 0.637*
DMI per visit 0.797*
Longissimus muscle area 0.655*
Rump fat thickness 0.464*
Table 4 - Spearman correlation coefficients among feed efficiency, feeding behavior, growth, and carcass traits of Senepol cattle obtained during two periods of evaluation (Test 1 × Test 2)
1 Test 1 - 68 days of evaluation (from 12/12/2014 to 17/02/2015); Test 2 - 76 days of evaluation (from 17/02/2015 to 03/05/2015).
and Mao et al. (2013) found correlation of 0.45 in Angus and Charolaise steers. The advantage of RFI over FCR is that the former shows a normal distribution, since it is a linear combination of the three variables DMI, ADG, and BW0.75. In contrast, the most variable trait (ADG) in FCR appears in the denominator, a situation in which extreme values of ADG cause wide variations in FCR. Another advantage of RFI is that it is independent of weight and ADG, while FCR shows a high and negative correlation with ADG, i.e., separate weighting of RFI and ADG in an index is possible, but it is unknown which weight is attributed to DMI and ADG when FCR is used for the identification and selection of animals.
The correlations estimated between RFI and DMI%BW corroborate the results of Arthur et al. (2001), Nkrumah et al. (2006), Bingham et al. (2009), and Chaves et al. (2015), who described a positive correlation between RFI and DMI and a correlation close to zero between RFI, BW, and ADG. Similar results were also reported by Santana et al. (2012), who found significant (P<0.05) Pearson’s correlations between RFI and DMI (0.67) and between RFI and DMI%BW (0.82), while the correlations among RFI, ADG, and BW were negligible.
Among the feeding behavior traits evaluated, bunk visit duration was 9.34% shorter in high-efficiency animals (negative RFI) compared with low-efficiency animals, i.e., the former spent less time and energy in this activity and more time in sedentary activities (Kelly et al., 2010a), possibly saving energy that is directed towards weight gain. However, it seems logical that high-efficiency animals require less time at the bunk for feeding because of their lower DMI. Nkrumah et al. (2006), Lancaster et al. (2009a), and McGee et al. (2014) also reported a shorter bunk visit duration for high-efficiency animals compared with low-efficiency animals.
High-efficiency animals consumed 9.6% less feed per visit at the bunk than low-efficiency animals. Bingham et al. (2009) and Montanholi et al. (2010) reported that high-efficiency animals consumed 38.5% and 12.7% less feed (g min–1), respectively, than low-efficiency animals. Since DMI is the main difference between high-efficiency and low-efficiency animals, a lower DMI of high-efficiency animals per visit at the feed bunk was expected. High-efficiency and low-High-efficiency animals did not differ in terms of bunk visit frequency, in agreement with the results of Bingham et al. (2009). The feeding behavior traits observed in high-efficiency animals (less bunk visit duration and DMI per visit), associated with no differences between high-efficiency and low-efficiency animals in initial and final BW or ADG, suggested that high-efficiency
animals are more efficient in terms of feed utilization. In other words, high-efficiency animals used less energy in the physiological processes involved in maintenance, resulting in more net energy available for tissue accretion (Castro Bulle et al., 2007). Therefore, the greater DMI by low-efficiency animals might be partly related to the low metabolizability of consumed feed and the accompanying increased need to attain the levels of energy intake required for maintaining BW and supporting body protein and fat accretion (Kelly et al., 2010a).
The correlation between RFI and bunk visit duration estimated in the present study was similar to the correlations of 0.49 and 0.37 reported by Nkrumah et al. (2007) and McGee et al. (2014), respectively. These values indicate that the lower the RFI, less time does the animal spend at the bunk, with lower DMI and fewer visits to the bunk. The correlations of RFI with bunk visit frequency and DMI per visit were not significant (P>0.05), in agreement with the correlation reported by Kayser and Hill (2013) between RFI and bunk visit frequency. However, McGee et al. (2014), Nkrumak et al. (2007), and Lancaster et al. (2009a) reported a moderate correlation between RFI and bunk visit frequency (0.29), and Kayser and Hill (2013) found a moderate correlation between RFI and DMI per visit in Angus (0.52) and Hereford (0.36) cattle.
There was no significant difference in body measures (chest girth, scrotal circumference, and hip height ) between the two RFI classes and the correlations of FCR and RFI with these traits being low and nonsignificant, demonstrating that feed efficiency traits are phenotypically independent of hest girth, scrotal circumference, and hip height. Similar results were reported by Basarab et al. (2003) and Nkrumah et al. (2006), who observed no differences in hip height between high-efficiency and low-efficiency animals.
The finding that only rump fat thickness differed between the two RFI classes may be explained by the fact that, in bovine adipose tissue, deposition occurs simultaneously in the caudocranial and dorsoventral directions (Batt, 1979), suggesting greater variation in fat deposition over the rump and smaller variation in the lumbar region at the age when the animals were evaluated. Santana et al. (2012) reported similar results in a study on Nellore animals, in which high-efficiency animals had 1.35 mm less rump fat than low-efficiency animals. Although rump fat thickness was slightly reduced in high-efficiency animals (negative RFI), but not the backfat thickness, this decrease was not accompanied by a reduction
in longissimus muscle area, suggesting that high-efficiency
and Hill, 2013). In Bos taurus, McDonagh et al. (2001), Lancaster et al. (2009b), and Kayser and Hill (2013) found that high-efficiency animals deposited less fat than low-efficiency animals.
However, the difference in subcutaneous fat deposition between high-efficiency and low-efficiency animals is not a limiting factor, since the average fat thickness of the animals studied here was greater than 3 mm (Table 2), the minimum thickness required by slaughterhouses. Most animals of this study were evaluated during the growing phase, a period characterized by low fat deposition in the carcass. Furthermore, unlike finishing diets, the environment/diet was not appropriate for high fat deposition. Despite these limitations, the animals exhibited satisfactory carcass fat deposition.
The Spearman correlation between DMI obtained in the first and second feed efficiency tests was positive and of medium magnitude (Table 4), showing a certain consistency in the ranking of animals for DMI in the two tests. However, the same was not observed for ADG, whose correlation between the two tests was close to zero. This result caused a low correlation of FCR, since ADG is the denominator of the relationship between DMI and ADG. Evaluating four traits used in feed efficiency tests (ADG, DMI, FCR, and RFI), Archer et al. (1999) and Wang et al. (2006) showed that ADG is the most variable trait, which may explain the low correlation estimated in the present study between ADG in the two consecutive tests.
The RFI of the animals estimated in the first test was high and positively correlated with RFI estimated in the second test, indicating that few animals required re-ranking for this trait. In fact, 78% of the animals evaluated maintained the previous RFI class when classified as negative and positive RFI. In the study of Kelly et al. (2010b), 54% of the heifers had their RFI altered by less than 0.5 standard deviation (0.30 kg DM day–1) in two consecutive finishing tests. The repeatability estimates between the growing and finishing phases obtained by the authors were 0.61 and 0.62 for DMI and RFI, respectively. Durunna et al. (2011) reported correlations of lower magnitudes among ADG, DMI, and RFI (0.38, 0.63 and 0.39) when the animals were evaluated during two periods receiving different diets.
The correlations among the feeding behavior traits (bunk visit duration, bunk visit frequency, and DMI per visit) were high (0.704, 0.637, and 0.797), while the correlations between carcass traits (longissimus muscle area and rump fat thickness) obtained in the two tests were of medium magnitude (0.655 and 0.464). These values are close to those reported in the literature. Pinheiro et al. (2011) found higher repeatability of longissimus muscle area (0.70) than
rump fat thickness (0.48) for measures obtained from 10 to 26 months of age of Nellore cattle. Durunna et al. (2012) observed that heifers maintained the feeding behavior ranking from the first to the second test, although ranking of the animals for RFI had been altered by more than one standard deviation, suggesting high consistency and good repeatability of feeding behavior traits over time.
These previous studies indicate that most of the animals maintained the RFI class in the two evaluation periods, while the same does not apply to FCR, suggesting RFI to be the trait of choice for the evaluation of feed efficiency as it is more consistent and repeatable over time. These data are consistent with the findings of the present study (Table 4) in which the Spearman correlation between the two tests was higher for RFI than for DMI%BW and FCR.
Conclusions
Residual feed intake is phenotypically independent of growth traits. Senepol cattle with low residual feed intake (high efficiency) deposit less subcutaneous rump fat, but this reduction is not accompanied by a reduction in backfat thickness and longissimus muscle area. Residual feed intake is a consistent trait when evaluated during two different periods of the life of the animal, with the maintenance of residual feed intake class in a high proportion of animals.
References
AOAC - Association of Oficial Analytical Chemistry. 1990. Oficial methods of analysis. 15th ed. AOAC International, Arlington, VA.
Archer, J. A.; Richardson, E. C.; Herd, R. M. and Arthur, P. F. 1999. Potential for selection to improve efficiency of feed use in beef cattle: a review. Australian Journal of Agricultural Research 50:147-161.
Arthur, P. F.; Archer, J. A.; Johnston, D. J.; Herd, R. M.; Richardson, E. C. and Parnell, P. F. 2001. Genetic and phenotypic variance and covariance components for feed intake, feed efficiency, and other postweaning traits in Angus cattle. Journal of Animal Science 79:2805-2811.
Basarab, J. A.; Price, M. A.; Aalhus, J. L.; Okine, E. K.; Snelling, W. M. and Lyle, K. L. 2003. Residual feed intake and body composition in young growing cattle. Canadian Journal of Animal Science 83:189-204.
Batt, R. A. L. 1979. Influences on animal growth and development (Studies in Biology). Hodder, London.
Berry, D. P. and Crowley, J. J. 2013. Cell biology symposium: Genetics of feed efficiency in dairy and beef cattle. Journal of Animal Science 91:1594-1613.
Bonilha, E. F. M.; Branco, R. H.; Bonilha, S. F. M.; Araujo, F. L.; Magnani, E. and Mercadante, M. E. Z. 2013. Body chemical composition of Nellore bulls with different residual feed intakes. Journal of Animal Science 91:3457-3464.
Castro Bulle, F. C. P.; Paulino, P. V.; Sanches, A. C. and Sainz, R. D. 2007. Growth, carcass quality, and protein and energy metabolism in beef cattle with different growth potentials and residual feed intake.Journal of Animal Science 85:928-936.
Chaves, A. S.; Nascimento, M. L.; Tullio, R. R.; Rosa, A. N.; Alencar, M. M. and Lanna, D. P. 2015. Relationship of efficiency indices with performance, heart rate, oxygen consumption, blood parameters, and estimated heat production in Nellore steers. Journal of Animal Science 93:5036-5046.
Chen, L.; Mao, F.; Crews, D. H. Jr.; Vinsky, M. and Li, C. 2014. Phenotypic and genetic relationships of feeding behavior with feed intake, growth performance, feed efficiency, and carcass merit traits in Angus and Charolais steers. Journal of Animal Science 92:974-983.
Del Claro, A. C.; Mercadante, M. E. and Silva, J. A. I. V. 2012. Meta-analysis of genetic parameter estimates of residual feed intake and of its component traits in cattle. Pesquisa Agropecuaria Brasileira 47:302-310.
Durunna, O. N.; Colazo, M. G.; Ambrose, D. J.; McCartney, D.; Baron, V. S. and Basarab, J. A. 2012. Evidence of residual feed intake reranking in crossbred replacement heifers. Journal of Animal Science 90:734-741.
Durunna, O. N.; Plastow, G.; Mujibi, F. D. N.; Grant, J.; Mah, J.; Basarab, J. A.; Okine, E. K.; Moore, S. S. and Wang, Z. 2011. Genetic parameters and genotype x environment interaction for feed efficiency traits in steers fed grower and finisher diets. Journal of Animal Science 89:3394-3400.
Etheridge, R. D.; Pesti, G. M. and Foster, E. H. 1998. A comparison of nitrogen values obtained utilizing the Kjeldahl nitrogen and Dumas combustion methodologies (Leco CNS 2000) on samples typical of an animal nutrition analytical laboratory. Animal Feed Science and Technology 73:21-28.
Flori, L.; Gonzatti, M. I.; Thevenon, S.; Chantal, I.; Pinto, J.; Berthier, D.; Aso, P. M. and Gautier, M. 2012. A quasi-exclusive European ancestry in the Senepol tropical cattle breed highlights the importance of the slick locus in tropical adaptation. Plos One 7: e36133.
Herd, R.; Archer, J. and Arthur, P. 2003. Reducing the cost of beef production through genetic improvement in residual feed intake: Opportunity and challenges to application. Journal of Animal Science 81:E9-E17.
Kayser, W. and Hill, R. A. 2013. Relationship between feed intake, feeding behaviors, performance, and ultrasound carcass measurements in growing purebred Angus and Hereford bulls. Journal of Animal Science 91:5492-5499.
Kelly, A. K.; McGee, M.; Crews, D. H. Jr.; Fahey, A. G.; Wylie, A. R. and Kenny, D. A. 2010a. Effect of divergence in residual feed intake on feeding behavior, blood metabolic variables, and body composition traits in growing beef heifers. Journal of Animal Science 88:109-123.
Kelly, A. K.; McGee, M.; Crews, D. H. Jr.; Sweeney, T.; Boland, T. M. and Kenny, D. A. 2010b. Repeatability of feed efficiency, carcass ultrasound, feeding behavior, and blood metabolic variables in finishing heifers divergently selected for residual feed intake. Journal of Animal Science 88:3214-3225.
Lancaster, P. A.; Carstens, G. E.; Crews, D. H. Jr.; Welsh, T. H. Jr.; Forbes, T. D. A.; Forrest, D. W.; Tedeschi, L. O.; Randel, R. D. and Rouquette, F. M. 2009a. Phenotypic and genetic relationships of
residual feed intake with performance and ultrasound carcass traits in Brangus heifers. Journal of Animal Science 87:3887-3896. Lancaster, P. A.; Carstens, G. E.; Ribeiro, F. R. B.; Tedeschi, L. O. and
Crews, D. H., Jr. 2009b. Characterization of feed efficiency traits and relationships with feeding behavior and ultrasound carcass traits in growing bulls. Journal of Animal Science 87:1528-1539. Mao, F.; Chen, L.; Vinsky, M.; Okine, E.; Wang, Z.; Basarab, J.; Crews,
D. H. Jr. and Li, C. 2013. Phenotypic and genetic relationships of feed efficiency with growth performance, ultrasound, and carcass merit traits in Angus and Charolais steers. Journal of Animal Science 91:2067-2076.
Mertens, D. R. 2002. Gravimetric determination of amylase-treated neutral detergent fiber in feeds with refluxing in beakers or crucibles: collaborative study. Journal of AOAC International 85:1217-1240.
McDonagh, M. B.; Herd, R. M.; Richardson, E. C.; Oddy, V. H.; Archer, J. A. and Arthur, P. F. 2001. Meat quality and the calpain system of feedlot steers following a single generation of divergent selection for residual feed intake. Australian Journal of Experimental Agriculture 41:1013-1021.
McGee, M.; Ramirez, J. A.; Carstens, G. E.; Price, W. J.; Hall, J. B. and Hill, R. A. 2014. Relationships of feeding behaviors with efficiency in RFI-divergent Japanese Black cattle. Journal of Animal Science 92:3580-3590.
Montanholi, Y. R.; Swanson, K. C.; Palme, R.; Schenkel, F. S.; McBride, B. W.; Lu, D. and Miller, S. P. 2010. Assessing feed efficiency in beef steers through feeding behavior, infrared thermography and glucocorticoids. Animal 4:692-701.
Nkrumah, J. D.; Basarab, J. A.; Wang, Z.; Li, C.; Price, M. A.; Okine, E. K.; Crews, D. H. Jr. and Moore, S. S. 2007. Genetic and phenotypic relationships of feed intake and measures of efficiency with growth and carcass merit of beef cattle. Journal of Animal Science 85:2711-2720.
Nkrumah, J. D.; Okine, E. K.; Mathison, G. W.; Schmid, K.; Li, C.; Basarab, J. A.; Price, M. A.; Wang, Z. and Moore, S. S. 2006. Relationships of feedlot feed efficiency, performance, and feeding behavior with metabolic rate, methane production, and energy partitioning in beef cattle. Journal of Animal Science 84:145-153. NRC - National Research Council. 2000. Nutrients requirements of
beef cattle. Washington, DC.
Pinheiro, T. R.; Mercadante, M. E. Z.; Albuquerque, L. G.; Cyrillo, J. N. S. G. and Branco, R. H. 2011. Phenotypic and genetic parameters compared during repeated measures of longissimus muscle area and subcutaneous fat thickness in Nelore cattle. Genetics and Molecular Research 10:2944-2952.
Ribeiro, J. S.; Gonçalves, T. M.; Ladeira, M. M.; Campos, F. R.; Tullio, R. R.; Machado Neto, O. R.; Oliveira, D. M. and Bassi, M. S. 2012. Residual feed intake and its effect on carcass and meat characteristics of feedlot Zebu cattle. Revista Brasileira de Zootecnia 41:1509-1515.
Richardson, E. C. and Herd, R. M. 2004. Biological basis for variation in residual feed intake in beef cattle. 2. Synthesis of results following divergent selection. Australian Journal of Experimental Agriculture 44:431-440.
Richardson, E. C.; Herd, R. M.; Oddy, V. H.; Thomspon, J. M.; Archer, J. A. and Arthur, P. F. 2001. Body composition and implications for heat production of Angus steer progeny of parents selected for and against residual feed intake. Australian Journal of Experimental Agriculture 41:1065-1072.
Sobrinho, T. S.; Branco, R. H.; Bonilha, S. F. M.; Castilhos, A. M.; Figueiredo, L. A.; Razook, A. G. and Mercadante, M. E. Z. 2011. Residual feed intake and relationships with performance of Nellore cattle selected for post weaning weight. Revista Brasileira de Zootecnia 40:929-937.