Genetic analysis of residual feed intake adjusted for fat and carcass
and performance traits in a Nellore herd
Análise genética do consumo alimentar residual ajustado para gordura e de características de carcaça e desempenho em um rebanho Nelore
Giovanna Faria de Moraes1 Luiza Rodrigues Alves Abreu2
Isabel Cristina Ferreira3 Idalmo Garcia Pereira4
ISSNe 1678-4596
1Programa de Pós-graduação em Ciências Veterinárias (PPGCV), Universidade Federal de Uberlândia (UFU), 38405-320, Uberlândia, MG, Brasil. E-mail: [email protected]. Corresponding author.
2Programa de Pós-graduação em Zootecnia (PPGZ), Universidade Federal de Minas Gerais (UFMG), Belo Horizonte, MG, Brasil. 3Embrapa Cerrados, Brasília, DF, Brasil.
4Departamento de Zootecnia (DZO), Universidade Federal de Minas Gerais (UFMG), Belo Horizonte, MG, Brasil.
ABSTRACT: The study of the genetic evaluation of residual feed intake adjusted for fat (RFIFat) is important for the appropriate use of
feed efficiency in selection programs. The objective was to analyze the influence of selection for RFIF at on carcass and performance traits by estimating various genetic parameters. Data were analyzed from five tests of feed efficiency, which were conducted with 677 Nellore males. Genetic evaluation was performed by Bayesian inference using an animal model via single- and two-trait analyses. Variables analyzed were dry matter intake, average daily gain, RFIFat, rib eye area, back fat thickness, rump fat thickness, marbling score, and subcutaneous fat thickness. The posterior mean distributions estimated at each analysis were used to estimate heritability of the traits and to perform various correlations. The studied traits showed high heritability estimates, and they should respond well to selection. The RFIFat presented a phenotypic correlation with carcass traits (which was next to zero), and there was also a negative genetic correlation. Additive genetic variability for RFIFat showed that selection for this trait can promote genetic gains in future generations, resulting in animals that are efficient in terms of nutrient use, and according to the genetic and phenotypic correlations, with no significant negative changes to carcass traits.
Key words: back fat thickness, feed efficiency, genetic correlation, heritability.
RESUMO: O estudo da avaliação genética do consumo alimentar residual ajustado para a gordura (CARFat) é importante para o uso
apropriado da eficiência alimentar em programas de seleção. Objetivou-se analisar a influência da seleção para CARFat sobre características de carcaça e de desempenho, frente à estimação dos parâmetros genéticos. Foram analisados os dados de cinco provas de eficiência alimentar, com 677 machos Nelore. A avaliação genética foi realizada por Inferência Bayesiana, com modelo animal, em análises uni e bicaracterística. Foram analisadas as variáveis: ingestão de matéria seca, ganho de peso diário, CARFat, área de olho de lombo, espessura de gordura, espessura de gordura subcutânea na picanha, marmoreio e acabamento. As médias das distribuições a posteriori, estimadas em cada uma das
análises, foram usadas para a estimação das herdabilidades e das correlações. As características estudadas apresentaram altas estimativas de herdabilidades, devendo responder bem à seleção. O CARFat apresentou correlações fenotípicas próximas a zero com as características de carcaça, e correlações genéticas negativas. A variabilidade genética aditiva observada para CARFat demonstra que a seleção para essa característica poderá promover ganhos genéticos nas futuras gerações, obtendo animais eficientes na utilização de alimentos e, de acordo com as correlações genéticas e fenotípicas encontradas, sem mudanças negativas significativas às características da carcaça.
Palavras-chave: espessura de gordura, eficiência alimentar, correlação genética, herdabilidade.
ANIMAL PRODUCTION
INTRODUCTION
Profitability of cattle breeding is strongly dependent on the spending of nutritional inputs, particularly given that there is a high share of food costs embedded in the total operating costs of production for different types of production systems. Therefore, food is one of the biggest expenses (LANCASTER et al., 2009) and; consequently, there
are searches underway for more efficient animals in terms of nutrient use to help reduce the costs of production. Genetic selection for residual feed intake (RFI) has been used as a tool to increase the herd’s feed efficiency without increasing the animal’s maintenance requirements (LIMA et al., 2013).
is linked with the fat deposition rate, stating that animals with favorable phenotypes of RFI have leaner carcasses (NKRUMAH et al., 2007), which can lead to unwanted changes in carcass quality (ARTHUR et al., 2005). Therefore, adjusting fat when calculating the predicted consumption is an alternative method that can be used to reduce the possible deleterious effects of selection for feed efficiency. In this context, the objective of the present study was to analyze the influence of selection for RFI adjusted for fat (RFIFat) on carcass and performance traits by estimating the genetic parameters in a Nellore herd.
MATERIALS AND METHODS
Data were analyzed from five feed efficiency tests conducted from 2011–2014, with 677 uncastrated Nellore males; this study was performed at the Matinha Ranch Farm, Uberaba – MG, Brazil. A total of 15 days each were dedicated to diet and installation adaptation, and each test lasted an average of 74 days. A mean of 135 animals attended each test. The dry matter intake (DMI), average daily gain (ADG) intake, RFIFat, rib eye area (REA), back fat thickness (BFT), rump fat thickness (RFT), marbling score (MAR), and subcutaneous fat thickness (SFT) were evaluated. Data were pre-analyzed using the SAS program (2009); the data were consistent, requiring only the addition of animal age at the beginning of the test as a covariate.
Consumption was measured using the Growsafe® system; troughs were always kept
supplied with food, ensuring ad libitum consumption and unrestricted access to water. The diet was offered twice a day and 78% consisted of dry matter. In all tests, diets were formulated by isocaloric and isoproteic content, which represented around 70% of total digestible nutrients and 13% of crude protein. The animals were weighed on a calibrated digital balance, which was coupled to a cattle crush, at the beginning and end of the tests, and every 2 weeks during testing. At the beginning of the test, the animals had a mean ± standard deviation age of 309±35 days and they weighed 316±47kg.
Carcass traits were measured on the last
day of each test by in vivo carcass ultrasound exam,
with ultrasound pulses in frequencies ranging from 3-3.5 MHz, performed by a professional accredited by the Ultrasound Guidelines Council (UGC). For the collection of images, vegetable oil was used to ensure acoustic contact between the ultrasound device and the animal body. The REA was evaluated as a cross-sectional area of the Longissimus dorsi
muscle between the 12th and 13th ribs. The BFT
was evaluated as the thickness of subcutaneous fat deposits between the 12th and 13th ribs on the
Longissimus dorsi muscle, and RFT was evaluated as the thickness of subcutaneous fat deposits between the ileum and ischiopubic bone, measured at the articulation point of the Gluteus medius and Biceps femoris. The MAR was evaluated as the percentage of intramuscular fat measured in the longitudinal direction on the Longissimus dorsi muscle between the 12th and 13th ribs. The SFT was calculated as 0.35
BFT + 0.65 RFT.
The kinship matrix used in the analysis was developed from animal pedigree information evaluated during the feed efficiency test at the Matinha Ranch Farm, provided by the Brazilian Association of Zebu Breeders (ABCZ), which featured a database of 3,741 animals. A recursive algorithm was used to maintain a set of pedigrees that was formed using data from animals and their ancestors. The ADG was calculated based on weight measurements. RFIFat is the difference between the observed and expected consumption, calculated by the regression between observed consumption, average metabolic weight, ADG, and SFT.
The genetic evaluation was performed using Bayesian analysis with an animal model in uni- and two-trait analyses using the GIBBS1F90 software; the posteriori estimates were obtained using the POSTGIBBS1F90 application (MISZTAL et al., 2014). The general model used is represented in matrix notation, as follows:
, where Y is a vector for n observations; is the vector for fixed effects (feed efficiency test and animal age at the beginning of the test as a linear effect); a is the vector of additive direct genetic effects; e is the vector of the residual effect; and X
and Z are the incidence matrices related to and
a, respectively. In the uni- and two-trait analyses,
it was considered that E(Y)=Xβ, while in the two-trait analyses it was assumed that
and , and in the univariate analysis
it was assumed that , where: Ʃa
is the additive genetic covariance matrix, Ʃe is the
residual covariance matrix, A is the kinship matrix,
I is the identity matrix, n is the number of registered
animals, ⊗ denotes the direct product of matrices,
E(Y) is the expected estimator, E(α) is the expected
predictor, and E(e) is the expected error. Vectors
a and e were considered to be independent. In
the analysis using the Bayesian approach, vectors
β and a are location parameters of a conditional
reflecting vague a priori knowledge of this vector. Thus, the distribution of Y, given the location parameters and scale, was considered:Y|β, a, R~N [Xβ + Za + IR].
Samples of the posterior distributions of the variance were generated from 500,000 cycles; of these, the first 40,000 were discarded, and the samples were stored at every 100th cycle. Convergence was checked via graphic inspection and sampled values were compared against interactions, as per the criterion proposed by GEWEKE (1992). This criterion was estimated using the Bayesian Output Analysis (BOA) statistical package from the R program (R CORE TEAM, 2015).
RESULTS AND DISCUSSION
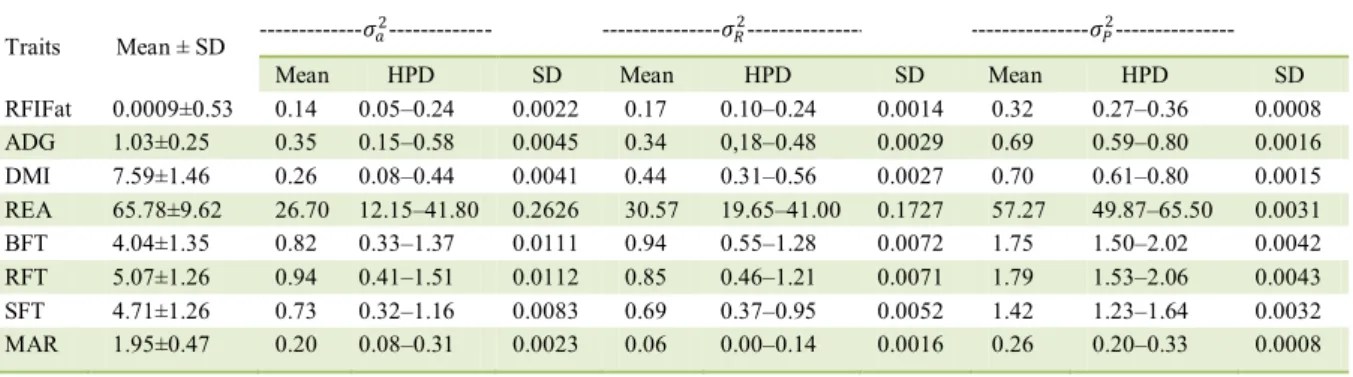
The amplitude of the high probability density region (HPD), the variances (Table 1), and the heritability estimates (Table 2) demonstrated that all the studied traits were able to rightly respond to the selection process. Some studies (ALMEIDA et al., 2004; GOMES et al., 2012; GRION et al., 2014) estimated the phenotypic variation (standard deviation) for RFI in Nellore cattle, ranged from
0.41-1.05kgday-1, as was reported in this study for
RFIFat (0.53). The phenotypic mean variances of ADG and DMI (Table 1) corroborate the findings of GRION et al. (2014), who studied Nellore cattle. The additive genetic variance of carcass traits showed high values in association with broad HPD. The HPD is a measure that provides a numeric range that includes 95% of the samples and their data or their estimates (SANTANA et al., 2014).
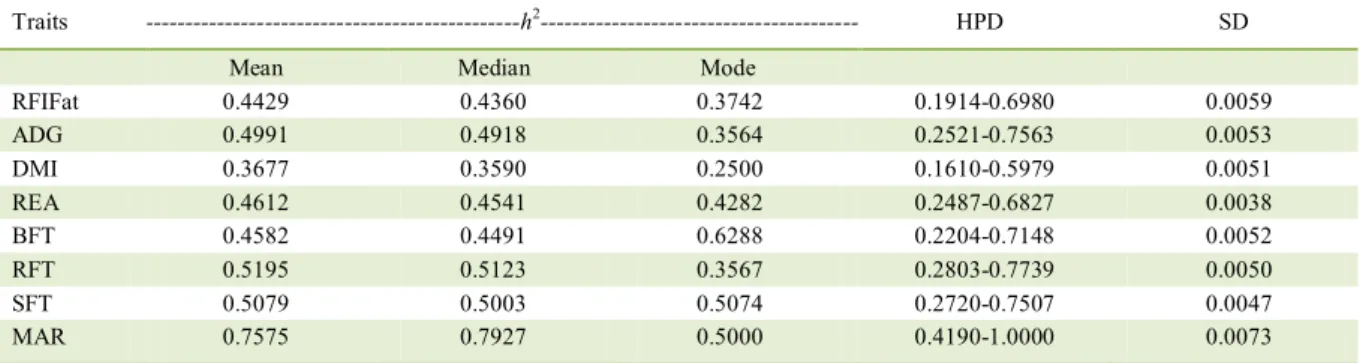
In a meta-analysis of 22 studies performed with various cattle breeds, DEL CLARO et al. (2012) estimated an RFI h2 of 0.25±0.008 (mean ± standard
error). Conversely, BERRY and CROWLEY (2012) estimated an RFI h2 of 0.45±0.06 (mean ± standard
error), which was closest to the mean ± standard deviation for RFIFat in this study (0.44±0.0059), despite the fact that they worked with taurine animals. This similarity may be due to the fact that European cattle breeds have high levels of fat depositions and high genetic variability for this trait. The DMI in studies by GRION et al. (2014), which were also performed with Nellore cattle, presented with higher h2 values, but for ADG, the h2 estimate was lower than
that reported in this study. In the studied population, h2 estimates for REA, BFT, and RFT (mean ± standard
error) were higher than those reported by CAETANO et al. (2013) (0.34±0.02, 0.23±0.02, and 0.31±0.02, respectively) and than those mean ± standard deviaton reported by SANTANA et al. (2014) (0.35±0.14, 0.21±0.08, and 0.38±0.16, respectively), who also worked with Nellore cattle. According to YOKOO et al. (2008), the REA is a determinant of carcass and meat cut quality, the BFT influences meat quality by protecting the carcass during the cooling process, and the RFT is an interesting trait for animals that were raised on pasture, because fat deposition begins earlier in the rump than the deposition of BFT.
The phenotypic correlation between RFIFat and ADG was close to zero (with an HPD of -0.41 at 0.67) (Figure 1), as was also reported by MAO et al. (2014) with Angus and Charolais animals, reaffirming the fact that the RFI is an independent measure of weight gain. The genetic
Table 1 - Means and standard deviations (SD) of the variables evaluated in the Nellore herd and their additive genetic (𝜎𝜎𝑎𝑎2), phenotypic
(𝜎𝜎𝑃𝑃2), and residual (𝜎𝜎
𝑅𝑅2) variance, in association with their high probability density region (HPD) and standard deviation (SD).
Traits Mean ± SD ---𝜎𝜎𝑎𝑎
2--- ---𝜎𝜎
𝑅𝑅2--- ---𝜎𝜎𝑃𝑃2---
Mean HPD SD Mean HPD SD Mean HPD SD
RFIFat 0.0009±0.53 0.14 0.05–0.24 0.0022 0.17 0.10–0.24 0.0014 0.32 0.27–0.36 0.0008
ADG 1.03±0.25 0.35 0.15–0.58 0.0045 0.34 0,18–0.48 0.0029 0.69 0.59–0.80 0.0016
DMI 7.59±1.46 0.26 0.08–0.44 0.0041 0.44 0.31–0.56 0.0027 0.70 0.61–0.80 0.0015
REA 65.78±9.62 26.70 12.15–41.80 0.2626 30.57 19.65–41.00 0.1727 57.27 49.87–65.50 0.0031
BFT 4.04±1.35 0.82 0.33–1.37 0.0111 0.94 0.55–1.28 0.0072 1.75 1.50–2.02 0.0042
RFT 5.07±1.26 0.94 0.41–1.51 0.0112 0.85 0.46–1.21 0.0071 1.79 1.53–2.06 0.0043
SFT 4.71±1.26 0.73 0.32–1.16 0.0083 0.69 0.37–0.95 0.0052 1.42 1.23–1.64 0.0032
MAR 1.95±0.47 0.20 0.08–0.31 0.0023 0.06 0.00–0.14 0.0016 0.26 0.20–0.33 0.0008
RFIFat = Residual feed intake adjusted for fat (kg/day), ADG = average daily gain (kg/day), DMI = dry matter intake (kgday-1
), REA = rib eye area (cm2
correlation between RFIFat and ADG was positive (0.13, with an HPD of -0.11 at 0.09) (Figure 1), which is in agreement with the findings of some studies (NKRUMAH et al, 2007; CROWLEY et al., 2010); however, ARTHUR et al. (2001) reported that these correlations are negative or equal to zero. The RFIFat is calculated based on phenotypic regressions of the production traits (observed consumption, average metabolic weight, ADG, and SFT) and it is not genetically independent of the component traits; the sign and magnitude of the genetic correlations are influenced by both genetic and environmental factors associated with food consumption.
The RFIFat showed strong and positive phenotypic (0.65, with an HPD of 0.48 at 0.94) and genetic correlations (0.75, with an HPD of 0.59 at 0.70) with the DMI as was reported by MAO et al. (2014) with RFI (0.58 and 0.75, respectively). This result was expected since the RFIFat represents the relationship between actual and predicted consumption. This genetic correlation is highly favorable, indicating that the less efficient animals (those with a positive RFIFat) are those that consume more dry matter and achieve the same weight gain, since the RFIFat is independent of ADG. Therefore, the RFIFat, which presents a high estimate of h2 (Table 2), can be used as a criterion
for the selection of feed efficiency, following the determination of animal traits or characteristics most important for each herd under selection according to the market to be reached.
BASARAB et al. (2003) and NKRUMAH et al. (2007) reported positive phenotypic correlations between RFI and carcass fat deposition that ranged from 0.14 to 0.30, and negative phenotypic
correlations between RFI and muscle deposition ranging from -0.21 to -0.14, stating that with respect to the RFI, the less efficient animals have greater fat deposition. In the studied Nellore herd, the RFIFat presented a phenotypic correlation that was next to zero for the studied carcass traits (Figure 1). Genetic correlations between RFIFat and carcass traits were negative, but they were associated with broad HPD, likely due to the small number of animals studied. Phenotypic and genetic correlations between carcass traits and RFIFat close to zero suggest that the selection for RFIFat will have insignificant effects on carcass quality.
By including adjustments for BFT in the RFI model, as conducted by MAO et al. (2014), there was an apparent reduction in the phenotypic correlation between RFI and BFT that decreased from 0.19 to 0.01 for Charolais steers and from 0.07 to 0.02 for Angus breed animals; there was also a reduction in the magnitude of the genetic correlation between RFI and BFT (0.42 to 0.23) and between RFI and MAR (0.14 to 0.02) in the Charolais steers, as well as a slight reduction in the genetic correlation with MAR in Angus steers (0.18 to 0.15). As was reportec in this study, the literature demonstrated that the phenotypic correlation between RFI and REA is low or even nil (BASARAB et al., 2003; NKRUMAH et al., 2007; LANCASTER et al., 2009), suggesting that adjusting for this trait would be of little use. Adjusting the RFI in the model will lead to a measure that is independent of the phenotypic trait that was adjusted.
The results reported in this research, in association with the findings in the literature,
Table 2 - Mean, median, and mode of the heritability estimates (h2) of the variables evaluated and their high probability density region
(HPD) and standard deviations (SD).
Traits ---h2--- HPD SD
Mean Median Mode
RFIFat 0.4429 0.4360 0.3742 0.1914-0.6980 0.0059
ADG 0.4991 0.4918 0.3564 0.2521-0.7563 0.0053
DMI 0.3677 0.3590 0.2500 0.1610-0.5979 0.0051
REA 0.4612 0.4541 0.4282 0.2487-0.6827 0.0038
BFT 0.4582 0.4491 0.6288 0.2204-0.7148 0.0052
RFT 0.5195 0.5123 0.3567 0.2803-0.7739 0.0050
SFT 0.5079 0.5003 0.5074 0.2720-0.7507 0.0047
MAR 0.7575 0.7927 0.5000 0.4190-1.0000 0.0073
RFIFat = residual feed intake adjusted for fat (kg day-1), ADG = average daily gain (kgday-1), DMI = dry matter intake (kg day-1), REA =
rib eye area (cm2), BFT = back fat thickness (mm), RFT = rump fat thickness (mm), SFT = subcutaneous fat thickness, MAR = marbling
suggested that by adjusting for fat in the RFI model, it will be possible to mitigate the negative impact of the selection of more feed efficient animals on carcass traits. Genetic and phenotypic analyses of RFI and their interpretations should be performed while bearing in mind the studied breed and the market demands that the herd intends to serve.
CONCLUSION
Genetic variability in RFIFat demonstrated that selecting for this trait can promote genetic gains, resulting in efficient food use animals. According to the genetic and phenotypic correlations, these animals will not exhibit significant negative changes in carcass traits.
ACKNOWLEDGEMENTS
Dr. Luciano Ribeiro (Matinha Ranch Farm) for providing the data. Coordenação de Aperfeiçoamento de Pessoal
de Nível Superior (CAPES) for providing financial support. English-language editing of this manuscript was provided by Journal Prep. Dr. Ignacy Misztal and collaborators for providing
free access to the RENUMF90, GIBBS1F90, and POSTGIBBSF90 software programs.
REFERENCES
ALMEIDA, R., et al. Consumo alimentar residual: um novo
parâmetro para avaliar a eficiência alimentar de bovinos de corte.
In: REUNIÃO ANUAL DA SOCIEDADE BRASILEIRA DE ZOOTECNIA, 41., 2004, Campo Grande - MS. Anais... SBZ, 2004. p.03-14.
ARTHUR, P.F. et al. Maternal productivity of Angus cows divergently selected for post-weaning residual feed intake.
Australian Journal of Experimental Agriculture, v.45, n.8, p.985-993, 2005. Available from: <http://www.publish.csiro.au/ paper/EA05052.htm>. Accessed: Sept. 22, 2015. doi: 10.1071.
ARTHUR, P.F. et al. Genetic and phenotypic variance and covariance components for feed intake, feed efficiency and
other postweaning traits in Angus cattle. Journal of Animal Science, v.79, n.11, p.2805-2811, 2001. Available from: <https://www.animalsciencepublications.org/publications/ jas/articles/79/11/2805>. Accessed: Aug. 29, 2015. doi: 2001.79112805.
BASARAB, J.A. et al. Residual feed intake and body composition in young growing cattle. Canadian Journal of Animal Science, v.8, n.2, p.189-204, 2003. Available from: <http://www. nrcresearchpress.com/doi/pdf/10.4141/A02-065>. Accessed: Sept. 12, 2015. doi: 10.4141/A02-065.
BERRY, D.P.; CROWLEY, J.J. Residual intake and body weight gain: anew measure of efficiency in growing cattle. Journal of Animal
Figure 1 - Genetic and phenotypic correlations between RFIFat and the other traits with their HPD, and Standard deaviation (SD). RFIFat = residual feed intake adjusted for fat (kg day-1), ADG = average daily gain (kg day-1), DMI = dry matter intake (kg day-1), REA
= rib eye area (cm2), BFT = back fat thickness (mm), RFT =rump fat thickness (mm), SFT = subcutaneous fat thickness, MAR =
Science, v.90, n.1, p.109-115, 2012. Available from: <https://www. animalsciencepublications.org/publications/jas/articles/90/1/109>. Accessed: Sept. 23, 2015. doi: 10.2527/jas.2011-4245.
CAETANO, S.L. et al. Estimates of genetic parameters for carcass, growth and reproductive traits in Nellore cattle. Livestock Science, v.155, n.1, p.1-7, 2013. Available from: <http://www.sciencedirect. com/science/article/pii/S1871141313001686>. Accessed: Oct. 13, 2015. doi: 10.1016/j.livsci.2013.04.004.
CROWLEY, J.J. et al. Phenotypic and genetic parameters for different measures of feed efficiency in different breeds of Irish
performance-tested beef bulls. Journal of Animal Science, v.88, n.3, p.885-894, 2010. Available from: <https://www. animalsciencepublications.org/publications/jas/articles/88/3/885>. Accessed: Sept. 02, 2015. doi: 10.2527/jas.2009-1852.
DEL CLARO, A. C. et al. Metaanalysis of genetic parameter
estimates of residual feed intake and of its component traits in cattle.
Pesquisa Agropecuária Brasileira, v.47, n.2, p.302-310, 2012. Available from: <http://www.scielo.br/scielo.php?script=sci_ arttext&pid=S0100-204X2012000200020>. Accessed: Sept. 05, 2015. doi: 10.1590.
GEWEKE, J. Evaluating the accuracy of sampling-based
approaches to the calculation of posterior moments. Bayesian Statistical, v.4, n.1, p.169-193, 1992. Available from: <http:// citeseerx.ist.psu.edu/viewdoc/download;jsessionid=BD177452F6
2A09165FA87C5498747CC7?doi=10.1.1.27.2952&rep=rep1&ty
pe=pdf>. Accessed: Aug. 17, 2015.
GOMES, R.C. et al. Protein synthesis and degradation gene SNPs related to feed intake, feed efficiency, growth,
andultrasoundcarcasstraitsin Nellorecattle. Genetic and Molecular Research, v.12, n.3 p.2923-2936,2013. Available from: <http://www.geneticsmr.com//year2013/vol12-3/pdf/gmr2593. pdf>. Accessed: Aug.17, 2015.
GRION, M.E.Z. et al. Selection for feed efficiency traits and
correlated genetic responses in feed intake and weight gain of Nellore cattle. Journal of Animal Science, v.92, n.3, p.955-965, 2014. Available from: <https://www.animalsciencepublications. org/publications/jas/articles/92/3/955>. Accessed: Aug. 28, 2015. doi: 10.2527/jas.2013-6682.
LANCASTER, P.A. et al. Phenotypic and genetic relationship of
residual feed intake with performance and ultrasound carcass traits in Brangus heifers. Journal of Animal Science, v.87, n.12, p.3887-3896,
2009. Available from: <https://www.animalsciencepublications.org/ publications/jas/articles/87/12/3887>. Accessed: Sept. 11, 2015. doi: 10.2527/jas.2009-2041.
LIMA, N.L.L. et al. Consumo alimentar residual como critério de
seleção para eficiência alimentar. Acta Veterinária Brasilica, v.7, n.4, p.255-260, 2013. Available from: <http://periodicos.ufersa. edu.br/revistas/index.php/acta/article/view/3269>. Accessed: Jun. 29, 2015. ISSN 1981-5484.
MAO, F. et al. Phenotypic and genetic relationships of feed efficiency with growth performance, ultrasound, and carcass merit
traits in Angus and Charolais steers. Journal of Animal Science, v.91, n.5, p.2067-2076, 2013. Available from: <https://www. animalsciencepublications.org/publications/jas/articles/91/5/2067>. Accessed: Sept. 04, 2015. doi: 10.2527/jas.2012-5470.
MISZTAL, I. et al. Using recursion to compute the inverse of the genomic relationship matrix. Journal of Dairy Science,v.97, n.6, p.3943-3952, 2014. Available from: <http://www.
journalofdairyscience.org/article/S0022-0302(14)00224-0/pdf>.
Accessed: Oct. 29, 2015. doi: 10.3168/jds.2013-7752.
NKRUMAH, J.D. et al. Genetic and phenotypic relationships of feed intake and measures of efficiency with growth and carcass merit of
beef cattle. Journal of Animal Science, v.85, n.10, p.2711-2720, 2007. Available from: <https://www.animalsciencepublications. org/publications/jas/articles/85/10/0852711>. Accessed: Sept. 22, 2015. doi: 10.2527/jas.2006-767.
R CORE TEAM. R: alanguage and environment for statistical computing. R Foundation for Statistical Computing. Vienna, Austria, 2015. Available from: <http://www.R-project.org/>. Accessed: Jun. 22, 2015.
SANTANA, M.H.A.et al. Genetic parameter estimates for feed
efficiency and dry matter intake and their association with growth
and carcass traits in Nellore cattle. Livestock Science, v.67, n.1, p.80-85, 2014. Available from: <http://www.sciencedirect.com/ science/article/pii/S1871141314003096>. Accessed: Oct. 21, 2015. doi: 10.1016/j.livsci.2014.06.002.