REVISTA DE CIÊNCIAS AMBIENTAIS - RCA (ISSN 1981-8858)
http://www.revistas.unilasalle.edu.br/index.php/Rbca Canoas, vol. 7, n. 2, 2013
BACKGROUND VALUES FOR CHEMICAL ELEMENTS IN SEDIMENTS
OF THE GUALAXO DO NORTE RIVER BASIN, MG, BRAZIL
Aline Sueli de Lima Rodrigues1, 2
Guilherme Malafaia2
Adivane Teresinha Costa3
Hermínio Arias Nalini Júnior3
ABSTRACT
The aim of this study was to establish local background values for Fe, As, Pb, Mn, Ba, Zn and Ni us-ing sediments from cutbanks and alluvial terraces of the Gualaxo do Norte River basin, Minas Gerais State, Brazil. A total of 16 stratigraphic sections were surveyed along the basin and 120 samples were analyzed. To establish background values we took into account mineralogical and grain-size analyses, faciologic interpretations, geochemical evaluations (by means of aqua regia partial digestion and
ICP-OES readings), and the application of statistical techniques (boxplot representations, iterative 2σ tech -nique, cumulative frequency curve and calculated distribution function). The results reveal relatively high background values for As, Pb, Mn, Ba, Zn and Ni (respectively 64.2; 43.8; 1636.0; 141.4; 65.3 and 39.0 mg.kg-1). The concentrations of these elements are possibly related to the local geology, being the concentrations higher than these values linked to mining activity in the study region, in special gold
mining. On the other hand, the background values established for Fe is lower than the values identified
in the majority of the sections analyzed. The background value established for Fe corresponds to a
con-centration of 8.2%. However, concon-centrations higher than 48% were identified in the study area. There is
a strong evidence of Fe enrichment due to mining at the head of the basin. In conclusion, we can say that the proposed values are important parameters for local environmental/territorial management and may help alerting public managers of the necessity of remediation of certain sites, where anomalous toxic
element concentrations are identified.
Keywords: environmental contamination, heavy metals, reference values, environmental geochemistry and iron mining
RESUMO
Valores de background para elementos químicos em sedimentos da bacia do rio Gualaxo do Norte, MG, Brasil. Este estudo teve como objetivo estabelecer valores de background locais para os elementos
1 Programa de Pós-graduação em Evolução Crustal e Recursos Naturais, Universidade Federal de Ouro Preto – UFOP. E-mail
para correspondência: [email protected]
Fe, As, Pb, Mn, Ba, Zn e Ni, utilizando sedimentos de cutbanks e terraços aluviais da bacia do rio
Gua-laxo do Norte, MG, Brasil. Um total de 16 perfis estratigráficos foi levantado ao longo da bacia e 120
amostras foram analisadas. No estabelecimento dos valores de background consideraram-se análises mineralógicas, granulométricas, interpretações faciológicas, avaliações geoquímicas (por digestão
par-cial com água régia e leitura via ICP-OES) e aplicação de técnicas estatísticas (representações boxplot,
técnica iterativa 2σ, curva de frequência acumulada e a função de distribuição calculada). Os resultados
evidenciam valores de background relativamente elevados para os elementos As, Pb, Mn, Ba, Zn e Ni cujas concentrações possivelmente estão relacionadas com a geologia local, estando as concentrações superiores a esses valores ligadas a atividades de exploração mineral, especialmente a aurífera. Para o Fe o valor de background estabelecido é inferior aos valores identificados na maioria dos perfis analisados. O valor de background estabelecido para o Fe correspondeu a uma concentração de 8,2%. No entanto,
concentrações superiores a 48% foram identificadas na área de estudo. Nesses casos, há forte evidência de enriquecimento do elemento pela mineração do elemento na cabeceira da bacia hidrográfica inves -tigada. Em conclusão, pode-se dizer que os valores propostos são importantes para a gestão ambiental/ territorial local, servindo de subsídios para a confecção de guias de alerta aos gestores públicos com
relação à necessidade de remediação de locais onde são identificadas concentrações anômalas de ele -mentos tóxicos.
Palavras-chave: contaminação ambiental, metais pesados, valores de referência, geoquímica ambiental e mineração de ferro
INTRODUCTION
Gałuszka (2007) highlighted the need in recent environmental studies to establish of background
values for chemical elements and organic compounds in biotic and abiotic systems. Interference of natural distributions and alterations caused by anthropogenic activities is an important issue, with important im-plications in geological, toxicological and biologic studies. This is especially important when dealing with geochemical analyses of toxic elements.
As discussed in Reimann and Garret (2005), there is no clear definition for the term geochemical
background. However, many authors, including Matschullat et al. (2000), Reimann et al. (2005) and
Gałuszka (2007), define geochemical background as a reference to distinguish natural concentrations of
a certain element from the concentrations affected by anthropogenic activities, considering temporal and spatial variables of the area under investigation. For these authors, the establishment of geochemical back-ground values for certain elements is crucial, because it enables the separation of geogenic contributions to a certain environment (i.e., waters, soils, sediments, plants) from those of anthropogenic origin. Once these values are established, it is possible, for example, to elaborate geochemical maps focusing on the geoenvironment. These maps are considered important tools to territorial management and can be turned into alert guides to public managers, warning them on the necessity of remediation of sites where
anoma-lous concentrations of toxic elements are identified.
There are a large number of methodologies to establish geochemical background values, which are recurrent in several studies (Matschullat et al., 2000; Reimann et al., 2005; Gałuszka, 2006; Mrvić et al., 2011; Zhang et al., 2011). Among the methods that are usually used in studies involving the determination of the background of chemical elements, direct (geochemical) and indirect (statistical) methods stand out.
inter-ference (Crommentuijn, et al. 2000; Baize and Sterckeman, 2001; Horckmans et al., 2005). Background values are determined using mean metal concentration values obtained for an area or sedimentary deposit that has not undergone anthropogenic interference. The indirect method, also named statistical method,
demands the specific knowledge of exploration methods for which the relationship cost/surveyed area is preferably low. The intrinsic characteristic of such method is the use of finite statistical samples, which
constitute the whole or part of a population represented by samples effectively collected and from which the required quantitative data are obtained (Frizzo et al., 2007). By means of procedures or statistical tech-niques performed by appropriate softwares, the data set relative to different chemical elements is analyzed and from this analysis it is possible to interpret the data and make considerations and inferences on the sampled population and consequently on the study area. Among the statistical methods, the following have
been widely applied: the iterative 2σ technique, the cumulative frequency curve in linear scale, boxplot
representations, histograms, among others (Teng et al., 2009; Costa et al., 2010; Peh et al., 2010; Mrvić et al., 2011; Zglobicki et al., 2011; Mrvić et al., 2012).
However, difficulties are encountered when trying to establish a system comprehensive enough to
encompass reference patterns for heavy metals, in order to evaluate areas suspected to be contaminated.
Such difficulties result from the lack of systematic studies and mainly of particularities intrinsic of each
study area. In Brazil, a few studies have been developed with the objective of understanding and/or
dif-ferentiating the influence of geogenic and anthropic contributions in the dynamics of contaminating ele
-ments. Despite some studies exist that put in evidence the presence of heavy metals in fluvial sediments
(Lewin and Macklin, 1987; Taylor and Lewin, 1996; Brewer and Taylor, 1997; Eleutério, 1997; Costa, 2001; Costa et al., 2010), studies that aim at establishing reference patterns for such elements are scarce, in particular when the objects of study are deposits formed at different times, such as recent and older sediments (cutbanks and alluvial terraces, respectively). The establishment of geochemical background values taking into account not only the chemical element concentrations, but also geologic, faciologic and mineralogic characteristics, has not been very much practiced. In Brazil pioneer studies applying this approach were carried out only by Costa (2007) and Costa et al. (2010).
In this context, this work aims at establishing local geochemical background values for Fe, As, Pb, Mn, Ba, Zn and Ni, using sediments from cutbanks and alluvial terraces of the Gualaxo do Norte River ba-sin, Minas Gerais, Brazil. The anthropic activity in the Gualaxo do Norte River area is intense, particularly iron ore and gold mining, the latter having been practiced in the last 300 years. We hope that this study can contribute for the elaboration of environmental and public health political plans, which can minimize the impacts caused by mining activities in the study region.
MATERIAL AND METHODS
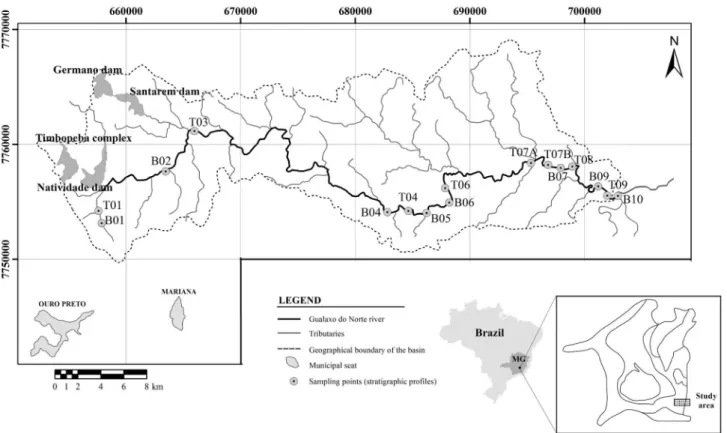
Samples from eight cutbanks and eight alluvial terraces located along the Gualaxo do Norte River basin were collected. The head is northeast of Ouro Preto and northwest of Mariana (Fig. 1). The basin
crosses several units of the Quadrilátero Ferrífero, which is considered one of the largest and well-known
medium and lower courses run through the Santa Bárbara, Acaiaca and Mantiqueira Metamorphic Com -plexes, and also the Rio das Velhas Supergroup schists and quartzites (Costa, 2001).
At the locations where cutbank and alluvial terrace deposits were identified (Figure 1) sections were
drawn documenting the facies, similarly to the method adopted by Costa et al. (2010). Sediment samples from all strata were collected for grain-size, mineralogical and geochemical analyses, totaling 120 sam-ples. To determine chemical element concentrations, fractions of grain-size less than 63 µm were partially digested with aqua regia, following Rauret et al. (1999) and Shiowatana et al. (2001) recommendations. The analyses were carried out at the Environmental Geochemistry Laboratory (Degeo/UFOP), by means of atomic emission spectrometry (ICP-OES – Spectro, model Ciros CCD).
For C14 dating, samples of carbonaceous material found in some stratigraphic sections were collect-ed. C14 dating was performed by the Radiocarbon Laboratory of the University of Waikato of New Zealand (equipped with an Accelerator Mass Spectrometer). It is worth mentioning that the geochronologic data thus obtained helped correlate the anomalous chemical element concentration levels with the deposition age, making the understanding of the relationship between these values and mining activities in the study area possible.
Figure 1. Geographic location of the Gualaxo do Norte River basin, Minas Gerais, Brazil, and sampled points.
It is important to stress that all the analyses were useful in the recognition of anthropogenic influence
in chemical element concentrations. Efforts were made to eliminate biases that could cause overestimation of the results obtained. Samples from sediments that were known to have been affected by anthropogenic activities were analyzed separately from those with no evidence of anthropogenic metal enrichment.
Pri-or to the application of the specific techniques fPri-or the determination of background values, the Pri-original
as recommended by Burrough et al. (1996). In the present study the following descriptive explorato-ry techniques were adopted: tests for normality (Anderson-Darling, Lilliefors, Kolmogorov-Smirnov), mean, median, standard deviation, maximum, minimum, dispersion graphs, histograms, parametric and non-parametric tests for mean comparison, among others. All these techniques helped identifying trends, discrepant points, distribution types, choose the analysis to be applied and characterize variability.
Specific techniques were chosen for the determination of local geochemical background values.
Because many techniques can be used in geochemical background studies and because all of them have advantages and disadvantages, more than one statistical technique was applied in this work, such as:
boxplot representations, iterative 2σ technique, cumulative frequency curve and the calculated distribu -tion func-tion. The use of some of these techniques can be observed in the following studies: Panno et al. (2006), Díez et al. (2007), Micó et al. (2007), Galán et al. (2008), Pérez-Sirvent et al. (2009), Teng et al. (2009), Costa et al. (2010), Nakić et al. (2010), Peh et al. (2010), Guillén et al.(2011), Mrvić et al. (2011) and Zglobicki et al. (2011).
The results obtained from the application of different techniques were analyzed and the background values were established from the arithmetic mean of the values obtained by each technique. Such decision
was based on the method adopted in Zgłobicki et al. (2011). It is stressed out that the statistical techniques
adopted in this work are similar to those adopted by Zgłobicki et al. (2011). Four statistical techniques were used to establish the background values, namely: boxplot representations (Tukey 1977), cumulative frequency curves (Lepeltier, 1969; Matschullat et al., 2000), iterative 2σ technique (Erhardt et al., 1998; Matschullat et al., 2000) and calculated distribution function (Matschullat et al., 2000). A detailed descrip-tion of the statistical techniques used is given below, followed by the results obtained for Fe, As, Pb, Mn, Ba, Zn and Ni.
Statistical Methods
Boxplot representations
The method proposed by Tukey (1977) was adopted to define background values by means of box -plotrepresentations. Initially, ranges were determined by delimiting the interquartile (IQ) range augmented 1.5 times. From the range thus obtained the background value was considered as the upper limit given by [UL=Q3+1/2(1.5IQ–IQ)], where UL = upper limit and Q3 = upper quartile. The Minitab® software was used to draw the boxplot representations.
Cumulative frequency curves
The establishment of background values for the chemical elements chosen was also carried out using an approximation of the Lepeltier (1969) statistical method, which is the cumulative frequency curves in linear scale, as also proposed by Matschullat et al. (2000). In a general way, the original data are plotted in a spreadsheet and the curves are drawn by a statistics software (in this case, Minitab®). For the analysis of the curves and subsequent establishment of background values, the procedure proposed by Costa et al.
1. Two inflection points: This clearly indicates the existence of three distinct data populations. In this
case, a range is defined from the lower to the upper inflection points. This range represents the most homogeneous data of the whole data set and the background value is defined as the upper
limit of this range.
2. Multiple inflection points: The presence of several populations is observed in this case. Their cha
-racteristics may have been influenced by natural or anthropogenic factors. The establishment of background values must take into consideration the homogeneity of the data within each defined
population. In other words, the background population will be that most representative of the who-le data set and the background value will be the upper limit of such population.
3. Iterative 2σ technique: According to Erhardt et al. (1998) and Matschullat et al. (2000), the
iterati-ve 2σ technique [mean ± 2σ] is mainly used to define background values because it approximates
the original data set to a normal distribution. In practice, the technique consists in the calculation of
the mean and the standard deviation (σ) of the data set. After that, all the values outside the range [mean ± 2σ] are excluded. Such procedure is repeated until all the values of the remaining data set are constrained to the range [mean ± 2σ] (Matschullat et al., 2000). This range is then considered the background range for the analyzed element and the background value is the upper limit of this range.
To apply this technique the freeware Visual Basic macro entitled VB Background® (MS Excel) and
developed by Nakić et al. (2007) was used. According to these authors, VB Background®, as it
incorpo-rates algorithms of the iterative 2σ technique, allows the automated treatment of the geochemical data,
making the generation of background values for chemical parameters possible. At the same time, the ma-cro generates a graphic representation that helps the interpretation of the data.
Calculated distribution function
The calculated distribution function, as described by Matschullat et al. (2000), aims at defining the
upper limit of natural concentrations. The use of such technique is recommended when anthropogenic activities tend to cause enrichments in the natural systems, causing positive anomalies shown in a
distri-bution function as a positive asymmetry of a normal curve (Nakić et al., 2007). The lowest values must
therefore be free of anthropic influence (Matschullat et al., 2000). For the application of this technique the macro VB Background® was also used.
Algorithms based on the calculated distribution function are used to calculate the median of the ori-ginal data set and all the values above the median are eliminated. Then, VB Background® “mirrors” all the remaining values against the calculated median value, according to: [“mirrored” value = median – value
of each datum + median] (Nakić et al., 2007). The macro calculates the mean and the standard deviation
for the prepared data and the range [mean ± 2σ]. After calculating [mean ± 2σ], all the values outside the
calculated range are excluded. Next, the macro calculates the accumulated normal distribution for the new mean and the standard deviation. Finally, the macro generates a graph showing a histogram (for the ori-ginal data and the background range), as well as the cumulative frequency curve for the oriori-ginal data and background and the normal distribution curve.
have the advantage of not requiring that the combined (processed) total data follow normal or log-normal
distribution, and can be applied to a relatively small data set (n > 30) (Nakić et al., 2007). Besides, both
techniques calculate the normal range of background values with 95% confidence. The macro VB Back-ground® supplies the T and critical T (T
crit) values from the Lilliefors (1969) normality test, which is an adaptation of the Kolmogorov-Smirnov procedure. The application of such techniques is considered valid only when T is lower than Tcrit. If T is higher than Tcrit, the number of anomalous samples is larger or equal to the number of background samples, which means that the background values are overestimated.
For some elements the statistical techniques were applied to the whole data set with no distinction between those coming from the cutbanks or from alluvial terraces, whereas for others, the data were analy-zed separately.
RESULTS AND DISCUSSION
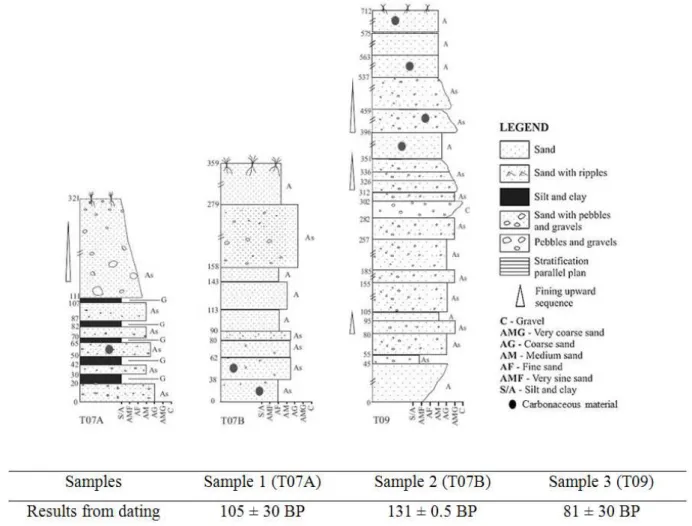
Regarding Fe, samples unaffected by anthropogenic interference were chosen. Mining upstream the Gualaxo do Norte River basin causes increase in Fe concentrations in sediments. The samples were col-lected in the T07A, T07B and T09 terraces for which C14 dating of carbonaceous material revealed ages older than 80 years (Figure 2). This age is previous to the installation of iron ore mining activities, which started approximately 40 years ago in the basin.
Figure 2. Alluvial terraces used to establish the background range for Fe and the results of C14 dating of
Once the samples to be analyzed were chosen, the statistical techniques to determine the background range were applied, excepting the cumulative frequency curve. Such technique was discarded since it is not recommended for a sample sets with n < 50 (Matschullat et al., 2000). The values obtained for Fe and other elements are presented in Table 1.
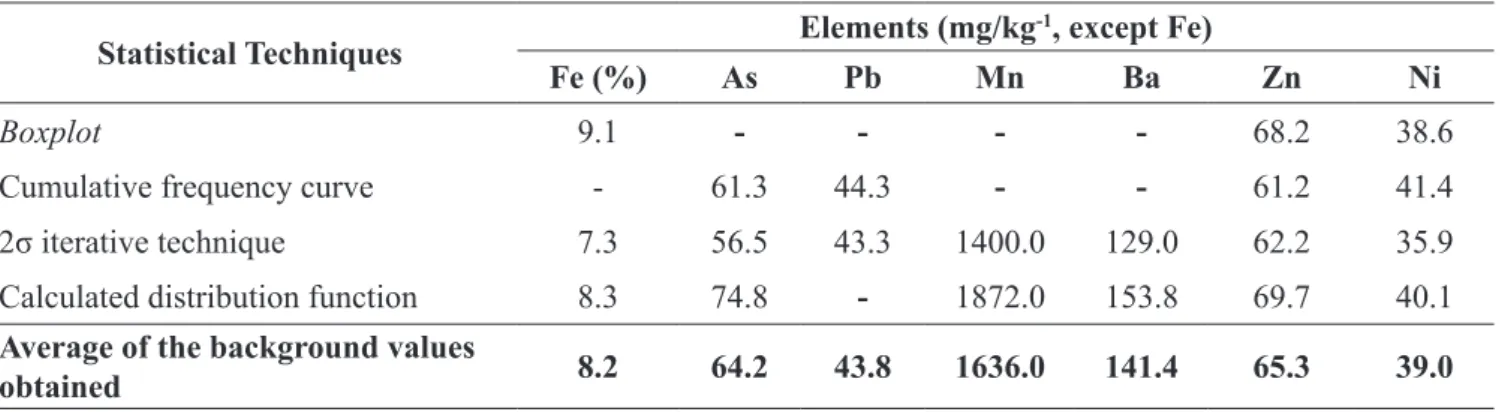
Table 1. Background ranges established for the elements studied in this work.
Statistical Techniques Elements (mg/kg
-1, except Fe)
Fe (%) As Pb Mn Ba Zn Ni
Boxplot 9.1 - - - - 68.2 38.6
Cumulative frequency curve - 61.3 44.3 - - 61.2 41.4
2σ iterative technique 7.3 56.5 43.3 1400.0 129.0 62.2 35.9
Calculated distribution function 8.3 74.8 - 1872.0 153.8 69.7 40.1
Average of the background values
obtained 8.2 64.2 43.8 1636.0 141.4 65.3 39.0
Note: (-) technique not applicable to the analyzed data set.
Fe concentrations up to 8.2% can be associated with supracrustal rocks from the Rio das Velhas
and Minas supergroups, which are enriched in Fe oxides. In the specific case of the study area, there are evidences that an increase of iron in fluvial sediments is related to iron ore mining activities located up -stream. Leakage from Fe oxide-rich tailings causes Fe enrichment in sediments along the basin’s main water course. Higher Fe concentrations were detected in the bank sediments of the main river (>20%), when compared to the Fe concentrations in the sediments of its tributaries (<12%) (data not discussed in
this article). Visual observation reveals the deposition of dark, fine sediments rich in Fe oxides along the
basin’s main river and not along its tributaries.
The establishment of background values for As was based on three statistical techniques: cumulative
frequency curve, iterative 2σ technique and calculated distribution function, applied to the whole sample
set (no distinction between cutbanks and terraces). The boxplot representation was not used because, ac-cording to Reimann et al. (2005), it is more informative when the number of outliers is less than 10%. In our case, the number of anomalous samples represented 13.6% of the total analyzed for As, thus making the use of this technique less usefull.
It is necessary mentioning that all samples of all sections were used for the establishment of the background value for As, as no geochronological data were available to justify selection of samples.
Samples older than the historical gold mining activities were not identified, although As concentrations
in the alluvial terraces T07A, T07B, T08 and T09 were not directly or indirectly related to anthropogenic activities (Table 1).
The relatively high As concentrations (up to 64.2 mg.kg-1) (Table 1) can be linked to natural As
enrichment, possibly originated from the presence of sulfides, sulfoarsenides and arsenides such as ar -senopyrite, which is common in the study area. Besides, As can also be associated with the crystalline structures of primary minerals, silicates or aluminates, constituting an inert or residual fraction of the
made available from source areas associated with gold mineralization and enriched in deposition areas downstream.
The anomalous As concentrations were identified in facies characterized by the presence of strati -graphically disordered gravels and boulders, where predominant minerals are quartz, magnetite, hematite, feldspar, gibbsite, kyanite and tourmaline. These facies are interpreted as canals with direct or indirect in-terference of mining activities such as digging or dredging. The excellent sorting of coarse grains observed
in these facies is not expected from natural processes operating in fluvial systems. Such sorting resulted
from rudimentary techniques such as the use of transversal dikes to break the water course, which forced the dredged sediments to deposit, washing the heavier sediment in the pans or carpets. Moreover, such sorting can also result from rudimentary mining by means of picking, where gravel is also separated. In the
study region bombs were intensely used to remove fine sediments and force canal deviations.
As for arsenic, the establishment of background values for Pb was based on the cumulative
frequen-cy curve and iterative 2σ techniques, using all the analyzed samples (cutbanks and terraces). The boxplot
representation, in this case, was not used, since the number of outlier values corresponded to 24% of the data set, making the use of this technique less usefull (Reimann et al., 2005). The calculated distribution function technique was discarded due to T being higher than Tcrit. The background values are presented in table 1.
Pb concentrations up to 43.8 mg.kg-1 can be of natural origin, specifically related to the host rocks
(Rio das Velhas Supergroup) of gold mineralization, associated with sulfide veins. On the other hand, it
is possible that the concentrations higher than this value are related to human activities causing Pb
en-richment in fluvial sediments. The observation of high Pb concentrations in all samples (median of 81.1
mg.kg-1) collected in sections located in the head of the basin (B01, B02, T01 and T02) corroborates the hypothesis of Pb enrichment due to gold and iron ore mining. Both As and Pb occur naturally in the rocks
hosting the gold mineralization, associated with sulfide veins exposed when the mines are open for gold
extraction. Besides, Pb can also be associated with galena (PbS), which occurs in deposits associated with
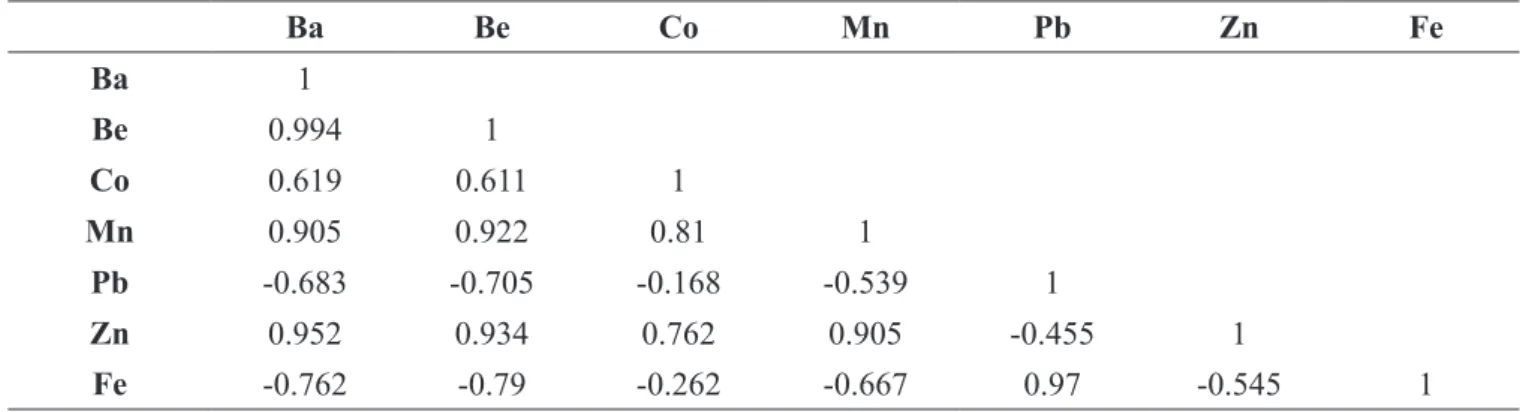
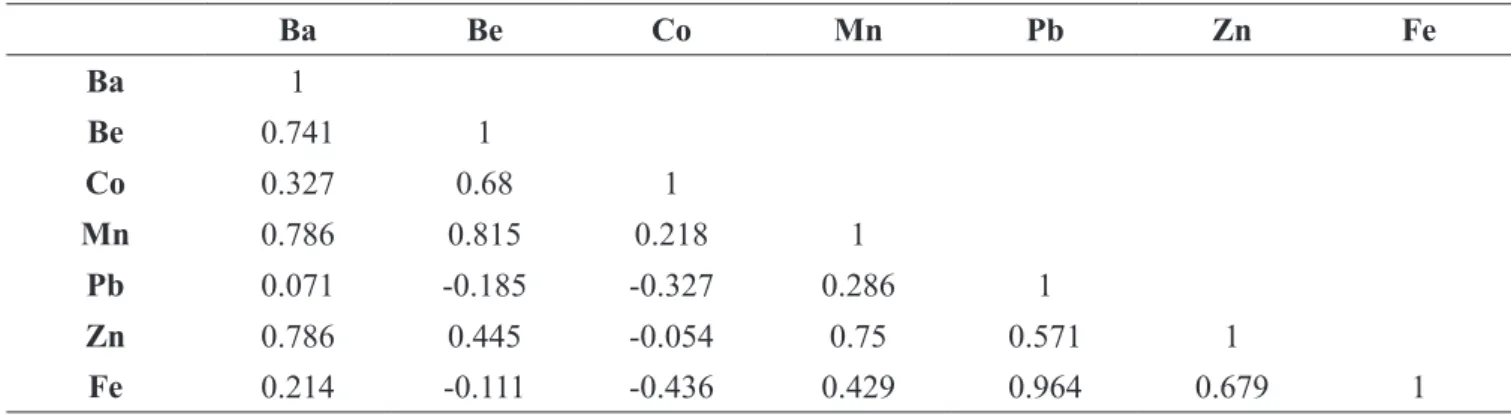
Fe. The strong correlation between Fe and Pb (ρ=0.97) seen in section T01, for example, attests for this
hypothesis (Table 2). In section T03, the strong positive Fe-Pb correlation and the weak correlation with other elements (Table 3) show a pattern similar to the observed in terrace T01. In addition, Pb can be asso-ciated with Fe and Mn oxides-hydroxides that envelope clay particles, as indicated by the strong
correla-tion between Al and Pb concentracorrela-tions (ρ>0.85) (the clay particles present aluminosilicatic composicorrela-tion).
Table 2. Spearman correlation matrix for the concentrations of some trace elements identified in section T01.
Ba Be Co Mn Pb Zn Fe
Ba 1
Be 0.994 1
Co 0.619 0.611 1
Mn 0.905 0.922 0.81 1
Pb -0.683 -0.705 -0.168 -0.539 1
Zn 0.952 0.934 0.762 0.905 -0.455 1
Table 3. Spearman correlation matrix for the concentrations of some trace elements identified in section T03.
Ba Be Co Mn Pb Zn Fe
Ba 1
Be 0.741 1
Co 0.327 0.68 1
Mn 0.786 0.815 0.218 1
Pb 0.071 -0.185 -0.327 0.286 1
Zn 0.786 0.445 -0.054 0.75 0.571 1
Fe 0.214 -0.111 -0.436 0.429 0.964 0.679 1
For Mn, background values were proposed from samples collected in terraces T07A, T07B and T09.
The choice of these terraces is justified by the fact that they are older than the Miguel Congo manganese
mine exploitation (intensely mined in the 1980’s), localized in the upper Gualaxo do Norte River basin.
The data were analyzed via the iterative 2σ technique and the calculated distribution function. The boxplot
representation was discarded, once anomalous values represented more than 12% of the total data set relat-ed to the alluvial terraces, making the use of this technique impossible. The frequency curve was discardrelat-ed because the number of samples analyzed was less than 50.
It is considered as local background value for Mn the concentration of 1,636 mg.kg-1. It is import-ant to stress out that Mn concentrations are usually high in the study area and are mainly associated with Fe occurrences, being such elements siderophile or lithophile. The Mn exploitation in the Miguel Congo mine corroborates to the hypothesis that high Mn concentrations are natural in the basin. However, it is worth mentioning that concentrations higher than the established background value can be directly linked with anthropic activities, which can mobilize Mn to the environment during and after mining operations. The median Mn concentration for the samples from the stratigraphic sections of the basin’s upper course was 12,180 mg.kg-1, whereas in the sections located farther from the head the median was 1,040 mg.kg-1. A concentration higher than 26,000 mg.kg-1 was found in the upper stratum of cutbank B01 (set 30-38 cm), located in the basin’s upper course.
As for Mn, background values for Ba were obtained using the samples from terraces T07A, T07B and T09, once they are older than the Mn mining in Miguel Congo. In the sections of this part of the basin (T01, T03, B01 and B02) a strong correlation was observed between Ba and Mn (p > 0.81). Such cor-relation could justify the availability of both elements in the sediments as a consequence of mining. High Ba concentrations were observed in all points sampled in the basin’s upper course, as shown by Costa
(2001), when investigating canal and flood plain sediments. The author attested high Ba concentrations
(from 458.0 to 655.0 mg.kg-1) in all points sampled in the upper course of the Gualaxo do Norte river basin. Besides, Cabral et al. (2002) report the existence of Mn minerals with important Ba contents in the
Quadrilátero Ferrífero, which corroborates to the hypothesis of a common origin for these elements.The data were treated applying the following statistical techniques: iterative 2σ and calculated distribution
function. The boxplot representation and cumulative frequency curve were discarded for the same reasons presented for Mn. The proposed background values are given in table 1.
complexes with clays (kaolinite and montmorillonite) and Fe or Mn oxides-hydroxides. However, concen-trations higher than this value seem to be related to gold occurrences, as mining plays an equally important role in increasing Ba in sediments (Table 1).
The establishment of background values for Zn was made by means of the four statistical
tech-niques mentioned before and using the whole sample set. The use of all samples is justified because Zn concentrations in the cutbanks and alluvial terraces do not show statistically significant differences (p
= 0.29) according to the Mann-Whitney test. The background value established for Zn is 65.3 mg.kg-1.
Concentrations up to this value can be associated with the occurrence of sulfide-bearing rocks containing
chalcopyrite and galena. On the other hand, concentrations above the established background value could be explained by enrichment caused by anthropogenic activities, especially gold mining, which also
mobi-lizes the element to fluvial sediments. According to Rodrigues-Filho and Maddock (1997), in gold mining areas during ore beneficiation, dense elements such as Zn can be concentrated, causing the contamination
of waters and sediments.
Also for Ni, the background values were established applying the four techniques previously de-scribed and using all samples analyzed. The background value established for Ni is 39 mg.kg-1. Ni is a siderophile element, found in more than 80 minerals, relatively high concentrations occurring in
ferromag-nesian minerals and sulfides, which are common in the study area.
To determine and distinguish the geogenic or anthropogenic origins of the concentrations of chem-ical elements in the ecosystem is of relevant importance, once they can attest actions in favor of environ-mental conservation and remediation, in cases of contamination or contamination potential. In this sense, studies that aim at proposing background values are necessary to decision making directed to the
environ-mental issues. Not knowing them may cause under- or overestimation of the significance of contamination
levels in a certain area (Hursthose, 2001).
However, these same studies present peculiarities that many times lead to polemic and hard criti-cism. Such peculiarities are mainly related to the diversity of methods that can be used in the establishment of background values (and that vary from researcher to researcher) and the scarcity of studies, which many
times make the comparison of results reported in the few existing works difficult or even impossible. As discussed by Poleto and Merten (2008), this difficulty increases due to the impossibility of a universal
-ization of proposed values, because they are exclusive to a study area. Significantly high values can be
obtained for a certain area and not for another, simply because of mineralogic/geologic differences in each of them, fact that makes it not meaning reliable to use data produced in other regions or countries.
When it comes to fluvial sediments, the lack of local, regional or national studies for the establish -ment of background values is even more important, due to the recognition that the majority of the few
existing works establish background values for soil and water. In Brazil there is not a specific legislation
the basis for the project named Integrated and Hierarchic Evaluation of the Sediment Quality (AIHQS), in which VGQS in use in Canada and USA were employed as guides to certain actions (physical, chemical, biologic and ecotoxicologic analyses) taken at the different steps of the decision tree.
Despite QualiSed, there are no regulated and validated VGQS by Brazilian official environmental
agencies. The legal instrument that is close to this “regulation and validation” is the #344 resolution of the National Environment Council (CONAMA). Such resolution was created aiming at establishing general guidelines and minimal procedures for the evaluation of the material to be dredged and the managing of it
disposal (CONAMA, 2004). In the resolution two levels or limits for the material to be dredged are fixed: level I, which refers to a threshold below which low probability of adverse effects to the biota are expect-ed, and level II, which refers to a threshold above which a probable adverse effect to the biota is expected. However, due to the lack of Brazilian studies that could support the proposal of national threshold values and the fact that this resolution is exclusively based on international recommendations, such as Canadian
and North American, such resolution is faulty and in many cases the suggested VGQS do not reflect the
Brazilian reality.
Internationally some studies have proposed VGQS, which in practice are scientific tools that synthe -size information on the relationships between pollutant concentrations in sediments and any adverse effect resulting from the exposure to contaminants. Such studies have been conducted by several federal, statal or provincial agencies, moreover in North America for fresh water and coastal and marine ecosystems. As reviewed by Silvério (2003), several VGQS can be found in the literature for metals in aquatic sediments:
i) partition equilibrium (VGQS of the volatilizable sulfides by acidification and interstitial waters) (Ank -ley, 1996); ii) SEL (severe effect level) and LEL (lowest effect level) (Persaud et al., 1993); iii) ERL (effect range-low) and ERM (effect range-median) (Long and Morgan, 1991); iv) TEL (threshold effect level) and PEL (probable effect level) (Smith et al., 1996); v) AET (apparent effect threshold) (Alden and Rule, 1992); vi) TEC (threshold effect concentration) and PEC (probable effect concentration) (MacDonald, 2000), and vii) LRM (linear regression model) (Field et al., 1999).
The VGQS proposed by the legislation of Canada (CCME, 2001), North America (USEPA, 2003) and Brazil (CONAMA, 2004) are presented in Chart 1 together with the background values proposed by Crommentuijn et al. (2000) (used by the Dutch government) and those proposed by Costa (2007), which
are values obtained for the Ribeirão do Carmo basin, also in the Quadrilátero Ferrífero, using flood plain
and alluvial terrace sediments. This last study is closest to our study region. As can be seen in Chart 1, there is a large variation regarding the values proposed by the different studies when compared to local
background ranges proposed here. These differences specifically reflect the distinct natural or anthropized
characteristics of the study areas, for which the values were proposed. Therefore, the comparison of the background ranges proposed here in relation to the values established by other studies is limited or
Chart 1. Background values proposed for varied studies and those proposed in this work.
Reference Elements (mg.kg
-1)
As Fe1 Pb Ba Mn Zn Ni
Crommentuijn et al. (2000) Negligible
concentration (CN) 31.0 - 132.0 157.0 - 145.0 35.0
Maximum permitted
concentration (CMP) 190.0 - 4800.0 300.0 - 620.0 44.0
Background
concentration (CB) 29.0 - 85.0 155.0 - 140.0 35.0
Canadian legislation (CCME, 2001)
TEL 5.9 - 35.0 - - 123.0 18.0
PEL 17.0 - 91.3 - - 315.0 35.9
North-American legislation (EPA, 2004)
TEL - - 30.2 - - - 124.0
PEL - - 112.0 - - - 271.0
Brazilian legislation (CONAMA, 2004)2
Level 1 5.9 - 35.0 - - 123.0 18.0
Level 2 17.0 - 91.3 - - 315.0 35.9
Costa et al. (2007) Geochemical
method3 2.0 (10.0) -
-25.0 (130.0) 218.0 (1911.0) 68.0 (513.0) 18.0 (104.0) Statistical method3
Ribeirão do Carmo Basin
35.3
(810.0) - - 18.5 (-)
189.8
(5800.0) 124.0 (-) 53.1 (-)
Clayey facies 10.2
(241.4) -
-18.1
(196.1) 189.7 (-) 118.9 (-)
12.0 (50.1)
Gravelly facies 229.3
(705.0) -
-51.9 (655.0)
398.1 (1694.6)
39.0
(124.0) 104.4 (-) The present study
4.4–74.8 3.0–9.1 27.5–44.3 0–153.8 0–1872.0 28.7–69.7 11.9–41.4
1Values in percentage.
2The guiding values adopted by CONAMA (2004) are based on the Canadian Council of Ministers of the Environment (CCME,
2001); Long et al. (1995) and the Florida Department of Environmental Protection (FDEP, 1994).
3The numbers indicate the average and the maximum value (in brackets) of the obtained concentrations. (-): values not
esta-blished or not found in the literature.
Arsenic is good example of the limitation and difficulty in comparing these data. The backgrou -nd value proposed here for As encompasses values that can represent adverse effects to the biota (>17 mg.kg-1), both by the Canadian and Brazilian legislations, once it is 64.2 mg.kg-1. Concentrations up to this value are considered basal and naturally present in the study area. The concentrations higher than “PEL” and “Level 2” and that are directly related to the geologic characteristics of the region where the Gualaxo river basin is installed. As already commented, the natural As enrichment can be related to the
rocks hosting the gold mineralization, which are associated with sulfide veins exposed when the mines are
areas, which suggests that As enrichment in the study regions are natural. The difference basically consists of the fact that whereas concentrations larger than 29 mg.kg-1 are considered abnormal by Crommentuijn et al. (2000), in the present study concentrations up to 64.2 mg.kg-1 may not be related to human activities.
It is possible to compare, even with caution, studies developed in areas of similar geological cha-racteristics. For example, high As concentrations observed by Costa (2007) in gravelly samples were also observed in the present study. Costa (2007) and our study, present similar characteristics and have been
developed in neighboring regions, differences are perceived, which once again attests the difficulty in
comparing results. Another example is given by As concentrations in the clayey facies. The present stu-dy evidenced higher As concentrations when compared to Costa (2007). A mean concentration of 276.1 mg.kg-1 (27 times higher) and median of 238 mg.kg-1 were obtained for clayey sediments. Besides, where-as the maximum concentration obtained by Costa (2007) in such sediment wwhere-as 241.2 mg.kg-1, we obtained a maximum concentration of 570 mg.kg-1.
In light of the exposed above, the development of local or regional background studies, especially when it comes to sediment contamination, are necessary and important. From a practical viewpoint, the results here presented are an alert for the authorities responsible for environmental managing, moreover when there is evidence, even if natural, of high concentrations of highly toxic elements such as arsenic, which indicate potential risk to human health.
CONCLUSIONS
The proposed background values are coherent with the local geologic characteristics, which must be taken into account both by environmental agencies (for pro-environmental decision making) and the academic community, in face of the necessity of continuing studies (in other areas) using the approach pre-sented here. In order to propose background values, it is important to know the geology of the study area, so that biases, which can cause over or underestimation of the proposed values, are eliminated. Finally, the choice of the method to be used must be related not only to the geologic knowledge of the area, but also to the distinct deposition sites chosen for sampling. It is important to identify whether the sample was taken from old (possibly free of anthropogenic interference) or recent environments, in which anthropic activities can directly or indirectly affect the concentration of certain elements.
ACKNOWLEDGMENTS
The authors wish to thank the Brazilian Council for Scientific and Technological Development
(CNPq) (Projects 577211-2008-0 and 476881-20072), the Program for Support of Excellence Nuclei (PRONEX) linked to the Minas Gerais Foundation for Research (FAPEMIG) (CRA-APQ-00415-09), and the Coordination for the Improvement of Higher Education Personnel (CAPES) for the doctorate
REFERENCES
ANKLEY, G. T. et al. 1996. Technical basis and proposal for deriving sediment quality criteria for metals.
Environmental Toxicology and Chemistry, 15(1):2056-2066.
BAIZE, D.; STERCKEMAN, T. 2001. Of the necessity of knowledge of the natural pedogeochemical background content in the evaluation of the contamination of soils by trace elements. Science of the Total
Environment, 264(1-2):127-139.
BREWER, P.; TAYLOR, M. P. 1997. The spatial distribution of heavy metal contaminated sediment across
terraced floodplains. Catena, 30(2-3):229-249.
BURROUGH, P. A.; VAREKAMP, C.; SKIDMORE, A. K. 1996. Using Public Domain Geostatistical and GIS Software for SpatialInterpolation. Photogrammetric Engineering & Remote Sensing, 62 (7):845-854.
CCME, Canadian Council of Ministers of the Environment. 1999. Canadian water quality guidelines
for the protection of aquatic life: CCME Water Quality Index 1.0, User’s manual. In: Canadian
Environ-mental Quality Guidelines. Canadian Council of Ministers of the Environment, Winnipeg.
CONAMA, Conselho Nacional de Meio Ambiente. 2004. Resolução nº 344 de 25 de março de 2004: Estabelece as diretrizes gerais e os procedimentos mínimos para a avaliação do material a ser dragado em
águas jurisdicionais brasileiras. Available in: <http://www.mma.gov.br/port/conama/legiabre.cfm?codle-gi=445>. Acessed: 02 Jan. 2013.
COSTA, A. T. 2001. Geoquímica das águas e dos sedimentos da Bacia do Rio Gualaxo do Norte,
leste – sudeste do Quadrilátero Ferrífero (MG): estudo de uma área afetada por atividade de extração
mineral. Dissertação (Mestrado em Ciências Naturais) - Universidade Federal de Ouro Preto, 187p.
COSTA, A. T. 2007. Registro histórico de contaminação por metais pesados, associados à exploração
aurífera no alto e médio curso da bacia do ribeirão do Carmo, QF: um estudo de sedimentos de
pla-nícies de inundação e terraços aluviais. Tese (Doutorado em Ciências Naturais) - Universidade Federal de Ouro Preto, 190p.
COSTA, A. T. et al. 2010. Análise estratigráfica e distribuição do arsênio em depósitos sedimentares qua
-ternários da porção sudeste do Quadrilátero Ferrífero, bacia do Ribeirão do Carmo, MG. REM: Revista
da Escola de Minas, 63(4):703-714.
CROMMENTUIJN, T. et al. 2000. Maximum permissible and negligible concentrations for metals and metalloids in the Netherlands, taking into account background concentrations. Journal of Environmental
Management, 60(2):121-143.
DESCHAMPS, E. et al. 2002. Soil and Sediment Geochemistry of the Iron Quadrangle, Brazil: The Case of Arsenic. Journal of Soils & Sediments, 2(4):216-222.
DÍEZ, M. et al. 2007. Background arsenic concentrations in Southeastern Spanish soils. Science of Total
Environmental, 378(1-2):5-12.
ELEUTÉRIO L. 1997. Diagnóstico da situação ambiental da cabeceira da bacia do rio Doce, MG, no
âmbito das contaminações por metais pesados em sedimentos de fundo. Tese (Doutorado em Ciências
ERHARDT, W.; HÖPKER, K. A.; FISCHER, I. 1998. Verfahren zur Bewertung von immissionsbedingten Stoffanreicherungen in standardisierten Graskulturen. Umweltchem Okotox, 8(4):237–240.
FIELD, L. J.; MACDONALD, D. D.; NORTON, S. B. 1999. Evaluating sediment chemistry and toxicity data using logistic regression modeling. Environmental Toxicology and Chemistry, 18(6):1311-1322.
FRIZZO, S. J.; LICHT, O. A. B. 2007. Estatística uni e bivariadas aplicadas à prospecção geoquímica. In: O. A. B. Licht, C. S. B. de-Mello, C. R. da-Silva (Eds.). Prospecção geoquímica de depósitos minerais
metálicos, não-metálicos, óleo e gás. Rio de Janeiro: Sociedade Brasileira de Geoquímica e Serviço
Ge-ológico do Brasil, 788p.
GALÁN, E. et al. 2008. Influence of geological setting on geochemical baselines of trace elements in
soils. Application to soils of South–West Spain. Journal of Geochemical Exploration, 98(3):89-106.
GAŁUSZKA, A. 2007. A review of geochemical background concepts and an example using data from
Poland. Environmental Geology, 52(5):861-870.
GAŁUSZKA, A. 2006. Methods of determining geochemical background in environmental studies. Prob -lems of landscape ecology. Polish association of landscape ecology - Warsaw, 16(1):507-519.
GUILLÉN, M. T. et al. 2011. Environmental geochemical mapping of Huelva municipality soils (SW Spain) as a tool to determine background and baseline values. Journal of Geochemical Exploration,
109(1-3):59-69.
HORCKMANS, L. et al. 2005. Local background concentrations of trace elements in soils: a case study in the Grand Duchy of Luxemburg. Catena, 59(3):279-304.
LEPELTIER, C. 1969. A simplified statistical treatment of geochemical data by graphical representation.
Economy Geology, 64(5):538-550.
LEWIN, J.; MACKLIN, M. G. 1987. Metal mining and floodplain sedimentation in Britain. In: V. Gar -diner (Ed.). International Geomorphology 1986: Proceedings of the First International Conference on Geomorphology. Part 1. Chichester: John Wiley and Sons, p. 1009-1027.
LILLIEFORS, H. W. 1969. On the Kolmogorov–Smirnov test for the exponential distribution with mean unknown. Journal of the American Statistical Association, 64(325):387-389.
LONG, E. R.; MORGAN, L. G. 1991. The potential for biological effects of sediment – sorbed
con-taminants tested in the National Status and Trends Program. NOAA Technical memorandum NOS
OMA 52. 2. ed. Seattle, Washington: NOAA, 229p.
MACDONALD, D. D.; INGERSOLL, C. G.; BERGER, T. A. 2000. Development and evaluation of consensus - based sediment quality guidelines for freshwater ecosystems. Archives of Environmental
Contamination and Toxicology, 39(1):20-31.
MATSCHULLAT, J.; OTTENSTEIN, R.; REIMANN, C. 2000. Geochemical background - can we calcu-late it? Environmental Geology, 39(9):990-1000.
MICÓ, C. et al. 2007. Baseline values for heavy metals in agricultural soils in an European Mediterranean region. The Science of the Total Environmental, 378(1-2):13-17.
sedimentos (CQS): experimentos de campo e laboratório. Unpublished final report, Qualised Project - Process. n. 98/12177-0.
MRVIĆ, V. V. et al. 2012. Background limit of Zn and Hg in soils of Eastern Serbia. Journal of
Agricul-tural Science, 55(2):157-163.
MRVIĆ, V. et al. 2011. Methods for assessment of background limit of Ni and Cr in soils of eastern Serbia.
Ratarstvo i povrtarstvo, 48(1):189-194.
NAKIĆ, Z.; POSAVEC, K.; BACÏANI, A. 2007. A Visual Basic Spreadsheet Macro for Geochemical
Background Analysis. Ground Water, 45(5):642-647.
NAKIĆ, Z.; POSAVEC, K.; PARLOV, J. 2010. Model-based objective methods for the estimation of
groundwater geochemical background. Aquamundi, 1(1):65-72.
PANNO, S. V. et al. 2006. Estimating Background and Threshold Nitrate Concentrations Using Probabil-ity Graphs. Ground Water, 44(5):697-709.
PEH, Z.; MIKO, S.; HASAN, O. 2010. Geochemical background in soils: a linear process domain? An example from Istria (Croatia). Environmental Earth Sciences, 59(6):1367-1383.
PÉREZ-SIRVENT, C. et al. 2009. Geochemical background levels of zinc, cadmium and mercury in
an-thropically influenced soils located in a semi-arid zone (SE, Spain). Geoderma, 148(3-4): 307-317.
PERSAUD, D.; JAAGUMAGI, J.; HAYTON, A. 1993. Guidelines for the Protection and Management
of Aquatic Sediment Quality in Ontario. Toronto: Ministry of Environment and Energy, PIBS, 24p.
POLETO, C.; MERTEN, G. H. 2008. Elementos traço em sedimentos urbanos e sua avaliação por Guide-lines. Holos Environment, 8(2):100-118.
RAURET, G. et al. 1999. Improvement of the BCR three step sequential extraction procedure prior to
the certification of new sediment and soil reference materials. Journal of Environmental Monitoring,
1(1):57-61.
REIMANN, C.; FILZMOSER, P.; GARRETT, R. G. 2005. Background and threshold: critical comparison of methods of determination. The Science of the Total Environmental, 346(1-3):1-16.
REIMANN, C.; GARRET, R. G. 2005. Geochemical background - concept and reality. The Science of the
Total Environmental, 350(1-3):12-27.
RODRIGUES-FILHO, S.; MADDOCK, J. E. L. 1997. Mercury Pollution in Two Gold Mining Areas of the Brazilian Amazon. Journal of Geochemical Exploration, 58(1):231-240.
ROESER, H. M. P.; ROESER, P. A. 2010. O Quadrilátero Ferrífero - MG, Brasil: aspectos sobre sua his -tória, seus recursos minerais e problemas ambientais relacionados. Revista Geonomos, 18(1):33-37.
SHIOWATANA, J. et al. 2001. A novel continuous-flow sequential extraction procedure for metal specia -tion in solids. Journal of Environmental Quality, 30(4):1195-1205.
SILVÉRIO, P. F. 2003. Bases técnico-científicas para a derivação de valores guia de qualidade de
sedimentos para metais: experimentos de campo e laboratório. Tese (Doutorado em Ciências da
SMITH, S. L. et al. 1996. A preliminary evaluation of sediment quality assessment values for freshwater ecosystems. Journal of Great Lakes Research, 22(3):624-638.
TAYLOR, M. P.; LEWIN, J. 1996. River behaviour and Holocene alluvial: The river Severn at Welshpool, mid-Wales, U.K. Earth Surface Processes and Landforms, 21(1):77-91.
TENG, Y. et al. 2009. Geochemical baseline of trace elements in the sediment in Dexing area, South
Chi-na. Environmental Geology, 57(7):1649-1660.
TUKEY, J. W. 1977. Exploratory data analysis. Massachussetts: Addison-Wesley, 83p.
USEPA, United States Environmental Protection Agency. Region 5, RCRA. 2003. Ecological Screening
Levels, 2003. Available in: <http://www.epa.gov/RCRIS-Region-5/ca/edql.htm>. Acessed: 23 Apr. 2010.
ZGLOBICKI, W. et al. 2011. Geochemical and statistical approach to evaluate background concentrations of Cd, Cu, Pb and Zn (case study: Eastern Poland). Environmental Earth Sciences, 62(2):347-355.
ZHANG, Q. et al. 2011. Comparison of Sequential Chemical Extraction Procedure and DGT Technique to Measure Effective Arsenic in Sediment of Lake Taihu, China. Journal of Agro-Environmental Science,