www.ccarevista.ufc.br ISSN 1806-6690
Rainfall patterns and the contribution of litter in the caatinga dry
tropical forest
1Padrões de chuva e a contribuição da serapilheira em uma floresta tropical seca
caatinga
Eveline Viana Salgado2*, Eunice Maia de Andrade3, Joaquín Navarro Hevia4, Edson Paula Nunes5 e Meilla
Marielle de Araújo Rodrigues6
ABSTRACT - The present study was designed to investigate the dynamics of rainfall patterns on the production and rate of decomposition of litter in the caatinga biome. To this end, a data series which had been recorded over 30 years (1981-2010) was used; the indicators taken into consideration being the irregular rainfall index, humidity index and consecutive wet and dry days. Litter was collected monthly over a period of two years (2009-2010) at 20 different locations, and totalled 480 samples. Samples were taken from all live individuals with a stem diameter of 0.03 m and a height of 1 m: 562 individuals in 25 recorded species were identified. The annual irregular rainfall index, calculated from the series, was 8.45, with a maximum precipitation of 1,763.9 mm (1985) and a minimum of 208.8 mm (1983). The difference in annual rainfall during 2009/2010 was 787.9 mm, 2010 showing greater temporal variability when compared to 2009. Using the humidity index, these years were classified as very wet and very dry respectively. The total annual rainfall influenced the annual production of litter, with 6034.22 kg ha-1 and 3311.96 kg ha-1 for 2009 and 2010 respectively.
The temporal distribution of rainfall brings forward leaf senescence. In 2010 eight dry spells were recorded, and those that occurred in May and June particularly caused the leaves to fall earlier by almost 60 days, demonstrating that the distribution of rainfall over time speeds up the aging of leaves.
Key words: Rainfall indices. Droughts. Caatinga biome. Decomposition of litter.
RESUMO - O presente estudo foi desenvolvido a fim de investigar a dinâmica do regime pluviométrico na produção e taxa de decomposição da serapilheira do bioma caatinga. Para tanto, empregou-se uma série histórica de 30 anos (1981-2010) e os indicadores considerados foram Índice de irregularidade pluviométrica e Índice de umidade e dias consecutivos úmidos e secos. As coletas de serapilheira foram realizadas mensalmente por um período de 2 anos (2009-2010) em 20 pontos distintos, totalizando 480 amostras. Foram amostrados todos os indivíduos vivos com diâmetro do caule 0,03 m e altura 1 m, sendo identificados 562 indivíduos em 25 espécies registradas. O índice de irregularidade pluviométrica anual, avaliado na série, foi de 8,45, com precipitação máxima de 1.763,9 mm (1985) e mínima de 208,8 mm (1983). A diferença da precipitação anual entre os anos 2009/2010 foi de 787,9 mm e o ano de 2010 apresentou uma maior variabilidade temporal quando comparado com 2009. De acordo com o índice de umidade os mesmo foram enquadrados nas classes muito úmida e muito seca, respectivamente. A precipitação total anual influenciou a produção de serapilheira anual com 6.034,22 kg ha-1 e 3.311,96 kg ha-1, para os anos
de 2009 e 2010, respectivamente. A distribuição temporal das chuvas antecipa a senescência das folhas. Em 2010 foram contabilizados 8 veranicos e principalmente os que ocorreram nos meses de maio e junho anteciparam a queda das folhas, praticamente em 60 dias, expressando que a distribuição temporal das chuvas, antecipa a senescência das folhas.
Palavras-chave:Índices pluviométricos. Veranicos. Levantamento florístico do Bioma Caatinga. Serapilheira-decomposição.
DOI: 10.5935/1806-6690.20150009 *Autor para correspondência
1Recebido para publicação em 02/09/2013; aprovado em 23/01/2015
Parte da Tese de Doutorado do primeiro autor apresentada Programa de Pós Graduação em Engenharia Agrícola, Departamento de Engenharia Agrícola/UFC
2Departamento de Engenharia Agrícola/CCA/UFC, Rua, Eduardo Bezerra 175, Fortaleza-CE, Brasil, 60 130 270, [email protected] 3Departamento de Engenharia Agrícola/CCA/UFC, Fortaleza-CE, Brasil, [email protected]
4Departamento Ingeniería Agrícola y Forestal/UVa/España, [email protected] 5Departamento de Biologia/CT/UFC, Fortaleza-ce, Brasil, [email protected]
INTRODUCTION
The Caatinga biome is the main ecosystem existing in northeastern Brazil, extending throughout the area of semiarid climate (MAIA, 2004). Caatinga is made up of dry and thorny vegetation having xerophytic characteristics. In the vegetation, grasses, shrubs and trees of low or medium-height (3-7 metres), deciduous with small leaves and deep, thick roots, as well as a large amount of cacti and bromeliads can all be found (MAIA, 2004; SOUTOet al., 2009).
The deposit of organic material in the soil from vegetation, acts directly to protect the soil against erosion, preserve soil fertility, store water, increase the micro-fauna and protect against pests (COSTAet al., 2007). The litter
represents material deposited on the ground by the vegetation, and is comprised of leaves, flowers, fruits, branches, the remains of stems and material of animal origin.
The type of vegetation and the environmental conditions are determining factors of the quantity and quality of material that falls to the ground, and determine the heterogeneity and the rate of decomposition of the litter
(DESCHEEMAEKet al., 2006; MATAet al., 2011;
SAURA-MASet al., 2012; VANDERBILTet al., 2008). The amount
of litter-forming material in tropical forests varies between 3.6 and 12.4 kg ha-1 (ANDRADEet al., 1999).
Both biotic and abiotic factors influence litter production, such as the type of vegetation, altitude, latitude,
climatic conditions (BRANDTet al., 2010), topography
(ANAYA et al., 2012), deciduousness, sequential stage,
water availability and soil characteristics. Depending on the characteristics of each ecosystem, any one particular factor may prevail over the others (NAVARRO HEVIA, 2002;
PANDEYet al., 2007; QUIDEAUet al., 2005). For the
climatic variables, precipitation and temperature exercise greater influence on the formation of litter (BARLOW
et al., 2007; FRASER; HOCKIN, 2013).
In regions whose geological base results in shallow and / or impermeable soils, the formation of biomass by the vegetation is totally dependent on the rainy season, since water storage by the soil is limited, there thus being no water available to plants. Authors like Lopeset al. (2009),
Puchetaet al. (2006) and Silvaet al. (2011) studying the
production of litter in an area of caatinga, found that the depositing of litter presents a peak in production at the start of the dry season, showing a close relationship with rainfall, thereby affirming the deciduous character of this biome, as well as of other tropical ecosystems (BARLOWet al.,
2007; SILVAet al., 2011; VANDERBILTet al., 2008).
The main inductive source of rainfall in the Brazilian semiarid region is the ITCZ (Inter-Tropical Convergence Zone), which occurs from January to May, with a maximum in March and April (ANDRADE
et al., 2010). The upward movement of air, associated
with the ITCZ causes precipitation which is generally intense and of convective origin, and which does not display a well-defined frequency of occurrence, resulting in a pattern of anomalous rainfall with a highly variable spatial and temporal distribution (ALVES
et al., 2009; FERREIRA; MELLO, 2005; GUERREIRO et al., 2013). The high spatial and temporal variability
of the rainfall increases the risk of seasonal drought in
semiarid regions (MUPANGWAet al., 2011).
Faced with the high variability of rainfall in the region and its interrelation with the production of biomass by the caatinga, the aim of this study was to investigate the influence of the dynamics of rainfall patterns on the productivity and rate of decomposition of litter in a tropical dry forest. It was assumed that the total number of consecutive days reduces the period of leaf fall in tropical dry forests, and that the time required for decomposition is determined by the annual rainfall.
MATERIAL AND METHODS
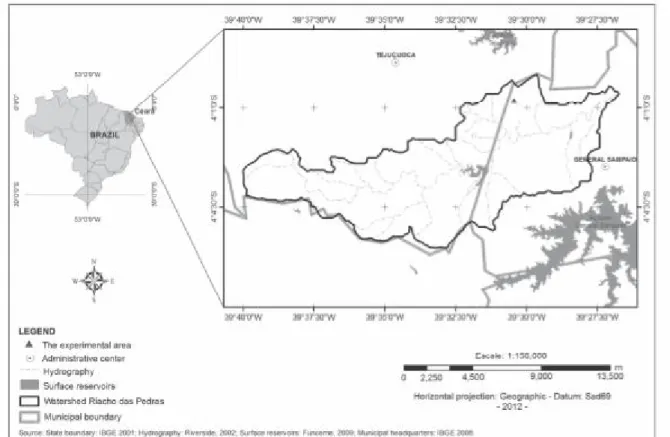
Area of study
The study was carried out at the Elias Andrade Private Natural Heritage Reserve of (RPPN), in the town of General Sampaio in Ceará, located in the watershed
of the Riacho das Pedras, which has an area of 130 km2
(Figure 1). The watershed is representative of the soil and climate conditions of the Brazilian semiarid region. The climate is classified as BSw’h’ with average monthly temperatures always above 18 °C and rainfall concentrated in the autumn. The average precipitation, evaporation and sunlight in the region is 763,1 mm (FUNDAÇÃO CEARENSE DE METEOROLOGIA E RECURSOS HÍDRICO, 2014). The study took place over a period of 24 months (February, 2009 to January, 2011).
The predominant soils in the study area are Entisols. The local flora is classified as a ligneous, shrub-like caatinga which is hyper-xerophilic with a physiognomy characterized by small to medium size trees, having a height of less than 7m (Cereus giganteus (Engel.) Brit et
Rose - mandacaru; Cochlospermum vitifolium (Willd.)
Spreng .- pacotê;Mimosa caesalpiniifolia Benth. - sabiá).
Rainfall Patterns
Figure 1 - Geographical representation of the Riacho das Pedras watershed, Ceará
between the precipitation in the year of most rain in the series, and that of the least rain in the series, given by Equation 1.
Equation (1) Where: PMax is the precipitation of the year with most rain in the series (mm) and PMin is the precipitation of the year with the least rain in the series (mm).
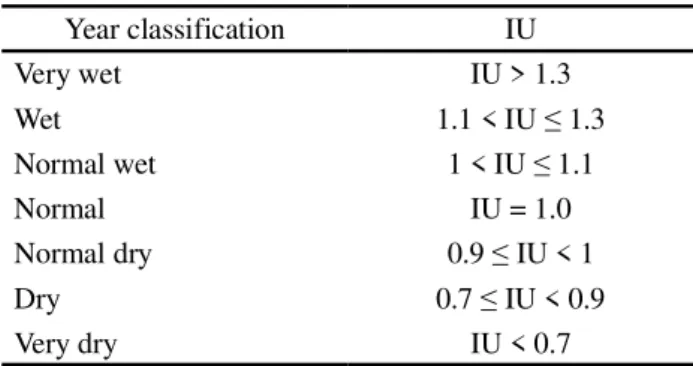
Classifying years as to the degree of humidity followed the precept set by the World Meteorological Organization, that there should be a series of 30 consecutive years. The data of total annual rainfall used corresponded to the period 1981 to 2010, giving a total of 30 years for the amount of rainfall in the Municipality of General Sampaio (FUNDAÇÃO CEARENSE DE METEOROLOGIA E RECURSOS HÍDRICOS, 2014).
In order to classify rainfall as to total annual precipitation, the humidity index (Iu) was determined, having as a basis the studies developed by Aires and Nascimento (2011) and Navarro Hevia (2002). Therefore, the data of total annual rainfall were placed in descending order and divided by class. Rainfall classification was determined from the humidity index (IU), as in Equation 2:
Equation (2)
Where: P is the annual rainfall (mm) and the average
rainfall for the series studied (mm).
The classes of IU were defined in line with the
highest limit of rainfall found in the new delimitation of the Brazilian semiarid region (BRAZIL, 2013). The rainfall series investigated showed an average precipitation over 30 years equal to 817.55 mm, which was defined as normal with a 50% probability of occurrence.
After determining probability for a year considered as normal as to the humidity index, a variation of 10% in the amount of normal rainfall was standardized for normal wet and normal dry years (Table 1). In both wet and dry years, a variation of 30% relative to the average rainfall was considered, and those values above or below this percentage, became extreme years (very wet and very dry).
In order to investigate the irregularity of daily rainfall in the area under study for 2009 and 2010, box plots or diagrams of extremes and quartiles were constructed
and processed using the Statistical Package for Social
Sciences software - SPSS 16.0.
Year classification IU
Very wet IU > 1.3
Wet 1.1 < IU 1.3
Normal wet 1 < IU 1.1
Normal IU = 1.0
Normal dry 0.9 IU < 1
Dry 0.7 IU < 0.9
Very dry IU < 0.7
Table 1 - Classification of years as to humidity index (IU)
the relationship between them, and the production and decomposition of litter were all used.
Floristic survey
The survey of the plant species that produced the litter quantified in this study was performed in 20 plots of 100 m2 (10 m x 10 m). All individuals with a height
of over 1m and a stem diameter equal to or greater than 0.03 m were sampled. Samples were collected every two weeks during the period of February to August 2011. For each collection, botanical material in the reproductive phase was taken, with each plant being triplicated. Subsequently, the samples were dried in a greenhouse with forced circulation at 55 °C until completely dry (SILVA, 2002). Taxonomic identification was carried out and the exsiccates were processed and duplicates placed in the Prisco Bezerra Herbarium at the Science Center of the Federal University of Ceará (UFC).
Production of litter
Estimations of monthly and annual litter production produced by the vegetation were determined by distributing throughout the RPPN of 20 collecting boxes (1 m x 1 m with a height of 0.15 m) and a nylon mesh of 0.001 m x 0.001 m. They were separated from each other by an approximate distance of 30 m. The material deposited in the boxes was collected monthly from February, 2009 to January, 2011. After each collection, the material was broken up into leaves (including leaflets and petioles); reproductive structures (flowers, fruits and seeds); branches (corresponding to all sizes of ligneous parts, including the bark) and miscellaneous (unidentified plant material and material of animal origin).
After sorting, the fractions were placed in paper bags and dried under forced circulation at 65oC until reaching
a constant weight and then the dry weight (DW) was calculated on precision scales (0.01 g) (SILVA, 2002). The amount of biomass (kg ha-1yr-1) produced by the caatinga
forest of the RPPN was estimated using the average amount of litter contained in the collecting boxes.
To determine the accumulated litter, quarterly samples were taken: in February, May, August and November of 2009 and 2010. For each collection, 20 samples were collected. Each sample consisted of collecting the litter contained in a cast-iron mold, of area equal to 0.25 m2 (0.5 m x 0.5 m), distributed randomly.
This material was then dried, and the DW determined. The rate of decomposition of the litter was estimated by Equation 3, proposed by Olson (1963),
and already used in other similar studies (LOPES et
al., 2009; PANDEY et al., 2007; SILVAet al., 2011;
SOUTO, 2006; VANDERBILTet al., 2008).
Equation (3) Where: K is the constant of instantaneous decomposition, L is annual litter production (gm-2) and Xss is the annual
average of litter accumulated on the ground (g m-2).
The value of K, or rate of instantaneous decomposition, is the ratio of the mass of litter produced, to the mass of litter accumulated yearly. Once the values of K for the two years under study had been determined, the average time of renewal was calculated, estimated by 1/K, and the time needed for decomposition of 50% (t0.5) and 95% (t0.05) of the litter, estimated using equations 4 and 5 (SHANKS; OLSON, 1961):
t0.5 = ln2/K = 0.693/K Equation (4) t0.05 = 3/K Equation (5)
RESULTS AND DISCUSSION
Rainfall patterns
For the recorded series studied (1981 to 2010), the annual rainfall irregularity index was 8.45, with a maximum precipitation of 1,763.9 mm (1985) and a minimum of 208.8 mm (1983), presenting a difference of 1,555.1 mm. According to Lópes e Mitengui (1986), this ratio presents values of < 3 for temperate regions, it varies between 4 and 5 for continental and oceanic regions, and > 5 in desert climates. Although the climate of the study area is classified as semi-arid, it presented a ratio for desert climates, being higher than that obtained by Navarro Hevia (2002), which was 2.48, with a range of 450 mm between the maximum and minimum precipitation, in a 40-year series for the region of Palencia, Spain. These facts demonstrate the great interannual variability of rainfall in dry tropical regions
(ANAYAet al., 2012; ANDRADEet al., 2010).
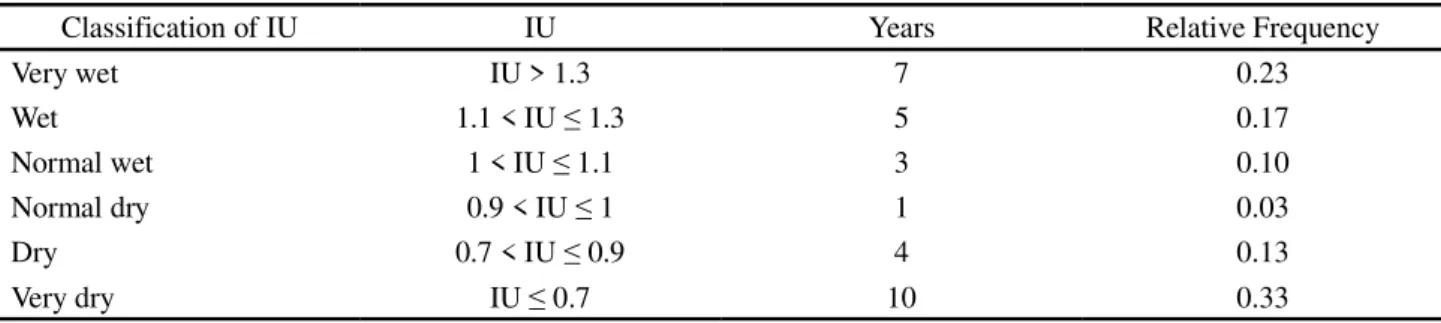
demonstrate the high yearly variations. The normal class (Pi equals the average of the series), presented a frequency equal to zero, i.e. in no year during the study period was precipitation equal to the normal average over the 30 years. Researchers like Andradeet al. (1999); Mupangwaet al.
(2011) question the period of 30 years as representative of the norm for semiarid regions with high uncertainty of space and time for rainfall events.
The IU classifications of regular-dry and normal-wet, ± 0% of the normal average, presented a low frequency of occurrence, 0.10 and 0.03 respectively. As for the wet and dry classifications, the frequency was 0.17 and 0.13, expressing a greater number of years with annual rainfall ranging from ±10 to 30% of the normal average. The highest frequencies were recorded for the extreme classifications, very dry and very wet, totalling 56% of the years studied, ten were classified as very dry and seven as very wet (Table 2). These results show a greater tendency for extreme events, with high temporal variability. Navarro Hevia (2002) studying a series of 40 years in a semiarid region of Spain, identified a predominance of the normal classification, with rainfall in the range of 400 to 600 mm. The high temporal variability of rainfall events were confirmed during the two years of the study. For 2009, the total annual precipitation was 1,267.80 mm, 55.06% more than the normal average for the series (817.6 mm), and in the following year (2010) the annual precipitation was 479.90 mm, expressing a difference of 787.90 mm between the two. With these values therefore, the two years under investigation fitted into the two extreme classifications, very wet and very dry, and identified a pattern of rainfall of high spatial and temporal uncertainty. In dry environments, annual rainfall may vary from 60 to 150% (VANDERBILT
et al., 2008), and between months, this variation reaches rates
of over 500% (ANDRADEet al., 2010). These changes in the
frequency and distribution of rainfall affect the decomposition of litter (ANAYAet al., 2012; PUCHETAet al., 2006).
The temporal variability of the distribution of rainfall events that occurred in those years studied showed distinct trends, expressing high intra- and inter-annual variability
Table 2 - Classification by year as to the humidity index (IU)
Classification of IU IU Years Relative Frequency
Very wet IU > 1.3 7 0.23
Wet 1.1 < IU 1.3 5 0.17
Normal wet 1 < IU 1.1 3 0.10
Normal dry 0.9 < IU 1 1 0.03
Dry 0.7 < IU 0.9 4 0.13
Very dry IU 0.7 10 0.33
(Figures 2 and 3). These figures plot the daily precipitation as individual points, and may also present atypical or extreme values, represented by asterisks or circles.
In 2009, classified as to the humidity index, as “very wet”, there was normal rainfall seen in the region, when
precipitation was concentrated in the four months that make up the rainy season (February, March, April and May)
(ANDRADE et al., 2010; LOPES et al., 2009). In these
months, the figures showed a predominance of rainy days above the average and precipitation representing the “outliers”
(values 1.5 times greater than the third quartile) and “extreme points” (values 3 times greater than the third quartile) of 438.4
mm, corresponding to approximately 35% of the total rainfall that year (2009). In 2010, considered “very dry”, as to the humidity index, there was a great predominance of extreme precipitation, i.e. values three times greater than the third quartile. This rainfall all occurred in just 24 days, of the year, representing 46% of the total precipitation, i.e. 222.4 mm.
Still referring to the above chart (Figure 3), the months which correspond to the rainy season did not present frequent rains, and the median between them remained stable. That is, monthly rainfall was virtually only determined by extreme events, except in April, which recorded the highest monthly rainfall that year of 175.2 mm, with 83.4 mm corresponding to two extreme events and one outlier.
In the search for a more detailed understanding of the temporal variability of rainfall events, an analysis of the number of dry and wet days recorded in the two years of study was carried out (Figures 4 and 5). In 2009, there were a greater number of rainy days with a total of 96 events between January and July, and an annual precipitation exceeding 150% that of 2010. In 2010, a total of 54 rainy days were registered, being that 16 of these events occurred in January, when the rainfall season begins. March and April having a total rainfall lower than the monthly historical mean. This fact expresses the uncertainty of the rainfall regime registered by Guerreiroet al. (2013).
Figure 2 - Temporal analysis, box plot charts of the daily precipitation for 2009
Figure 3 - Temporal analysis, box plot charts of daily precipitation for 2010
Figure 4 - Total rain bursts per month for 2009 and 2010 and the normal average over 30 years, for the Riacho das Pedras watershed, Ceará
Figure 5 - Total dry days per month for 2009 and 2010 and the normal average over 30 years, for the Riacho das Pedras watershed, Ceará
of two dry spells longer than 10 days in 2009 and eight days in 2010. In 2010, these dry spells showed a higher frequency in May and June, however the number of dry days was higher than the average by only three days and one day respectively. In the same year (2010), February and March, being representative of months in the rainy season of the region, had almost only dry days. These days were 37% and 43% more than the average for the series, with 26 and 24 dry days respectively. The consistency of the dry spell in the last year (2010) contributed to early leaf fall and the peak monthly production of litter. This confirms the hypothesis that the number of consecutive dry days shortens the period of leaf fall originally calculated for tropical dry forests.
Floristic survey
In the floristic survey 562 live individuals were identified in 20 plots of 100 m2 each, while Rodalet al.
(2008) found 3,140 individuals in 100 plots of 100 m2
each, in an area of 20 years preservation. Although the absolute numbers show different values, the density of individuals in the two areas may be considered as similar, since the area calculated by Rodalet al. (2008) was five
times greater than the area of this study, and the vegetation of both studies was the same.
The recorded individuals were grouped into 25 species (Table 3) similar to the quantitative floristic surveys of ligneous plants in areas of caatinga performed by Rodalet al. (2008) and Santana and Souto (2006). These
authors identified a total of 28 and 22 species respectively, with different species of caatinga-like plants among those dominant in their surveys.
Catingueira, it has four different species and its uses
include: timber production, folk medicine and forest
restoration (MAIA, 2004). In this researchPoincianella
bracteosa (Tul.) L. P. Queiroz (Catingueira) represented
only 9.96% of identified plants (Table 3).
Of the 14 families inventoried, the Fabaceae contributes 9 of the 25 species identified, the Euphorbiaceae 4, and the remaining families only one species, thereby showing that the diversity of this RPPN is concentrated in these two families. This biodiversity is similar to studies carried out by the above-mentioned
Table 3 - Species of tree, shrub, herb, and climber, the Elias Andrade Private Natural Heritage Reserve, Ceará, Brazil. NI-number of individuals; RF-Relative Frequency (%)
authors. The predominant species in the RPPN were:
Croton blanchetianus Baill. (Marmeleiro preto); Croton anisodontus Müll. Arg. (Marmeleiro branco); Ipomoea subincana (Choisy) Meisn. (Liana) and Combretum leprosum Mart. (Mofumbo), representing 52.14% of noted
species, with a total of 349 plants. The first three species are endemic trees, the third an endemic herbaceous plant and the fourth a non-endemic bush.
It was found that the Euphorbiaceae family usually stands out with the largest number of species in areas of caatinga. This assertion can be seen in this study, where
Family Scientific Name NI RF (%)
Trees
Apocynaceae Aspidosperma pyrifolium (Mart) 14 2.49
Anacardiaceae Myracrodruon urundeuva Fr Allemão 4 0.71
Bignoniaceae Tabebuia impetiginosa (Mart. Ex DC.) Standl 4 0.71
Bixaceae Cochlospermum vitifolium (Willd.) Spreng. 3 0.53
Boraginaceae Auxemma oncocalyx (Allemão) Taub. 30 5.34
Burseraceae Amburana cearensis (Allemão)A.C.Sm. 2 0.36
Cactaceae Cereus giganteus (Engel.) Brit et Rose 8 1.42
Combretaceae Combretum leprosum Mart. 59 10.50
Euphorbiaceae Croton anisodontus Müll. Arg. 60 10.68
Euphorbiaceae Croton blanchetianus Baill. 113 20.11
Fabaceae-Caes Bauhinia cheilantha (Bong.) Steud. 12 2.14
Fabaceae-Caes Bauhinia pentandra (Bong.) Vogel ex Steud. 9 1.60
Fabaceae-Caes Bauhinia ungulata L. 7 1.25
Fabaceae-Caes Caesalpinia ferrea (Mart.) 2 0.36
Fabaceae-Mim Mimosa caesalpiniifolia Benth. 47 8.36
Fabaceae-Mim Mimosa tenuiflora (Willd.) Poir. 32 5.69
Fabaceae-Mim Pityrocarpa moniliformis (Benth.) Luckow & R.W.Jobson 8 1.42
Fabaceae- Caes Poincianella bracteosa (Tul.) L.P.Queiroz 56 9.96
Mimosoideae Chloroleucon dumosum (Benth.) G.P.Lewis 2 0.36
Rutaceae Fagara sp. 6 1.07
Shrubs
Euphorbiaceae Jatropha mollissima (Pohl) Baill. 3 0.53
Euphorbiaceae Manihot glaziovii Müll. Arg. 3 0.53
Olacaceae Ximenia americana L. 4 0.71
Herbacious
Convolvulaceae Ipomoea subincana (Choisy) Meisn. 61 10.85
Climber
the speciesCroton blanchetianus Baill, popularly known
as “Marmeleiro Preto”, presents the largest number of sampled individuals, 20.11% of the plants noted or 113 plants. Since this species is present in scrub or arboreal caatinga and in backland and beach areas of carnauba, it can be considered as an indicator of human interference, often being found in places with heavily damaged vegetation. The current classification of the vegetation under study is of a woody shrub-like caatinga, however it cannot be said that the natural state of the vegetation fits this classification, since human action can interfere with this classification (MAIA, 2004; SANTANA; SOUTO, 2006).
Production of litter
The litter production of a region is a function of the contributing vegetation, precipitation and soil-water
availability (SILVAet al., 2011; VANDERBILTet al.,
2008). During the study period, the annual litter deposit for 2009 and 2010 was 6,034.22 kg ha-1 and 3,311.97 kg ha-1,
with a 45% reduction in production and an average production being estimated as 4,673.10 kg ha-1. This fact demonstrates
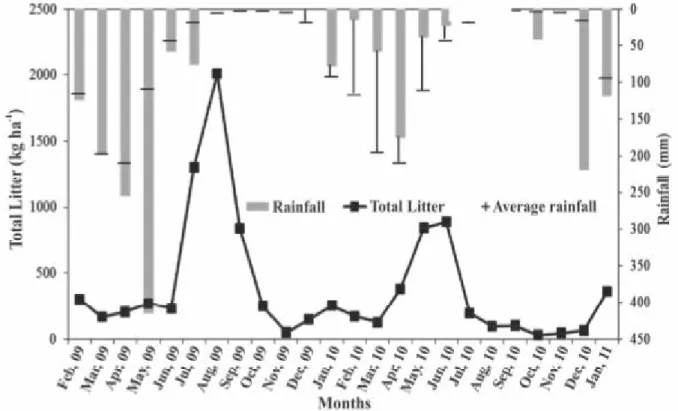
the inter-annual variability in litter production and the need for caution in the use of average values. It is noteworthy that the highest deposits occurred in the months of August, 2009 and June, 2010 (Figure 6). These represent the end of the rainy season. There is a delay of three months for maximum productivity
Figure 6 - Monthly variation in litter deposit (kg ha-1) and rainfall (mm) during 2009 and 2010, and normal average rainfall over 30 years
relative to the month of greatest precipitation in the wettest year (2009), while in 2010, the leaf fall began in April with a very similar leaf fall in May and June. Bringing forward the higher monthly productivity of litter confirms its interrelationship with the dynamics of the monthly pattern of rainfall.
Precipitation is the climatic factor which interferes directly in the production of litter, however the temporal distribution of the rainfall, especially consecutive dry days (dry spells), speeds up the aging of leaves. As shown in Figure 5, in 2010 eight dry spells of 10 days or more were seen, and mainly those that occurred in May and June brought forward leaf fall that year by almost 60 days.
In the two years (2009 and 2010) the annual litter production presented a difference of 2,722.25 kg ha-1 yr-1.
However, the depth of precipitation in the first year was greater by 787.90 mm than in the following year. Litter production (6,034.22 kg ha-1) in 2009, a year classified
as very rainy, resembled that of a subtropical forest in India, with annual precipitation of 1,384 mm and annual production of 5,477 kg ha-1 yr-1 (PANDEYet al., 2007).
Values of annual litter production recorded for 2010 were close to those found in areas of caatinga by Costa
et al. (2007) and Lopes et al. (2009). However these
figures are higher than in the studies developed by Souto
in different regions of the state of Paraíba, Brazil, and obtained average litter deposits of 2,068.55 kg ha-1 year-1
and 1,619.21 kg ha-1 yr-1 respectively.
For 2009 and 2010 annual litter production was measured (6,034.22 kg ha-1 and 3,311.96 kg ha-1) and an
annual accumulated average for ground litter calculated of 5,929.80 kg ha-1 and 6,121.03 kg ha-1 respectively.
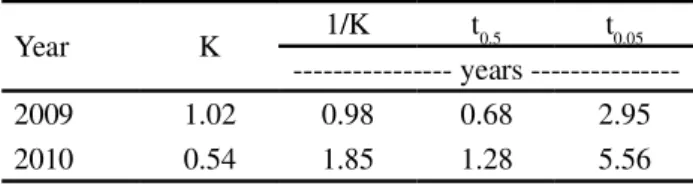
From these deposits the decomposition rate or constant (K), the time required for litter renewal (1/K), and the times for 50% (t0.5) and 95% (t0.05) for decomposition of the litter were all estimated (Table 4).
The constant, K, is considered an estimate of the proportion of decomposition in one year, of the layer of accumulated litter on the ground. The values of K for both years (Table 4) represent the relationship between the annual deposit of litter and that accumulated on the ground. For 2009 it shows that the total of decomposed litter was similar to the new supply, since the ratio between the two (K) was very close to 1. In relation to the humidity index, that year was rated asvery rainy, with the annual
rainfall more than 30% above the average, reflecting a higher annual production of litter and a shorter time for its decomposition. As for 2010 the decomposition of litter was equivalent to 50% of what was added (K=0.54), demonstrating an accumulation of litter on the ground. This fact expresses the relationship existing between rainfall and the decomposition of litter, for in a year with a less moisture (2010), there was less decomposition of the litter, and therefore a lesser supply of nutrients to the
soil (QUIDEAU et al., 2005; SAURA-MAS et al., 2012;
SOUTO, 2006; VANDERBILTet al.,2008). The correlations
between rainfall and the quality of soil cover have a large impact on the processes of decomposition in the central area
of New Mexico (VANDERBILTet al., 2008).
The time required for the renewal of litter (1/K) was 0.98 years (2009) and 1.85 years (2010). In the first year this result was similar to that observed by Souto (2006), with values of 0.91 and 0.70 years, indicating a balanced renewal of litter and availability of nutrients. In the second year, the renewal time is slow and is placed between that of two authors who also worked in this
biome, Lopeset al. (2009), who recorded (1/K) of 1.41
years and Santana, Souto (2005) with 3.03 years.
Table 4 - Constant of decomposition (K), renewal time (1/K) and decomposition times of 50% (t0.5) and 95% (t0.05) for litter in the Elias Andrade RPPN, Ceará, Brazil
Year K 1/K t0.5 t0.05
- years
---2009 1.02 0.98 0.68 2.95
2010 0.54 1.85 1.28 5.56
The time required for decomposition of 50% (t0.5) and 95% (t0.05) were 0.68 years (248 days) and 2.95 years (1,077 days) in 2009 and 1.28 years (467 days) and 5.56 years (2,029 days) in 2010. These figures confirm the values found for K and the time for the renewal of litter, being shorter in 2009 and longer in 2010. Yet these results are superior to those obtained by Souto (2006), where the time of decomposition in the first year of study were 229.9 days (t0.5) and 996.4 days
(t0.05), and 178.8 days and 770.15 days to decompose
50% and 95% in the second period. The time for the decomposition of litter directly depends on biotic and abiotic factors, because the rate of decomposition of organic matter varies with vegetation, climate, soil type, presence of soil organisms and human action, among other things (SILVAet al., 2011). However, studies into
the decomposition of litter have a period of evaluation which is considered as being short for arid and semi-arid environments, where the factor precipitation is of
high variability (VANDERBILTet al., 2008).
CONCLUSIONS
1. The rainfall irregularity index for the series evaluated (1981 to 2010) was considered high, showing a difference of 1,551.1 mm, between the years of maximum (1985) and minimum (1983) precipitation;
2. The Riacho das Pedras watershed tends to have a greater occurrence of very dry and very wet years, representing 56% of the relative frequency of the series studied; 3. The large number of plants with reduced stem diameter
and height is evidence of a population still in the recovery phase of the original structure, thereby reducing the number of plants identified in the floristic survey; 4. The concentration of rainfall into short periods of time,
and the presence of dry spells greater than or equal to 10 days, brought forward the maximum production of litter in 2010 by about 60 days;
5. The maximum monthly production of litter 2009 and 2010, occurred after the reduction in rainfall, thereby maintaining an inverse relationship between the precipitation and the maximum monthly production of litter;
6. The rate of decomposition (K) and renewal time (1/K) of the litter was considered fast in 2009 and slow in 2010.
ACKNOWLEDGMENTS
(CNPq) for the support of this project and the Coordination for the Improvement of Higher Level Personnel (CAPES), for the scholarship of the first author.
REFERÊNCIAS
AIRES, R.; NASCIMENTO, F. R. Variações pluviométricas em microbacias no vale do Jaguaribe-CE.Revista da Casa da Geografia de Sobral. Sobral, v. 13, n. 1, p. 83-97. 2011. ANAYA, C. et al. Large Rainfall Pulses Control Litter Decomposition in a Tropical Dry Forest: Evidence from an 8-Year Study.Ecosystems, v. 15, n. 4, p. 652-663, 2012.
ALVES, J. M. B. et al. Relationship between ocean climatic variability and rain-fed agriculture in northeast Brazil.Climate Research, v. 38, p. 225-236, 2009.
ANDRADE, A. G. et al. Ciclagem de nutrientes em
ecossistemas florestais. Rio de Janeiro: Embrapa Solos, 1999.
ANDRADE, E. M.et al.O semiárido cearense e suas águas. In:ANDRADE, E. M.; PEREIRA, O. J.; DANTAS, F. E. R. O Semiárido e o manejo dos recursos naturais. Fortaleza: Imprensa Universitária, 2010. cap. 3, p. 71-94.
BRANDT, L. A. et al. The role of photodegradation in surface litter decomposition across a grassland ecosystem precipitation gradient.Ecosystems, v. 13, n. 5, p. 765-781, 2010.
BRASIL. Ministério da Integração Nacional. Nova Delimitação do Semiárido Brasileiro. Disponível em: <www.mi.gov.br>. Acesso em: 1 set. 2013.
BARLOW, J. Litter fall and decomposition in primary, secondary and plantation forests in the Brazilian Amazon.
Forest Ecology and Management, v. 247, n. 1/3, p. 91-97, 2007.
COSTA, C. C. A.et al. Produção de serapilheira na Caatinga da Floresta Nacional do Açu-RN. Revista Brasileira de Biociências, v. 5, n. 1, p. 246-248, 2007.
DESCHEEMAEKER, K.et al. Litter production and organic matter accumulation in exclosures of the Tigray highlands, Ethiopia.Forest Ecology and Management, v. 233, n. 1, p. 21-35, 2006.
FERREIRA, A. G.; MELLO, N. G. S. Principais sistemas atmosféricos atuantes sobre a região Nordeste do Brasil e a influencia dos oceanos pacíficos e atlântico no clima da região.
Revista de Climatologia, v. 1, n. 1, p. 15-28, 2005.
FRASER, L. H.; HOCKIN, A. D. Litter decomposition rates of two grass species along a semi-arid grassland-forest ecocline.Journal of Arid Environments, v. 88, p. 125-129, 2013.
FUNDAÇÃO CEARENSE DE METEOROLOGIA E RECURSOS HÍDRICOS. PCD - Plataforma de coleta de
dados. Disponível em: <http://www.funceme.br/produtos/ script/chuvas/Download_de_series_históricas/ download Historicos/postos/49.txt.>. Acesso em: 1 maio 2014. GUERREIRO, M. J. S. et al. Long-term variation of precipitation indices in Ceará State, Northeast Brazil.
International Journal of Climatology, v. 33, n. 14, p. 2929-2939, 2013.
LÓPES, C.; MINTEGUI, J. A. Hidrología de Superficie. Fundación Conde del Valle de Salazar. E.T.S. de Ingenieros de Montes. Universidad Politécnica de Madrid. Madrid, 1986, 224 p. Tomo 1.
LOPES, J. F. B. et al. Deposição e decomposição de serapilheira em área de Caatinga. Revista Agro@mbiente,
v. 3, n. 2, p. 72-79, 2009.
MAIA, G. B.Caatinga:árvores e arbustos e suas utilidades. São Paulo: Leitura e Arte Editora, 2004.
MATA, D. I.et al. Floristic composition and soil characteristic of tropical freshwater forested wetlands of Veracruz on the coastal plain of the Gulf of Mexico. Forest Ecology and Management, v. 262, n. 8, p. 1514-1531, 2011.
MUPANGWA, W.et al. Start, end dry spells of the growing season in semi-arid southern Zimbabwe. Journal of Arid Environments, v. 75, n. 11, p. 1097-1104, 2011.
NAVARRO HEVIA, J.Control de la erosión em desmontes originados por obras de infraestructura viária:aplicación al entorno de Palencia capital. 2002. 316 f. Tesis (Doctorado en Ingenieria de Montes) - Universidad Politécnica de Madrid, 2002.
OLSON, J. S. Energy storage and the balance of producers and decomposers in ecological systems.Ecology, v. 44, n. 2, p. 322-331, 1963.
PANDEY, R. R. et al. Litterfall, litter decomposition and nutrient dynamics in a subtropical natural oak forest and managed plantation in northeastern India.Forest Ecology and Management,v. 240, n. 1/3, p. 96-104, 2007.
PUCHETA, E.et al. Litter decomposition in a sandy Monte desert of western Argentina: Influences of vegetation patches and summer rainfall. Austral Ecology, v. 31, n. 7, p. 808-816, 2006.
QUIDEAU, S. A.et al. Leaf litter decomposition in a chaparral ecosystem, Southern California. Soil.Biology & Biochemistry, v. 37, p. 1988-1998, 2005.
RODAL, M. J. N. et al. Estrutura e vegetação caducifólia espinhosa (Caatinga) de uma área do sertão central de Pernambuco.Hoehnea, v. 35, n. 2, p. 209-217, 2008. SANTANA, J. A. S.; SOUTO, J. S. Diversidade e estrutura fitossociológica da caatinga na estação ecológica do Seridó-RN.Revista de Biologia e Ciências da Terra, v. 6, n. 2, p. 232-242, 2006.
Environmental and Experimental Botany, v. 77, p. 274-282, 2012.
SHANKS, R.; OLSON, J. S. First year breakdown of leaf litter in Southern Appalachian Forest. Science, v. 134, n. 3473, p. 194-195, 1961.
SILVA, D. J.; QUEIROZ, C.Análise de alimentos (Métodos químicos e biológicos).Viçosa, MG: Universidade Federal de Viçosa, 2002. 235 p.
SILVA, A. K. L.et al. Litter dynamics and fine root production in Schizolobium parahyba var. amazonicum plantations and regrowth forest in Eastern Amazon.Plant Soil, v. 347, n. 1/2, p. 377-386, 2011.
SOUTO, P. C.Acumulação e decomposição da serapilheira e distribuição de organismos edáficos em área de Caatinga na Paraíba, Brasil. 2006. 146 f. Tese (Doutorado em Agronomia - Solos e Nutrição de Plantas) - Universidade Federal da Paraíba, Brasil. 2006.
SOUTO, P. C.et al. Características químicas da serapilheira depositada em área de caatinga.Revista Caatinga, Mossoró, Brasil, v. 22, n. 1, p. 264-272. 2009.