Glauco Vieira Miranda(1), Leandro Vagno de Souza(2), Lauro José Moreira Guimarães(2), Heraldo Namorato(1),
Lucimar Rodrigues Oliveira(1) and Marcelo Oliveira Soares(1)
(1)Universidade Federal de Viçosa, Departamento de Fitotecnia, Avenida P.H. Rolfs, s/no, CEP 36570‑000 Viçosa, MG, Brazil. E‑mail: [email protected] (2)Empresa de Pesquisa Agropecuária de Minas Gerais, Caixa Postal 351, CEP 38001‑970 Uberaba, MG, Brazil. E‑mail: [email protected] (3)Embrapa Milho e Sorgo, Caixa Postal 285, CEP 35701‑970 Sete Lagoas, MG, Brazil. E‑mail: [email protected]
Abstract – The objectives of this work were to evaluate the genotype x environment (GxE) interaction for popcorn and to compare two multivariate analyses methods. Nine popcorn cultivars were sown on four dates one month apart during each of the agricultural years 1998/1999 and 1999/2000. The experiments were carried out using randomized block designs, with four replicates. The cv. Zélia contributed the least to the GxE interaction. The cv. Viçosa performed similarly to cv. Rosa-claro. Optimization of GxE was obtained for cv. CMS 42 for a favorable mega-environment, and for cv. CMS 43 for an unfavorable environment. Multivariate analysis supported the results from the method of Eberhart & Russell. The graphic analysis of the Additive Main effects and Multiplicative Interaction (AMMI) model was simple, allowing conclusions to be made about stability, genotypic performance, genetic divergence between cultivars, and the environments that optimize cultivar performance. The graphic analysis of the Genotype main effects and Genotype x Environment interaction (GGE) method added to AMMI information on environmental stratification, defining mega-environments and the cultivars that optimized performance in those mega-environments. Both methods are adequate to explain the genotype x environment interactions.
Index terms: Zea mays, adaptability, breeding, maize, popcorn, selection, stability.
Análises multivariadas da interação genótipo x ambiente
em milho-pipoca
Resumo – Os objetivos deste trabalho foram avaliar a interação genótipo x ambiente (GxA) em milho-pipoca e comparar dois métodos de análise multivariada (AMMI e GGE). Os tratamentos foram nove cultivares de milho-pipoca, plantadas em quatro épocas de semeadura em cada ano de cultivo em 1998/1999 e 1999/2000. O delineamento foi em blocos ao acaso, com quatro repetições. A cultivar Zélia foi a que menos contribuiu para a interação GxA. As cultivares Viçosa e Rosa-claro mostraram desempenhos similares. A otimização da interação GxA foi obtida com a cv. CMS 42 para mega-ambientes favoráveis e com a cv. CMS 43 para ambientes desfavoráveis. Os resultados das análises multivariadas corroboraram os resultados do método de Eberhart & Russell. A análise gráfica do método Additive Main effects and Multiplicative Interaction (AMMI) é simples e permite tirar conclusões sobre estabilidade, desempenho genotípico, divergência genética das cultivares, e sobre os ambientes que otimizam o desempenho das cultivares. A análise gráfica do método Genotype main effects and Genotype x Environment interaction (GGE) acrescentou informações de estratificação ambiental ao AMMI e definiu mega-ambientes e as cultivares que tiveram suas performances otimizadas nesses ambientes. Ambos os métodos são adequados para explicar a interação genótipo x ambiente.
Termos para indexação: Zea mays, adaptabilidade, melhoramento genético, milho, milho-pipoca, seleção, estabilidade.
Introduction
Additive Main effects and Multiplicative Interaction analysis (AMMI) allows for a large set of technical interpretations (Duarte & Vencovsky, 1999) and uses a principal component (autovector) to interpret cultivar
interaction, the GGE Biplot analysis considers that only the G and GxE effects are relevant and that they need to be considered simultaneously when evaluating
cultivars. The graphic axes of such analysis are the first
two principal components of multivariate analysis and account for most of the data variance. The graphic axes
take the environment as fixed effect. Thus, this analysis identifies which cultivars are superior and identifies
mega-environments, i.e., environmental groupings having the same cultivar as superior in the trait under evaluation.
Yan & Rajcan (2002) described the results of two multivariate analysis techniques (GGE Biplot and Genotype-Trait (GT) Biplot) by means of graphics, to describe the GxE interaction and genotypes for several soybean traits. They concluded that the analyses
identified the GxE interaction and a single
mega-environment. GGE Biplot and GT Biplot were deemed simple and excellent methods for visual interpretation of the data.
Kang et al. (2006) used GGE Biplot methods and concluded that the analysis helped identify cultivars that were adapted across locations, or whose stability was
influenced by a linear effect of an environmental index.
Dehghani et al. (2006) evaluated the effects of genotype and genotype x environment interaction
on grain yield of 19 barley (Hordeum vulgare L.)
genotypes via the GGE Biplot method. The authors
identified three barley mega-environments, as well as
the best cultivar for the mega-environments.
Blanche & Myers (2006) used the GGE Biplot method to identify test locations that optimize genotype selection on the basis of their discriminating ability and representativeness.
Yan et al. (2007) compared GGE Biplot and AMMI analyses. They concluded that both GGE Biplot and AMMI analyses combined rather than separated G and GxE in mega-environment analysis and genotype evaluation. The GGE Biplot was superior to the AMMI graph in mega-environment analysis and genotype evaluation, because it explained G + GxE more effectively and had the inner-product property of the biplot. The discriminating power x representativeness view of the GGE Biplot was effective in evaluating test environments, which was not possible with AMMI analysis. The model diagnosis for each dataset was useful, but the accuracy gained from model diagnosis should not be overstated.
Gauch Júnior et al. (2008) reviewed AMMI and GGE analyses, concluding that the AMMI mega-environment graph incorporated more of the genotype main effect and captured more of the GxE interaction than did the GGE Biplot graph, and thereby displayed the “which-won-where” pattern more accurately for complex datasets. When the GxE interaction is captured well by one principal component, the AMMI graph of genotype nominal yields described winning genotypes and adaptive responses more simply and clearly than the GGE Biplot. For genotype evaluation within a single mega-environment, a simple scatterplot of mean and stability was more straightforward than the mean x stability view of a GGE Biplot.
The objectives of this work were to evaluate the genotype x environment (GxE) interaction for popcorn and to compare AMMI and GGE multivariate analyses.
Materials and Methods
The experiments were conducted at the Departamento de Fitotecnia, Universidade Federal de Viçosa, Experimental Station of Coimbra, in Coimbra, MG, Brazil, at 20o50'30"S and 42°48'30"W and 720 m of
altitude.
Treatments were nine popcorn cultivars sown on four dates (September 15, October 15, November 15 and December 15) during the agricultural years of both 1998/1999 and 1999/2000.
The popcorn cvs. Beija-flor, Branco, CMS 42,
CMS 43, RS 20, Rosa-claro and Viçosa are open pollination and cvs. IAC 112 and Zélia are hybrids.
Kernel colors are pink in Beija-flor, white in the cvs.
Branco and CMS 43, and orange in the others.
The experiments were carried out in a randomized block design, with four replicates. Each experimental plot comprised four 4-m-long rows. The harvested area consisted of two central lines of the plot.
AMMI analysis combines additive components in a single model for the main effects of genotypes and environments, as well as multiplicative components for the interaction effect (Duarte & Vencovsky, 1999). Thus, the mean response of a genotype i, in an environment p, is given by:
Yip = m + Gi + Ep + n S
k=1lkgikapk + rip + eip
in which: m is the overall mean; Gi is the effect of the
ith genotype; E
p is the effect of the pth environment; GEip
n S
k=1lkgikapk + rip in which: lk is the k
th singular value of
GE (linear); lk(gx1) and a'k(1xa) are the respective singular
values (vector column and vector line), associated with
lk (Mandel, 1971; Piepho, 1995); gik are the elements
related to the ith genotype of vector lk(gx1); apk are the
elements related to the pth environment of vector a'
k(1xa); rip is the additional residue and eip is the ijth error
associated with the model.
The GGE Biplot method is based on the model (Yan et al., 2000):
Yij _
_
yj = l1 xi1hj1 + l2 xi2hj2 + eij
in which: Yij is the grain yield mean of the ith cultivar,
in the jth environment; _y
j is the overall mean of the
cultivars in the jth environment; l1xilhjl is the first
principal component (IPCA1); l2xi2hj2 is the second
principal component (IPCA2); l1 and l2 are the
autovalues (characteristic roots) associated with IPCA1 and IPCA2, respectively; xi1 and xi2 are scores of the
first and second principal components, respectively,
for the ith cultivar; hjl and hj2 are the scores of the first
and second principal components, respectively, for
the jth environment; eij is the error associated with the
model.
The principal components were obtained from the transformation of the original set of variables, which were linear functions and independent among themselves.
All the analyses were carried out using SAS 6.1 (SAS Institute, 1999).
Results and Discussion
The cultivars showed different agronomic
performance, according to sowing time and year
(Table 1). The cvs. CMS 42, CMS 43, Rosa-claro, RS 20, Viçosa and Zélia showed wide adaptability. The cvs.
Beija-flor and IAC 112 were adapted to unfavorable
environments. The cv. Branco was adapted to favorable
environments (Table 2). The cvs. Beija-flor, Branco,
CMS 42, CMS 43, IAC 112 and Viçosa showed wide stability (Table 2).
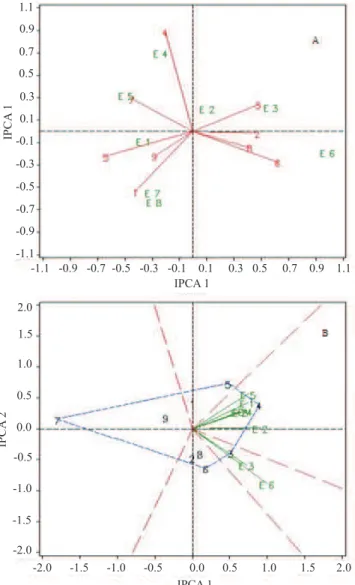
The AMMI Biplot analysis graphic of the nine cultivars in eight environments, over two agricultural years, is shown in Figure 1 A. The cultivars farthest away from the graphic’s origin contributed most to increase the GxE interaction, such as cvs. CMS 43 (4),
Rosa-claro (6), Beija-flor (1) and IAC 112 (5). The cvs. Zélia
(9), Branco (2), Viçosa (8) and CMS 42 (3) contributed least to the GxE interaction, as they were closer to the center of origin of the axes. The cultivars with most adaptability and stability, according Eberhart & Russell method were different from those in the AMMI Biplot, because of the differences in the adaptability and stability criteria of the two methods.
In the AMMI Biplot method, the small angles between the cultivar vectors inside the same quadrant are similar, such as for cvs. Viçosa (8) and
Rosa-claro (6), Zélia (9) and Beija-flor (1), Branco (2)
and Viçosa (8), Branco (2) and Rosa-claro (6), and IAC 112 (5) and Zélia (9). These results are reasonable, since cvs. Viçosa, Branco and Rosa-claro are local cultivars from the same region and were selected in the same environment, while cvs. IAC 112 and Zélia are commercial cultivars that have similar agronomic performance in situations with low disease incidence. The hybrid IAC 112, originated from lines extracted from the population UFV Amarelo, from the same region as cvs. Viçosa, Branco and Rosa-claro.
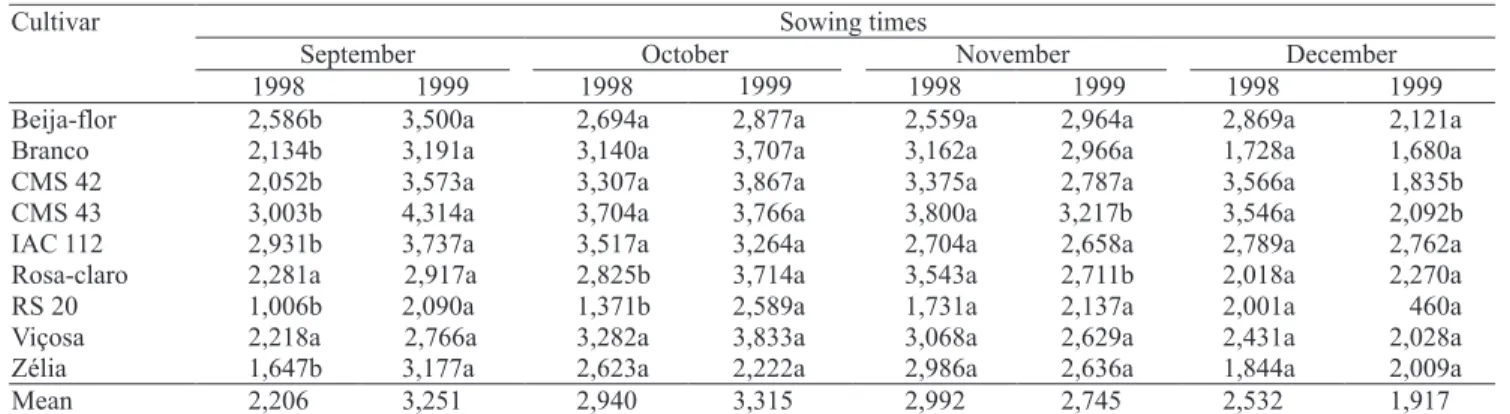
Table 1. Grain yield (kg ha-1) of popcorn cultivars, in four sowing times in two years(1).
(1)Means followed by the same letter in the same row, within a sowing time, do not differ by F test at 1% probability.
Sowing times
September October November December
Cultivar
1998 1999 1998 1999 1998 1999 1998 1999
Beija-flor 2,586b 3,500a 2,694a 2,877a 2,559a 2,964a 2,869a 2,121a Branco 2,134b 3,191a 3,140a 3,707a 3,162a 2,966a 1,728a 1,680a CMS 42 2,052b 3,573a 3,307a 3,867a 3,375a 2,787a 3,566a 1,835b CMS 43 3,003b 4,314a 3,704a 3,766a 3,800a 3,217b 3,546a 2,092b IAC 112 2,931b 3,737a 3,517a 3,264a 2,704a 2,658a 2,789a 2,762a Rosa-claro 2,281a 2,917a 2,825b 3,543a 2,711b 2,018a 2,270a RS 20 1,006b 2,090a 1,371b
3,714a
The positions of the cultivars in opposing quadrants on the Cartesian plan show their dissimilar genetic performance, as can be observed for cvs. Viçosa (8)
and RS 20 (7), Viçosa (8) and Beija-flor (1), Rosa-claro (6) and Beija-flor (1), Rosa-Rosa-claro (6) and RS 20
(7), and IAC 112 (5) and CMS 42 (3). Andrade et al.
(2002) identified heterosis by means of diallelic crosses between cvs. Beija-flor and Viçosa, consistent with the
results found in this work, since heterosis only can occur between genetically divergent germplasm. Miranda et al. (2003) obtained Mahalanobis generalized distance
estimates and identified the cultivar pairs RS 20/Beija-flor and Rosa-claro/RS 20 as most genetically distant based on the same field experiments reported here. They also identified the cultivar pairs IAC 112/Viçosa,
and Branco/CMS 43 as most genetically similar. The
cultivars RS 20, Zélia, IAC 112 and Beija-flor were identified as having the most potential for breeding.
The environments comprising September 1998 (E1), November 1999 (E7) and December 1999 (E8) were considered similar and, therefore, grouped into the same quadrant. These environments corresponded to the sowing times that provided three of the four most unfavorable environments (E1, E6, E7 and E8), according to the method of Eberhart & Russell.
The environments denoted by October 1998 (E2) and November 1998 (E3) were the most similar according to the method of Eberhart & Russell. The October 1998 (E2) environment was characterized as the ideal time for popcorn sowing, which is consistent with the
findings of Nunes et al. (2003) based on the same set of field experiments.
The December 1998 (E4), September 1999 (E5), and October 1999 (E6) environments were the most dissimilar, but support the conclusion by Eberhart & Russell (1966) method that December 1998 was unfavorable, while September 1999 (E5) and October 1999 (E6) were favorable. This characterizes one of the disadvantages of the Eberhart & Russell method, as applied to subjective “favorable” and “unfavorable”
environment classifications: the method is not always
*Significant by F test at 5% probability. **Significant by t test at 1% proba -bility. nsNon-significant by t test or F test at 5% probability.
-2.0 -1.5 -1.0 -0.5 0.0 0.5 1.0 1.5 2.0
IPCA 1 -2.0
2.0
1.5
1.0
0.5
0.0
-0.5
-1.0
-1.5
IPCA
2
-1.1 -0.9 -0.7 -0.5 -0.3 -0.1 0.1 0.3 0.5 0.7 0.9 1.1
IPCA 1
IPCA
1
-1.1 1.1
0.9
0.7
0.5
0.3
0.1
-0.1
-0.3
-0.5
-0.7
-0.9
Figure 1. Graphic of AMMI (A) and GGE (B) analyses of the popcorn cultivars Beija-flor (1), Branco (2), CMS 42 (3), CMS 43 (4), IAC 112 (5), Rosa-claro (6), RS 20 (7), Viçosa (8) and Zélia (9) in eight environments: September/1998 (E1), October/1998 (E2), November/1998 (E3), December/1998 (E4), September/1999 (E5), October/1999 (E6), November/1999 (E7), and December/1999 (E8).
Table 2. Mean of grain yield (GY) (kg ha-1), coefficient of
regression (b^i), variances of deviation of regression (s^2 di)
and coefficient of determination (^
R2%) of popcorn cultivars,
according to the method of Eberhart & Russell (1966).
Cultivar GY βˆi σˆ2di Rˆ2%
adequate for the analyses of environments under stress conditions to which the cultivars were submitted.
Thus, the environments were grouped as follows: group 1, unfavorable environments (E7 and E8); group 2, favorable environments (E2, E3, and E6); group 3, environment unfavorable (E4); group 4, favorable environments (E1 and E5).
In the AMMI analysis, when the vector representing the cultivar in the Cartesian plane was close to the position representing a given environment, it indicated that the cultivar performed best in this environment, compared to the other cultivars. Thus, the optimization of genetic cultivar potential, compared to the other optimizations, was obtained by cvs. CMS 42 (3), IAC 112 (5) and RS 20 (7) in a favorable environment, such as November 1998 (E3), September 1998 (E1)
or September 1999 (E5); by cvs. Beija-flor (1) and
CMS 43 (4), on delayed sowings such as those in November 1999 (E7), December 1998 (E4) and December 1999 (E8) (an unfavorable environments). These results are also in agreement with the interpretations of Nunes et al. (2003), based on the method of Eberhart & Russell using the same set of
field experiments used in the present analyses.
The position of a cultivar in the Cartesian plane, when inside the quadrant opposed to the environment’s position, indicates lack of adaptation of this cultivar to the environment. Thus, lack of adaptation was observed for cv. Rosa-claro (6) in September 1999 (E5, a favorable environment), cv. IAC 112 (5) in November 1998 (E3, a favorable environment), cv. CMS 42 (3) in September 1998 (E1, an unfavorable environment), and cv. RS 20 (7) in October 1999 (E6, a favorable environment).
The GGE Biplot analysis graphic of the nine popcorn cultivars in eight environments, over two agricultural
years, is displayed in Figure 1 B. The first two principal
components explained 85% of the total variance, within the limit recommended by Cruz & Regazzi (1997) of at least 80%.
Yan et al. (2000) stated that in the graphic analysis, the
first principal component (IPCA1) represents cultivar
productivity, and the second principal component (IPCA2), cultivar stability. However, Burgueño et al. (2000) stated that such properties tend to occur when the cultivars’ IPCA1 is highly correlated with cultivar effects.
The GGE Biplot showed that the ideal genotype must have a high IPCA1 value (high mean productivity) and
an IPCA2 value next to zero (more stable). Thus, based on the graphic interpretation, the cultivars with the highest IPCA1 values were CMS 43 (4), CMS 42 (3) and IAC 112 (5). The most stable cultivars were cvs. RS 20 (7) and Zélia (9). It was not possible to identify the ideal genotype by measuring just productivity and stability. When compared to the AMMI Biplot analysis
results, only cv. Zélia (9) was identified as stable.
Nunes et al. (2003) found the highest adaptabilities for
cvs. CMS 43 (3,430 kg ha-1), CMS 42 (3,045 kg ha-1)
and IAC 112 (3,045 kg ha-1) based on same field
experiments.
An adequate environment for experimental evaluation is one with high IPCA1 value (higher cultivar discrimination power) and IPCA2 value close to zero (more representative of the overall environment mean). Thus, the environments October 1998 (E2) and October 1999 (E6) (favorable environments) had the highest IPCA1 values, and only the environment October 1998 had an IPAC2 value close to zero. The differences among genotypes in October 1998 are more consistent in terms of genotype value, considering that the environment and GxE interaction effects were isolated. These results are in agreement with the best sowing time for popcorn in the Zona da Mata, in Minas Gerais, Brazil, as reported by Nunes et al. (2003). Compared to the AMMI Biplot analysis
results, the two environments were also classified as
favorable.
The GGE Biplot model graphic determines a polygon, established by the connection of the points representing the cultivars most distant from the origin in a Cartesian plane. This polygon is subdivided into sectors by straight lines from the origin, perpendicular to the polygon sides. The environment group within each sector and the cultivar at the polygon’s extremity characterize the mega-environment (Yan & Rajcan, 2002). Thus, two mega-environments were characterized, one with November 1998 (E3) and October 1999 (E6), representing favorable environments and another with the remaining environments. Some favorable
environments identified by the AMMI Biplot method
Conclusions
1. The AMMI Biplot graphic analysis is relatively simple, allowing of conclusions regarding phenotypic stability, genotypic behavior of the cultivars, and the degree of genetic divergence between cultivars and the environments that optimize performance.
2. The GGE Biplot graphic analysis complements
the AMMI Biplot environmental stratification, defining
mega-environments and the cultivars that optimize performance in such mega-environments.
3. Both methods are adequate to explain the genotype x environment interactions, providing results that are consistent with the classic method of regression of Eberhart & Russell.
4. Utilizing both methods simultaneously provides an innovative approach to the interpretation of genotype x environment interactions.
References
ANDRADE, R.A. de; CRUZ, C.D.; SCAPIM, C.A.; SILVÉRIO, L.; PINTO, R.J.B.; TONET, A. Análise dialélica da capacidade combinatória de variedades de milho-pipoca. Acta Scientiarum, v.24, p.1197-1204, 2002.
BLANCHE, S.B.; MYERS, G.O. Identifying discriminating locations for cultivar selection in Louisiana. Crop Science, v.46, p.946-949, 2006.
BURGUEÑO, J.; CADENA, A.; CROSSA, J.; BÄNZINGER, M.; GILMOUR, A.R.; CULLIS, B.R. User’s guide for spatial
analysis of field variety trials using ASREML. México, D.F.: Cimmyt, 2000.
CRUZ, C.D.; REGAZZI, A.J. Modelos biométricos aplicados ao melhoramento genético. 2.ed.Viçosa: UFV, 1997. 390p.
DEHGHANI, H.; EBADI, A.; YOUSEFI, A. Biplot analysis of genotype by environment interaction for barley yield in Iran.
Agronomy Journal, v.98, p.388-393, 2006.
DUARTE, J.B.; VENCOVSKY, R. Interação genótipos x ambientes: uma introdução à análise “AMMI”. Ribeirão Preto: Sociedade Brasileira de Genética, 1999. 60p. (Série monografias, n. 9).
EBERHART, S.A.; RUSSELL, W.A. Stability parameters for comparing varieties. Crop Science, v.6, p.36-40, 1966.
GAUCH JÚNIOR, H.; PIEPHO, H.P.; ANNICCHIARICO, P. Statistical analysis of yield trials by AMMI and GGE: further considerations. Crop Science, v.48, p.866–889, 2008.
KANG, M.S.; AGGARWAL, V.D.; CHIRWA, R.M. Adaptability and stability of bean cultivars as determined via yield-stability statistic and GGE Biplot analysis. Journal of Crop Improvement, v.15, p.97-120, 2006.
MANDEL, J.A. New analysis of variance model for non-additive data. Technometrics, v.13, p.1-18, 1971.
MIRANDA, G.V.; COIMBRA, R.R.; GODOY, C.L.; SOUZA, L.V.; GUIMARÃES, L.J.M.; MELO, A.V. de. Potencial de melhoramento e divergência genética de cultivares de milho-pipoca. Pesquisa Agropecuária Brasileira, v.38, p.681-688, 2003.
NUNES, H.V.; MIRANDA, G.V.; SOUZA, L.V. de; GALVÃO, J.C.C.; COIMBRA, R.R.; GUIMARÃES, L.J.M. Adaptabilidade e estabilidade de cultivares de milho-pipoca por meio de dois métodos de classificação. Revista Brasileira de Milho e Sorgo, v.1, p.1-11, 2003.
PIEPHO, H.P. Assessing cultivar adaptability by multiple comparison with the best.Agronomy Journal, v.87, p.1225-1227, 1995.
SAS INSTITUTE. SAS OnlineDoc. Version 8. Cary: SAS Institute, 1999.
YAN, W.K.; HUNT, L.A.; SHENG, Q.L.; SZLAVNICS, Z. Cultivar evaluation and mega-environment investigation based on the GGE Biplot. Crop Science, v.40, p.597-605, 2000.
YAN, W.K.; KANG, M.S.; MA, B.L.; WOODS, S.; CORNELIUS, P.L. GGE Biplot vs. AMMI analysis of genotype-by-environment data. Crop Science, v.47, p.643–655, 2007.
YAN, W.K.; RAJCAN, I. Biplot analysis of test sites and trait relations of soybean in Ontario. Crop Science, v.42, p.11-20, 2002.