ABSTRACT
RESUMO
Submitted on November 4th, 2014 and accepted on April 27th, 2016. 1 This work is part of the first author doctor’s thesis. Work funded by CNPq.
2Universidade Federal de Uberlândia, Uberlândia, Minas Gerais, Brasil. [email protected]; [email protected]; [email protected]
3Universidade de São Paulo, Escola Superior de Agricultura Luiz de Queiroz, Departamento de Ciências Exatas, Piracicaba, São Paulo, Brasil. [email protected] 4 Universidade de São Paulo, Escola Superior de Agricultura Luiz de Queiroz, Departamento de Genética, Piracicaba, São Paulo, Brasil. [email protected] 5Universidade Federal de Lavras, Lavras, Minas Gerais, Brasil. [email protected]
* Corresponding author: [email protected]
AMMI methodology in soybean: Cluster analysis with bootstrap
resampling in genetic divergence and stability
1This study aimed to propose a clustering methodology with bootstrap resampling using the Additive Main Effects and Multiplicative Interaction Analysis (AMMI) to contribute to better prediction of phenotypic stability of genotypes and environments. It also aims to analyze the genetic divergence in the assessment of soybean lines, identify genotypes with high-yielding characteristics, with control of chewing and sucking insect pests, and cluster similar genotypes for the traits evaluated. A total of 24 experiments were conducted in randomized blocks, with two replications subdivided in experimental groups with common controls. AMMI with principal component analysis indicated that PC1 and PC2 were significant, explaining 83.9% of the sum of squares of the interaction. The first singular axis of AMMI analysis captured the highest percentage of “pattern” and, with subsequent accumulation of the dimensions of the axes, there was a decrease in the percentage of “pattern” and an increase in “noise”. The Euclidean distance between genotype scores was used as the dissimilarity measure and clusters were obtained by the hierarchical method of Ward. Genotypes 97-8011, 97-8029, 97-8050 and IAS-5 had the best performance and are promising for recommendation purposes, with the greatest stability and best performance on grain yield.
Key words: genotype x environment interaction; clustering; percentile range.
Priscila Neves Faria2*, Carlos Tadeu dos Santos Dias3, José Baldin Pinheiro4, Lúcio Borges de Araújo2,
Marcelo Ângelo Cirillo5, Mirian Fernandes Carvalho Araújo2
10.1590/0034-737X201663040005
Metodologia AMMI na cultura da soja: análise de
cluster
com reamostragem
bootstrap
no
estudo da divergência e estabilidade genética
INTRODUCTION
Breeding for insect pest resistance is a trend of current plant breeding programs. In Brazil, the breeding program of the Agronomic Institute of Campinas (IAC) has released soybean cultivars resistant to insect pests: 100, IAC-17, IAC-23 and IAC-24. However, they are few and adapted only to the Southeast Region (Godoi et al., 2002); they are also obsolete compared to the current level of productivity (Rocha 2015).
Insect chemical control has been widely used in soybean (Musser & Catchot, 2008). Nevertheless, Rocha (2015) pointed out that in addition to high cost, excessive insecticide use has brought drastic consequences of environmental pollution and contamination of surface and underground water, animal contamination and impact on pollinators.
Because of the importance and quantitative and qualitative losses that insect attacks cause to soybean crop, cultivation of resistant varieties becomes a viable alternative in the search for less aggressive solutions to agroecosystems (Lima & Lara, 2004).
In addition, improved cultivars carrying genes capable of expressing high yield, wide adaptation, good resistance and/or tolerance to adverse biotic or abiotic factors are usually the most significant contribution to the efficiency of the productive sector (Behling et al., 2009)
To obtain new soybean cultivars, studies on genetic divergence are necessary to evaluate the diversity existing in cultivars introduced and those adapted to a particular region (Santos et al., 2011). When extensive soybean cultivations include diverse environments, genotypes have differential responses. In this sense, the interaction between the genotype and the environment (G × E) is a relevant aspect in the context of breeding (Maia et al., 2006).
Several statistical methods for the evaluation of genotype x environment interaction are available to understand this effect better and studies of G × E have been gained great applicability in the last two decades (Hongyu et al., 2014; Arciniegas-Alarcón et al., 2014).
The Additive Main Effects and Multiplicative Interaction (AMMI) analysis is a statistical method that is becoming widely used for interactions between genotypes and environments. The AMMI analysis can be used effectively to identify the best environmental
conditions for farming (selection of cultivation sites) and above average performance genotypes (Gauch et al., 2008; Yan, 2011). According to Pereira et al., (2009), the information provided by this methodology can be considered of better quality than that provided by traditional methods.
Zobel et al. (1988) argued that the AMMI method allows a more detailed analysis of G x E interaction, ensures the selection of more productive genotypes (able to capi-talize on positive interactions with environments), provides more accurate estimates of genotypic responses, and provides an easy graphical interpretation of the statistical analysis through a multivariate scatter plot (biplot) of data. From the results obtained, it is still possible to analyze the genetic divergence via clustering methods. Studies of stability and adaptability of genotypes and environments can estimate several population parameters. One of the parameters of interest is the trace of the variance and covariance matrix obtained from the interaction matrix G × E, since the trace represents the total variance. However, in the estimation process, the errors of the estimates are not always provided and there is little information about their empirical distribution (Carlini-Garcia et al., 2001).
In traditional AMMI analysis, there is the risk of increasing the probability of the type II error, that is, to accept an AMMI model with fewer axes, but the correct model would be more parameterized (Oliveira et al., 2003). Thus, the analysis of the structure of the interaction G × E in some studies is superficial and does not detail the effects of the interaction complexity (Lavoranti et al., 2007). In this context, the application of resampling bootstrap with the AMMI analysis contributes to a better prediction of the phenotypic stability and adaptability.
According to Martinez-Espinosa et al. (2006), given an estimate of a given statistic parameter calculated from a sample of data, one of the main objectives of Bootstrap is to estimate an appropriate confidence interval. In this study we used the bootstrap per- centile range.
Because of the lack in the literature of recent studies expanding the results of the AMMI bootstrap clustering analysis, the aim in this study was to establish a more accurate and reliable methodology for predicting phenotypic stability of genotypes and environments, to analyze, after euclidiana entre escores de genótipos como medida de dissimilaridade e posteriormente obtidos os agrupamentos por meio do método hierárquico de Ward. Os genótipos 97-8011, 97-8029, 97-8050 e a testemunha IAS-5 se comportaram como os mais promissores para fins de recomendação, pois os resultados indicaram maior estabilidade e melhor performance quanto à produtividade de grãos.
the study of G × E interaction, the genetic diversity of soybean lines via cluster analysis, and to identify similar genotypes that have high-yielding characteristics, with control of chewing and sucking insect pests.
MATERIAL AND METHODS
The data used in the present study originated from experiments of selection of soybean lines for grain yield with insect control. Insecticide was applied during the whole crop cycle to control chewing and sucking insects. Data from this study included 40 experimental F10 lines obtained from a 4 × 4 partial diallel developed to bring together genes of tolerance/resistance to insects present in the four parents (IAC-100, Crockett , Lamar and D7296011) with genes for good agronomic performance -mainly grain yield and precocity - present in four adapted cultivars (BR-6, IAS-5, Davis, Ocepar-4).
The experiments comprised two management systems (intensive control of insects and ecological control of insects), and it was conducted at two locations (Anhembi Experimental Station and Areão Farm) in the municipality of Piracicaba – SP, in the harvest year 1999/2000.
In the experiments with intensive insect control (CII), using frequent monitoring, the insecticides were applied whenever it was detected chewing insects or two bugs/ m2 cloth (beat cloth method). In experiments with ecological insect control (CEI), insecticides were applied only on the occurrence of large amount of damage on the leaves caused by biting insects, or when natural infestation reached four bugs/m2 cloth. Grain yield (GY) in grams/plot was calculated by the weight of mature seeds harvested in the harvest area of each plot, after a minimum of three weeks drying in laboratory environment for moisture standardization. More information about the F10 generation, the method for conducting the segregating populations, generation advance and other agronomic information is available in Pinheiro (1998).
For the interaction analysis, the combination local and management was considered as environment. Thus, four different environments (E1, E2, E3, and E4) were obtained: Anhembi-CII (E1), Anhembi-CEI (E2), Areão-CII (E3), and Areão-CEI (E4). The analysis was performed with the average of the two replicates in each environment.
A total of 24 experiments were arranged in a randomized block design with two replications subdivided in experi-mental groups with common controls (IAC-100, OCEPAR-4, IAS-5 and Primavera), and the replications were stratified for experimental sets with these controls. The population effects (lines and common controls) were considered fixed and the environment effect was considered random.
The AMMI methodology was applied in the analysis in two sequential steps: the main effects, in the additive
part (overall mean, genotype and environmental effects) were fitted by the analysis of variance (ANOVA), resulting in a non-additivity residue (G × E interaction); the interaction (multiplicative part of the model) was analyzed by Principal Component Analysis (PCA). The general model used followed Duarte & Vencovsky (1999).
The effect of the ith genotype with the jth environment (ge)ij on the mathematical model was modeled according
to the equation , where λk is the
singular value of the kth principal component of the interaction (PCI) retained in the AMMI model; γik is the singular vector of the ith genotype in the kth PCI; αjk is the singular vector of the jth environment in the kth PCI;
ρij is the residue of the interaction G × E or AMMI residue (noise present in the data); k are nonzero characteristic roots, i.e., the PCI’s retained in the model, where k = (1, 2, ..., p), where rank = min(g-1, e-1) is the post of GE matrix (Duarte & Vencovsky, 1999).
Thus, the GE interaction matrix is modeled by the
equation, , under the constraints
(borderline conditions). Therefore, the term GE (interaction in the traditional model) in the AMMI methodology is represented by the sum of p parts, each resulting from the multiplication of λk, which is expressed in the same unit of Yij by a genotypic effect (γik) and an environmental effect (αjk), both dimensionless, that is, (n: the
interaction terms). The term λk provides information relating to the kth part of the interaction G×E; the effects
γik and αjk represent the weights of genotype i and environment j in that part of the interaction.
Thus, according to Dias & Krzanowski (2006), the additive and multiplicative components of the AMMI model
can be written as ,
in which the additive part is represented by and the multiplicative part can be unfolded in what we call
“pattern” and “noise “ with n < p.
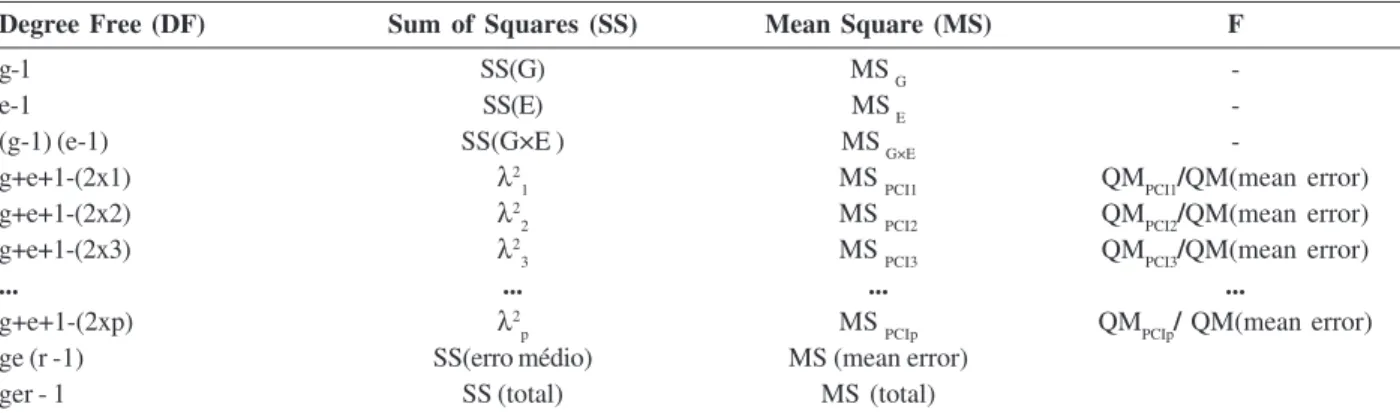
Later, the FGollob test (Table 1) proposed by Gollob (1968) was used to verify the significant presence of the interaction which is the first necessary condition to undertake this study.
The bootstrap resampling was performed in the non-parametric version, and in accordance with the AMMI model, we chose the resampling in the columns of the matrix of interaction effects, which was obtained from the estimated values.
Coelho Barros et al. (2008) described the bootstrap nonparametric method for obtaining the confidence intervals of coefficients of a multiple regression model. For this purpose, the author considers the following notation:
U = (y, x1, x2,..., xk)
where y = (y1, y2,..., yn) is the observation vector of the dependent variable and xj= (x1j, x2j,..., xnj) = j = 1,..., k, are the observation vectors of the independent variables, is a continuous variable for all j.
p-bootstrapping intervals
I. Sampling, with U replacement, a bootstrap sample (y* 1, x*
11, x *
12,..., x *
1k),..., (y *
n, x *
n1, x *
n2,..., x *
nk).
II. From the bootstrap sample (y* 1, x
* 11, x
* 12,..., x
* 1k),..., (y
* n, x*
n1, x *
n2,..., x *
nk)., calculate the least squares estimator of
β, represented by .
III. Repeat steps I and II a large B number of times. IV. Ordain the values obtained from smallest to largest so that
V. Confidence limits are determined for a specified probability equal to the significance level, where 0 < α < 1, such that the pbootstrap confidence interval 100×(1
-α)% is given by in which q1 = [B x (a / 2)] and
q2 = B - q1, where [x] indicates the lowest integer greater than or equal to the argument x.
As example, in V, for (α = 0.05 and B = 1000) => q1 = 25 e q2 = 975). Thus, the 95% p-bootstrap confidence interval is given by (25) ; (975). The confidence intervals for any other parameters of interest are obtained similarly.
Therefore, it can be said that the confidence interval obtained has 95% probability of containing the true value of the parameter on which the estimate was based.
When an independent variable is not continuous, the resampling process (I, II and III) should be done at each level of the variable (Wu, 1986 & Tibshirani, 1988). Other alternatives to the p-bootstrap confidence interval are discussed, for example, in Efron & Tibshirani (1993).
All statistical analyzes were performed using the statistical software R (The R Development Core Team, 2010) using the packages fields (Furrer & Nychka, 2009) and agricolae (De Mendiburu, 2009).
RESULTS AND DISCUSSION
The individual variance analysis (in each environment) was obtained for the soybean lines studied (Table 2), in the harvest year 1999/2000, for the statistical evaluation of the genetic variability between treatments (soybean lines) and the experimental precision. Once difference between treatments was detected, the joint analysis of variance (Table 3) was performed, and the significant occurrence of genotype x environment (G × E) interaction was detected by the F test.
There was significant difference at 1% for genotypes (G), environmens (E) and their interaction (G × E). However, the effect of blocks within environments was not significant. As for the sum of squares (SS), the magnitude of the source of variation environments was far superior to the others, being responsible for most of the variation occurred. Therefore, it can be inferred that the effects of sites contributed more greatly to the variation in yield. The significance for genotypes indicated that they are composed of genetically distinct groups, showing sufficient availability of variability for selection (Table 3). The significance of the G×E interaction indicated that the variances of genotypes are different from one environment to another, which allows us to infer that there are genotypes or genotype groups with specific
Table 1: AMMI analysis by the Gollob (1968) criterion for allocating degrees of freedom to principal components of interaction
Degree Free (DF) Sum of Squares (SS) Mean Square (MS) F
g-1 SS(G) MS G
-e-1 SS(E) MS E
-(g-1) (e-1) SS(G×E ) MS G×E
-g+e+1-(2x1) λ2
1 MS PCI1 QMPCI1/QM(mean error)
g+e+1-(2x2) λ2
2 MS PCI2 QMPCI2/QM(mean error)
g+e+1-(2x3) λ2
3 MS PCI3 QMPCI3/QM(mean error)
... ... ... ...
g+e+1-(2xp) λ2
p MS PCIp QMPCIp/ QM(mean error)
ge (r -1) SS(erro médio) MS (mean error)
ger - 1 SS (total) MS (total)
adaptation to particular environments and others with general adaptation to all environments. Based on these results, we proceeded to the more detailed study of the interaction through its decomposition into major components (Table 3).
The analysis of G×E interaction with principal components showed that the first two axes (PCI1 and PCI2) were significant (p < 0.05), explaining 83.9% of the of the SSG×E. The result indicates that a relatively simple model (with few multiplicative terms) can have good predictive capability for the differential performance of genotypes in the environments evaluated. This result is in agreement with other studies (Cravero et al., 2010; Ebdon & Gauch, 2011).
Thus, the scores of the genotypes were obtained following the AMMI2 model, in which the first singular axis of the AMMI analysis captures the highest percentage of “pattern” and, with the subsequent accumulation of axis dimensions, there is a decrease in the percentage of “pattern” and an increase of “noise”.
In studies in which only the first two axes (PCI1 and PCI2) were significant, the percentage of SSG×E explanation ranged from 61% to 88% (Borges et al., 2000; Yan & Hunt, 2002; Freire Filho et al., 2003; Campbell & Jones, 2005; Tarakanovas & Sprainaitis, 2005; Kaya et al., 2006). In this study, this percentage surpassed most studies in the
field (83.9%), and the significance of only the first two axes shows that they are enough to capture the “pattern” associated with the G×E interaction of interest.
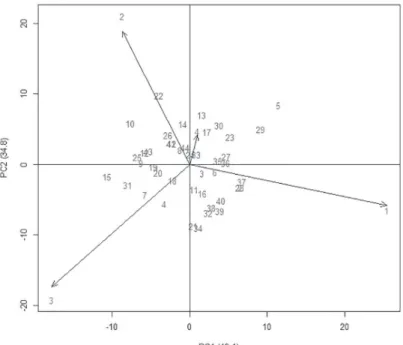
Figure 1 shows the genotype performances on grain yield (GY), which is a character of great importance for cul-tivar recommendation. Among all the genotypes, it was found that those on the right of the vertical dashed line are the genotypes that exceeded the overall GY mean (991.53 kg ha-1). Genotype 97-8056 had the highest mean grain yield (1166.50 kg ha-1); however, the control IAC-100 recorded the lowest mean (774.87 kg ha-1) for this character.
Figure 2 shows that the environment 4 contributed the least to environment interaction, having the lowest vector. Besides, it was found that the genotype 97-8056 (nº 37) showed the highest grain yield score (1166.50 kg ha-1), and it was positively related to environment 1, which contributed the most to the G×E interaction, having the largest vector.
The genotypes with scores close to zero, contributed little or nothing to the interaction, and thus are considered stable. In Figure 2, the genotypes that correspond to this situation were 97-8011 (nº 8), 97-8029 (nº 24), 97-8050 (nº 33), and the control IAS-5 (nº 44). These genotypes can be considered of high stability, and thereby they adapt to any one of the four environments.
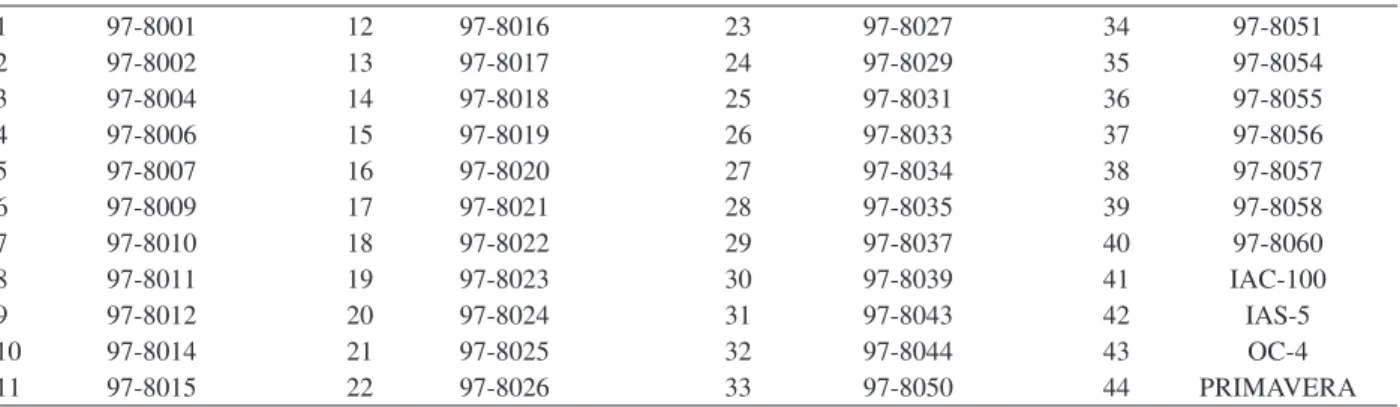
Table 2: Identification of the soybean lines in the study
1 97-8001 12 97-8016 23 97-8027 34 97-8051
2 97-8002 13 97-8017 24 97-8029 35 97-8054
3 97-8004 14 97-8018 25 97-8031 36 97-8055
4 97-8006 15 97-8019 26 97-8033 37 97-8056
5 97-8007 16 97-8020 27 97-8034 38 97-8057
6 97-8009 17 97-8021 28 97-8035 39 97-8058
7 97-8010 18 97-8022 29 97-8037 40 97-8060
8 97-8011 19 97-8023 30 97-8039 41 IAC-100
9 97-8012 20 97-8024 31 97-8043 42 IAS-5
10 97-8014 21 97-8025 32 97-8044 43 OC-4
11 97-8015 22 97-8026 33 97-8050 44 PRIMAVERA
Table 3: Joint analysis of variance for grain yield data, in kg/ha, including the unfolding of the interaction of 44 soybean genotypes in four environments
Source DF S S MS F Pr (>F)
Environment 3 3,827,879 1,275,959 53.341 < 0.0001**
Block(Environment) 4 210,185 52,546 2.197 0.070626
Genotype 43 2,392,397 55,637 2.326 < 0.0001**
G×E 129 4,542,867 35,216 1.472 0.006804**
Error 204 4,879,923 23,921 1
PCI % % Ac.
PCI1 49.1 49.1 45 2,162,507 48,055.71 2.01 0.0006
PCI2 34.8 83.9 43 1,534,622 35,688.88 1.49 0.036
PCI3 16.1 100 41 710,244.2 17,323.03 0.72 0.8945
Genotypes that can be widely recommended are those that combine high means of the character GY and stability in relation to the environments in study, which occurred with genotype 8 with recorded mean of 917 kg ha-1, genotype 24 with mean of 919 kg ha-1, genotype 33 with mean of 926.75 kg ha-1, and the control genotype 44 with mean of 1095.62 kg ha-1. All means of these genotypes were above the overall mean of GY. Nevertheless, environment 1 had the highest mean for the GY character (1408.60 kg ha-1).
In addition, it was observed that in the biplot (Figure 2), the most relevant aspects for the fitness of the genotypes
were also identified: genotypes 9, 10 and 22 had a positive interaction in the environment 2, as well as the control 43. The genotypes with positive interaction in environment 3 were: 7, 9, 25, 15 and 31. Genotypes 13 and 17 had positive interaction with environment 4, while genotypes 4 and 11 had negative interaction in this environment.
The divergence between genotypes was evaluated by Ward’s Agglomerative Hierarchical Clustering using the Euclidean distance, since this distance is more recommended when the calculation units are scores of principal components (Cruz et al., 2004), as it is the case of AMMI analysis.
Figure 2: AMMI2 Biplot for soybean yield data (kg ha-1) of 44 genotypes (G) and four environments (A), harvest year 2000.
From the cluster analysis performed on the matrix, which is the average of the resampled distance matrices, a dendrogram was generated (Figure 3) representing the groups formed among the genotypes studied.
The dendrogram recorded the formation of six different groups: three of which contained the controls (genotypes 41, 42, 43 and 44), showing that the controls have different characteristics from each other and were allocated to different groups, according to similarity. However, the groups containing the controls stood out from the others in relation to grain yield and stability.
The group of the control genotype 42 showed mean production higher than the overall mean, and in this group, genotype 13 had the greatest stability, allowing its recommendation for any of the environments.
However, the group formed by the controls 44 and 43 had GY mean similar to the overall mean, having the most stable genotypes (numbers 3 and 11). On the other hand,
CONCLUSION
This study showed that the genotype 37, which had the highest grain yield score, is recommended for environment 1.
The genotypes 8, 24, 33 and the control IAS-5 can be widely recommended, for being stable and having high means for the character grain yield.
The lowest relative reduction in production when subjected to insect attack was recorded for genotypes 3 and 11.
ACKOWLEDGEMTS
The authors want to thank the National Council for Scientific and Technological Development (CNPq) for the grant awarded.
when analyzing the relative reduction in production when subjected to insect infestation, these materials showed one of the lowest mean reduction values .
The bootstrap made it possible to obtain intervals close to 100 (1 - α)% of confidence for the parameter of interest (trace of the covariance matrix of the G×E matrix). The analysis of the percentile range based on the bootstrap percentiles, related to the parameter estimation, indicated that this estimate (equal to 2,203,686) is in the range defined by the 10th percentile (equal to 1,881,002), the lower limit, and the 90th percentile (equal to 2,738,849), the upper limit. Therefore, as the estimated value for the parameter of interest is within the interval obtained, it is considered that there is no tendency, and according to Monico et al. (2009), for cases where there is no tendency, the accuracy is summarized as precision, which was obtained by the bootstrap resampling performed.
Figure 3: Dendrogram of Euclidean distances between the bootstrap scores of AMMI2 genotype markers for grain yield data, in kg ha-1.
REFERENCES
Arciniegas-Alarcón S, Dias CTS & Garcia-Peña M (2014) Im-putação múltipla livre de distribuição em tabelas incomple-tas de dupla entrada. Pesquisa Agropecuária Brasileira, 49:683-691.
Behling M, Lima E, Sobrinho NMBA & Zonta E (2009) Produti-vidade e desempenho vegetativo de dez cultivares de soja na Baixada Fluminense, Seropédica-RJ. Revista Ceres, 56:69-73. Borges LC, Ferreira DF, Abreu AFB & Ramalho MAP (2000) Emprego de metodologias de avaliação da estabilidade
fenotípica na cultura do feijoeiro (Phaseolus
vulgaris L.). Revista Ceres, 47:89-102.
Campbell BT & Jones MA (2005) Assessment of genotype x environment interactions for yield and fiber quality in cotton performance trials. Euphytica, 144:69-78.
Coelho Barros EA, Achcar JA & Martinez EZ (2008) Statistical analysis for longitudinal counting data in the presence of a covariate considering different frailty models. Brazilian Journal of Probability and Statistics, 22:183-205.
Cravero V, Martin E, Anido FL & Cointry E (2010) Stability through years in a non-balanced trial of globe artichoke varietal types. Scientia Horticulturae, 126:73-79.
Cruz CD, Regazzi AJ & Carneiro PCS (2004) Modelos biométricos aplicados ao melhoramento genético. Viçosa, Editora UFV. 585p.
De Mendiburu F (2009) Agricolae: Statistical Procedures for Agricultural Research. Disponível em: <https://cran.r-project.org/web/packages/agricolae/agricolae.pdf>. Acessado em: 03 de dezembro de 2015.
Dias CTS & Krzanowski WJ (2006) Choosing components in the additive main effect and multiplicative interaction (AMMI) models. Scientia Agricola, 63:169-175.
Duarte JB & Vencovsky R (1999) Interação genótipos x ambien-tes: uma introdução à análise AMMI. Ribeirão Preto, Sociedade Brasileira de Genética. 60p.
Ebdon JS & Gauch HG (2011) Direct validation of AMMI predictions in turfgrass trials. Crop Science, 51:862-869.
Efron B & Tibshirani RJ (1993) An introduction to the bootstrap. London, Chapman & Hall, 436p.
Freire Filho FR, Ribeiro VQ, Rocha MM & Lopes AC (2003) Adap-tabilidade e esAdap-tabilidade da produtividade de grãos de caupi enramador de tegumento mulato. Pesquisa Agropecuária Bra-sileira, 38:591-598.
Furrer R, Nychka D & Sain S (2009) fields: Tools for Spatial Data. R package. Disponível em: <https://cran.r-project.org/web/ packages/fields/fields.pdf>. Acessado em: 03 de julho de 2014.
Gauch HG, Piepho HP & Annicchiarico P (2008) Statistical analysis of yield trials by AMMI and GGE: Further considerations. Crop Science, 48:866-889.
Godoi CRC, Pereira FS, Umeno F, Ázara NA, Lima LPMS, Silva RP, Oliveira AB, Araújo IM, Zucchi MI & Pinheiro JB (2002) Resistência a insetos em populações de soja com diferentes proporções gênicas de genitores resistentes. Revista Agropecuária Tropical, 01:47-55.
Gollob HF (1968) A statistical model which combines features of factor analytic and analysis of variance techniques. Psychometrika, 33:73-115.
Hongyu K, Garcia-Peña M, Araújo LB & Dias CTS (2014) Statistical analysis of yield trials by AMMI analysis of genotype x environment interaction. Biometrical Letters, 51:89-102. Kaya Y, Akçura M & Taner S (2006) GGE biplot analysis of
multi-environment yield trials in bread wheat. Turkish Journal of Agriculture and Forestry, 30:325-337.
Lavoranti OJ (2003) Estabilidade e adaptabilidade fenotípica atra-vés da reamostragem “Bootstrap” no modelo AMMI. Tese de Doutorado. Escola Superior de Agricultura “Luiz de Queiroz”, Piracicaba. 166p.
Lavoranti OJ, Dias CTS & Krzanowski WJ (2007) Phenotypic Stability via AMMI Model with Bootstrap Re-Sampling. Pes-quisa Florestal Brasileira, 54:45-52.
Lima ACS & Lara FM (2004) Resistência de genótipos de soja à mosca branca Bemisia tabaci (Genn.) biótipo B (Hemiptera: Aleyrodidae). Neotropical Entomology, 33:71-75.
Maia MCC, Vello NA, Rocha M de M, Pinheiro JB & Silva Júnior NF da (2006) Adaptabilidade e estabilidade de linhagens experi-mentais de soja selecionadas para caracteres agronômicos atra-vés de método uni-multivariado. Bragantia, 65:215-226.
Martinez-Espinosa M, Sandanielo VLM & Louzada-Neto F (2006) O método de bootstrap para o estudo de dados de fadiga dos materiais. Revista de Matemática e Estatística, 02:41-54. Monico JFG, Dal Poz AP, Galo M, Santos MC & Castro LO
(2009) Acurácia e Precisão: Revendo os Conceitos de Forma Acurada. Boletim de Ciências Geodésicas, 15:469-483.
Musser FR & Catchot AL (2008) Mississippi soybean insect losses. Midsouth Entomologist, 1:29-36.
Oliveira AB, Duarte JB & Pinheiro JB (2003) Emprego da análise AMMI na avaliação da estabilidade produtiva em soja. Pesquisa Agropecuária Brasileira, 38:357-364.
Pereira HS, Melo LC, Faria LC, Peloso MJ del, Costa JGC, Rava CA & Wendland A (2009) Adaptabilidade e estabilidade de genótipos de feijoeiro-comum com grãos tipo carioca na Re-gião Central do Brasil. Pesquisa Agropecuária Brasileira, 44:29-37.
Pinheiro JB (1998) Seleção para caracteres agronômicos, em di-ferentes épocas de cultivo, de populações de soja com resistên-cia a insetos. Tese de Doutorado. Escola Superior de Agricultura “Luiz de Queiroz”, Piracicaba. 143p.
R Development Core Team (2010) R: A Language and environment for statistical computing, reference index version 2.12.1. Vienna, R Foundation for Statistical Computing. Disponível em: <http:/ /www.R-project.org/>. Acessado em: 13 de agosto 2014. Rocha F (2015) Seleção de genótipos de soja para resistência ao
complexo de percevejos. Tese de Doutorado. Escola Superior de Agricultura “Luiz de Queiroz”, Piracicaba. 82p.
Santos ER, Barros HB, Ferraz E de C, Capone A, Santos AF dos & Fidelis RR (2011) Divergência entre genótipos de soja, cultiva-dos em várzea irrigada. Revista Ceres, 58:755-764.
Tarakanovas P & Sprainaitis A (2005) Main additive effect and multiplicative interaction analysis of white clover genetic resources. Biologija, 04:38-42.
Tibshirani R (1988) Correction to Discussion of: Jackknife, Bootstrap and other Resampling Methods in Regression Analysis. Annals of Statistics, 16:479.
Wu CFJ (1986) Jackknife, bootstrap and other resampling methods in regression analysis. Annals of Statistics, 14:1261-1295. Yan WK & Hunt LA (2002) Biplot analysis of diallel data. Crop
Science, 42:21-30.
Yan W (2011) GGE Biplot vs. AMMI Graphs for Genotype-by-Environment Data Analysis. Journal of the India Society of Agricultural Statistics, 65:181-193.