Assessing the Efficiency of Mother-to-Child HIV
Prevention in Low- and Middle-Income Countries
using Data Envelopment Analysis
Sérgio P. Santos1*, Carla A.E. Amado1, Mauro F. Santos2
1 Faculty of Economics, University of Algarve, 8005-139 Faro, Portugal and
CEFAGE-UE, University of Évora.
2CASEE, University of Algarve.
* Corresponding author’s e-mail, telephone and fax numbers:
Phone:+351 289800100 – Ext. 7130 Fax: +351 289800063/5 E-mail: [email protected]
Abstract
AIDS is one of the most significant health care problems worldwide. Due to the difficulty and costs involved in treating HIV, preventing infection is of paramount importance in controlling the AIDS epidemic. The main purpose of this paper is to explore the potential of using Data Envelopment Analysis (DEA) to establish international comparisons on the efficiency of implementation of HIV prevention programmes. To do this we use data from 52 low- and middle-income countries regarding the prevention of mother-to-child transmission of HIV. Our results indicate that there is a remarkable variation in the efficiency of prevention services across nations, suggesting that a better use of resources could lead to more and improved services, and ultimately, prevent the infection of thousands of children. These results also demonstrate the potential strategic role of DEA for the efficient and effective planning of scarce resources to fight the epidemic.
Keywords: HIV Prevention, DEA, Mother-to-Child HIV Transmission.
This is a post-print (i.e. final draft post-refereeing) of a manuscript submitted to Health Care Management Science.
To cite this article: Santos, S.P., Amado, C.A.F. and M. Santos (2012). “Assessing the efficiency of mother-to-child HIV prevention in low- and middle-income countries using Data Envelopment Analysis”. Health Care Management Science, 15(3): 206-222.
1. Introduction
The epidemic caused by the human immunodeficiency virus (HIV) is currently one of the greatest public health problems worldwide. It is estimated that in 2009 alone, 33.3 million people were living with HIV/AIDS, 2.6 million were newly infected with HIV and 1.8 million died from AIDS [1]. Although the majority of the disease burden remains in sub-Saharan Africa, the number of HIV-infected people is rapidly increasing in other regions, especially in Eastern Europe and Central Asia.
Due to the difficulty and costs involved in treating HIV, preventing infection is of paramount importance in controlling the AIDS epidemic. In particular, effective prevention measures can reduce new infections, the incidence of the disease and, consequently, the number of people that will require treatment. Whilst appropriate prevention measures can change the course of the epidemic, they require very substantial resources. It is estimated that the average cost of preventing an infection is US $3,923 [2]. Given the limited resources available to healthcare systems in many of the most affected countries, the implementation of efficient and effective HIV prevention interventions is vital for policy makers and health care managers. It is therefore imperative to identify the most effective HIV prevention strategies as well as the most efficient ways of allocating the scarce resources available to these strategies.
Resource allocation models have been developed over the years intended to assist with allocation strategies that might improve the overall effectiveness of HIV prevention efforts. For some recent examples, the reader is referred to Lasry et al. [3], Earnshaw et al. [4] and Brandeau et al. [5]. However, as pointed out by Rauner and Brandeau [6], determining how best to spend limited resources on HIV prevention programmes in different regions of the world is a challenging task. One way of overcoming this challenge and obtain useful information for decision making consists of identifying best practices that can be shared to promote improvements. Benchmarking exercises to identify best practices amongst health care providers within a country or across countries have the
potential to provide essential information for the improved allocation of HIV prevention funds.
Identifying best practice is not, however, straightforward. Although some international comparisons have been carried out in recent years, the approaches adopted have tended to rely on two major types of analysis: one that focuses on specific interventions and compares the relative costs and benefits of a particular prevention programme against the other alternatives (e.g. Beck and Miner [7]; Harling et al. [8]), and another that focuses on data aggregated at the country level and uses multiple performance indicators to show the progress that is being made by each country towards HIV prevention (e.g. UNAIDS [1]). Whilst valuable, these approaches are limited in carrying out comparative analyses and identifying best practice. The former is strongly impacted by the range of prevention strategies and geographic settings examined, ignoring the fact that one intervention might not be efficient in some countries but be efficient in others. The latter does not usually account for the fact that some countries might be better than others when using certain indicators, while poorer using others, making it difficult to derive a single aggregate measure of the overall performance of each of these countries in fighting the HIV epidemic.
The main purpose of this paper is to address these limitations by exploring the potential of using Data Envelopment Analysis (DEA) to establish international comparisons on the efficiency of HIV prevention, focusing on mother-to-child transmission, which is one of the strategies given high priority in battling the HIV epidemic. For an overview of the most important types of HIV/AIDS prevention and treatment interventions, the reader is referred to Rauner and Brandeau [6]. Mother-to-child transmission occurs when an HIV positive woman passes the virus to her baby during pregnancy, labour and delivery, or by breastfeeding. It is estimated that without appropriate prevention and treatment, around 15 to 30 percent of babies born to HIV positive women will contract HIV during pregnancy and delivery. A further 5 to 20 percent will become infected through breastfeeding [9]. It is, therefore, fundamental to ensure that mother-to-child- interventions which counsel and test pregnant women for HIV, offer antiretroviral medications to both the mother and infant to prevent HIV transmission, and
provide substitute feeding programmes to prevent transmission through breastfeeding, are as efficient and effective as possible. An efficient and effective use of resources in this particular context has the potential to save the lives of thousands of children each year.
2. Assessing Efficiency of Mother-to-Child HIV
Prevention
In recent years, we have witnessed remarkable progress in the fight against the mother-to-child transmission of HIV, with the AIDS Annual Report [1] documenting a significant decrease in the infection rates among children born to mothers living with HIV. According to this report, in 2009, an estimated 370,000 children contracted HIV during the perinatal and breastfeeding period, down from 500,000 in 2001. Prevention of mother-to-child HIV transmission (PMTCT) has played a key role in this decrease. Unfortunately, however, this success has not been shared by all countries. Whilst in high-income countries mother-to-child HIV transmission has been virtually eliminated thanks to effective prevention and care, the number of children infected in low- and middle-income countries is still very high. This might be explained in part by the fact that coverage of antenatal care and other services for preventing mother-to-child transmission among women living with HIV varies considerably across nations. However, the fact that infection rates also vary considerably among low- and middle-income countries, seems to indicate that the resources allocated to prevention have been more efficiently and effectively used in some countries than in others.
The need to use the resources allocated to HIV prevention efficiently can hardly be overstated. As emphasised by Appleby and Thomas [10] and Flessa [11], an inefficient use of resources in the health care context means not only that money is wasted, but more importantly that the opportunity is lost to save lives, avert pain, and provide care to those in need. The search for efficiency and effectiveness in the use of resources has been a key driving force for many of the OR/MS science applications in the health care sector and for the emergence of
important publications in this area (see, for example, Ozcan and Smith [12]). With this call for more efficiency and effectiveness in health care, a call for a further shift in the balance between prevention and treatment has also been made, with some authors acknowledging that OR/MS techniques have an important role to play in helping the shift towards more prevention (e.g. Royston [13]). Whilst these calls apply to all health care areas, they are particularly meaningful in the case of the HIV/AIDS epidemic. The Committee on HIV Prevention Strategies in the United States pointed out that decisions regarding the allocation of HIV prevention funds represent the single most important set of HIV prevention decisions made [14]. However, as emphasised by Kaplan and Merson [15: 1907] it is important to bear in mind that HIV “resource allocation is not simply an argument for how to divide the pie; some allocations are arguably better than others.”
Considering that an efficient and effective allocation of resources is a key ingredient in controlling the HIV epidemic, and that there is some compelling evidence suggesting that the unit cost of HIV prevention programmes may be both higher and more variable than some estimates suggest (e.g. Marseille et al. [16]), it is fundamental for researchers to carry out comparative analyses across nations in order to identify best practices. The research we discuss in this paper aims to shed some light on this issue by comparing the resources spent by several countries on mother-to-child HIV prevention with the services provided.
Although there is an increasing and highly relevant body of literature on the efficiency and/or effectiveness of specific prevention, treatment and care programmes (see for example, Harling et al. [8]), the number of studies assessing and comparing how efficiently different countries are using the available funds to combat the epidemic is very rare. Furthermore, when comparisons are made, these tend to rely on the use of multiple performance indicators or ratios rather than on a single aggregate measure of the overall performance of each country. This problem could be addressed if it was possible to reach an agreement on the relative importance of the various performance indicators. This is, however, seldom the case as the importance of each indicator is dependent upon the perspective taken and upon the priorities of the countries under evaluation.
Data envelopment analysis, developed by Charnes, Cooper and Rhodes in 1978 [17] is a non-parametric linear programming technique which has proved very effective in addressing this limitation and it is one of the most important and widely used approaches to measure the performance of homogeneous decision making units (DMUs) performing the same task. This technique uses a production metaphor. Each DMU is engaged in a transformation process, where by using some inputs (resources) it is trying to produce some outputs (goods or services). With the provision of these services the DMU achieves certain outcomes which measure the impact of the services on the users. One of the interesting features of DEA is that it allows each unit to identify a benchmarking group; that is, a group of units that are following the same objectives and priorities, but performing better. In this respect DEA aims to respect the priorities of each DMU by allowing each one of them to choose the weight structure for inputs and outputs that most benefits its evaluation. As a result, it aims to classify each unit in the best possible light in comparison to the other units.
The formulation of the DEA problem, under variable returns to scale, with output orientation, for DMU 0, as proposed by Banker et al. [18] is as follows:
φ Max Subject to: 0 1 i j n j ij X X ≤
∑
= λ(
i
=
1
,...,
m
)
0 1 j n j j rj Y Y λ ≥φ∑
=(
r
=
1
,...,
s
)
1 1 =∑
= n j j λ 0 ≥ j λ(
j=1,...,n)
In this problem, n is the number of DMUs; s is the number of outputs and m is the number of inputs; Yr0 is the amount of output r generated by unit 0 and Xi0 is the
φ obtained from the solution to this linear programming problem is the maximum rate of proportional expansion in all outputs of DMU 0, without decreasing its inputs. The efficiency rate of DMU 0 can be obtained by calculating 1/ φ , and will be equal to 1 if the DMU is efficient, and smaller than 1 if the DMU is inefficient when compared with the other DMUs. A comprehensive review of the DEA technique can be found in Cooper et al. [19, 20].
Since its advent in 1978, this method has been the subject of several theoretical developments and has been extensively applied in many sectors including education, finance, agriculture, sports, marketing and manufacturing, to name just a few. There have also been several documented applications of DEA in the health care sector. The Health Care Management Science journal, amongst others, has been an important forum for the dissemination of these applications. In two recent special issues of this journal dedicated to contemporary health care applications in OR/MS and to operational research applied to health services, the reader can find several good examples of DEA in this context (e.g. Ozgen and Ozcan [21]; O’Neill and Dexter [22]; and Langabeer and Ozcan [23]). Hollingsworth et al. [24], Hollingsworth [25], Chilingerian and Sherman [26] and more recently Hollingsworth [27], review several of the DEA applications in the health care context.
Whilst the use of DEA in the health care sector has been prolific, to the best of our knowledge, no studies have been documented on the use of DEA comparing the efficiency of countries in using HIV prevention resources. The only exception to this is the study by Zanakis et al. [28], which examines the impact of major socio-economic factors on HIV/AIDS indicators and assesses each country’s efficiency in battling the epidemic. In so doing, it makes an important contribution to this under researched area, not only because it is the first one using DEA to assess the efficiency of nations in battling HIV but also because it identifies that research on HIV/AIDS should include both individual and socio-economic factors, to better understand the development of the global epidemic.
The research we discuss in this paper presents, however, some important departures from Zanakis et al.’s study. Firstly, the assessment of each country’s
efficiency in preventing HIV infections is the main focus and objective of our research. In Zanakis et al.’s study this objective was part of a broader agenda and played a fairly marginal role. Secondly, our study focuses exclusively on the efficiency of HIV prevention, whilst theirs does not seem to distinguish prevention from treatment. However, our study, in line with the findings reported by Beck [29] and Piot et al. [30] acknowledges that the containment of the HIV epidemic requires a global strategy which combines effective prevention with treatment and care programmes. This implies that some variables related to HIV treatment and care will be considered in the analysis as they have a significant impact on HIV transmission. Thirdly, the model we propose is considerably different from the one they have used. In particular, we focus on a particular programme and use variables more directly related to HIV prevention than the surrogate general health variables used by Zanakis and colleagues. Finally, our study, by using data for 2008, aims to offer an updated overview of the efficiency of recent efforts in battling the epidemic whereas the analysis carried out by Zanakis et al. used data from 1998. Thus, our research complements this previous work and makes an important contribution to knowledge. Zanakis et al. recognised that their study was preliminary and that further additional multi-country studies in global efficient strategies for combating HIV/AIDS were needed. As emphasised by Harling et al. [8], establishing multi-country comparative analyses on the use, cost and outcome of HIV prevention services, especially in middle and lower income countries, is critical to fill some of the large gaps which exist in the scientific literature on HIV interventions in these countries. These gaps have limited the ability for the existing literature to guide policy makers in those settings where the epidemic is most intense. As pointed out by Harling et al. [8: 372] “increased research in such settings and dissemination of their findings is urgently required, especially given the need for intensified prevention strategies to complement the scaling up of HIV treatment and care services in these countries.”
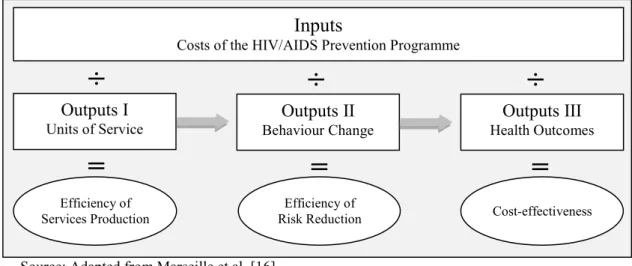
The framework proposed to assess the efficiency of mother-to-child HIV prevention and to contribute to the extant literature, draws on the principles of the Prevent AIDS Network for Cost-Effectiveness Analysis (PANCEA) approach [16]. PANCEA is a five-country study, funded by the U.S. National Institute of
Health, aimed at providing information for an improved allocation of HIV prevention funds in low- and middle-income countries. In particular, the PANCEA approach is designed to generate three indicators of efficiency for each prevention programme: cost per unit of service provided, cost per reduction in risky behaviours, and cost per HIV infection prevented. Figure 1 illustrates how these indicators build on each other.
Source: Adapted from Marseille et al. [16].
Figure 1. The PANCEA Conceptual Framework
The first indicator of efficiency measures the cost per unit of service provided by a particular programme or intervention (e.g. cost per pregnant woman who received voluntary counselling and testing). The second indicator of efficiency assesses the cost of reducing risky behaviours (e.g. cost per newly protected sex episode). The third indicator measures the cost effectiveness of the programme by comparing its costs with the outcomes achieved (e.g. cost per HIV infection averted).
The analysis we discuss in this paper focuses essentially on the Efficiency of Services Provision regarding mother-to-child HIV prevention. In spite of its limited scope, it can provide essential information for an improved allocation of HIV prevention funds as there is compelling evidence showing that the three indicators above are strongly linked. In particular, behavioural evaluations have
Inputs
Costs of the HIV/AIDS Prevention Programme
Outputs I Units of Service Outputs II Behaviour Change Outputs III Health Outcomes Efficiency of Services Production Efficiency of
Risk Reduction Cost-effectiveness
÷
÷
÷
shown that the more units of service provided the lower the risky behaviours tend to be. Epidemic modelling has shown, in turn, that a reduction in behavioural risk contributes to reducing HIV transmission. Therefore, it seems reasonable to assume that by comparing the efficiency of service provision across countries and identifying the best performers, we are able to identify those countries that are most likely using the resources in a more effective way. This is, however, the subject of further research. Given that our study focuses on the efficiency of nations in implementing a particular prevention programme whilst the PANCEA project focuses on the efficiency of particular programmes when compared with alternative interventions, we believe that these two approaches can, together, provide a richer understanding of efficiency in HIV prevention and, consequently, a better foundation for policy recommendations.
3. Empirical Analysis
3.1. The DEA Model
The choice of appropriate input and output variables is a fundamental step in DEA analysis. Whilst several input indicators may be used in this context, the costs of running mother-to-child HIV prevention interventions is, perhaps, the most relevant. These costs are usually grouped into three major categories: personnel expenses (e.g. salaries and other compensation paid to the personnel involved in the prevention programme), other recurrent goods and services expenses (e.g. medicines, laboratory tests, supplies, office and administrative expenses, and utilities), and capital expenses (e.g. medical equipment, furniture, vehicles, computers, and buildings). In this research we use the variable “Prevention of mother-to-child HIV transmission domestic spending from public and international financing sources (million US$)” as the only controllable input.
The resources allocated to PMTCT can have several uses as various interventions are usually developed as part of the core response to achieve this objective. The
choice of the most appropriate outputs should, therefore, aim to include in the DEA model those outputs thought to have the greatest potential to reduce mother-to-child HIV transmission. Taking this principle into account, the model we propose has four main outputs, which follow.
The first output variable in our model is the “Reported number of pregnant women tested for HIV”. As identified by the Joint United Nations Programme on HIV/AIDS [31], voluntary counselling and testing are an essential part of any PMTCT strategy. HIV testing is critical because pregnant women who do not know they are HIV positive cannot benefit from appropriate prevention interventions. The protective benefit of antiretroviral drugs is diminished when babies continue to be exposed to HIV through breastfeeding, therefore, HIV positive mothers are advised not to breastfeed whenever they have safe, affordable alternatives to breastfeeding. HIV testing and counselling also offer significant opportunities to provide important advice to HIV positive mothers on the risks and benefits of different infant feed options. This allows them to make better informed decisions about the most suitable options and, ultimately, contributes to lower mother-to-child HIV transmission. In addition, when testing is carried out and post-test counselling is given, valuable information and support is also passed to women not infected to ensure the avoidance of future infection.
The second output variable is the “Number of pregnant women living with HIV who received antiretrovirals for preventing mother-to-child transmission”. The administration of antiretroviral drugs to pregnant women decreases the viral load in the mother and is highly effective at preventing mother-to-child transmission (see, for example, Bryson [32]). Pregnant women who are HIV positive are usually advised to begin antiretroviral treatment either immediately or after the first trimester. Under the 2010 World Health Organization guidelines, all HIV positive mothers identified during pregnancy should receive an extensive course of antiretroviral drugs to prevent mother-to-child transmission.
In order to lower the risk of transmission even further and/or reduce HIV-related morbidity and mortality, it is important, that newborn babies who have been exposed to the virus, are also given a course of prophylactic treatment for the first
few days or weeks with antiretrovirals and/or co-trimoxazole, respectively. Co-trimoxazole is a widely available antibiotic that substantially reduces HIV-related morbidity and mortality in both adults and children. As pointed out by Zachariah et al. [33: 686], “prophylaxis with co-trimoxazole is a recommended intervention of proven benefit that could serve not only as an initial step towards improving paediatric care in young children with limited access to antiretroviral treatment, but also as an important complement to antiretroviral therapy in resource-limited settings”. Marseille et al. [34] have also provided evidence, more than a decade ago, suggesting that the administration of antiretrovirals to mothers and babies just before and soon after birth has a major potential impact on reducing vertical HIV transmission. In order to account for these factors, we included in our DEA model the following output variables: “Reported number of infants born to women living with HIV receiving antiretrovirals for preventing mother-to-child transmission” (i.e. Output 3) and “Reported number of infants born to women living with HIV receiving co-trimoxazole prophylaxis within two months of birth” (i.e. Output 4).
In a comparative analysis of countries battling the HIV/AIDS epidemic it is also important to bear in mind that there are socio-cultural, political and economic factors (i.e. exogenous conditions) not directly controllable by the prevention authorities that can explain differences in efficiency and ultimately help understand the development of the epidemic within each country. Consequently, it is important to include in the analysis nondiscretionary variables (inputs and/or outputs) that will assure comparable technologies. According to Quinn [35], to control AIDS, countries must not only promote changes in individual behaviour but also address socio-economic issues. In fact, considerable HIV/AIDS differences among nations have been attributed to exogenous conditions like nation’s wealth, migration from rural to urban areas, education, access to health services and drug use. For example, Zanakis et al. [28], in exploring the effects that socio-economic factors have on the development of the HIV/AIDS epidemic, found evidence that countries with lower population density that manage to provide better health system performance, per capita support and better media information, without necessarily higher GNP, are more likely to exhibit lower HIV/AIDS indicators.
In the particular case of mother-to-child HIV transmission, several factors including education, degree of urbanization and access to health services have also been shown to impact the capacity of families to comply with prevention programmes.
It is acknowledged that good quality HIV/AIDS education and knowledge regarding mother-to-child-HIV transmission are fundamental to eliminating myths and misunderstandings, and to counter stigma and discrimination against pregnant women. It is likely that in countries with lower literacy rates, pregnant women will be less willing to carry out voluntary testing and counselling for HIV, which might result in poorer efficiency results when compared with nations with higher literacy rates. To account for this non-controllable factor, and allow fairer comparisons, we decided to include a proxy variable to capture the level of education in the population. We have used the variable “People aged 15 years and older who can, with understanding, both read and write a short simple statement on their everyday life (millions)”. This variable resulted from the product of the literacy rate of each country and the respective population aged 15 years and older.
Easy access to health facilities is also an important motivator for mothers to adhere to prevention programmes. In particular, there is evidence suggesting that in rural areas health care facilities are less accessible, and therefore, that pregnant women living in these areas are at higher risk of not complying with PMTCT programmes (e.g. Jones et al. [36]). In order to account for this factor we have included in our DEA model the variable “People living in urban areas (millions)”. This is an important variable to consider as the degree of urbanization also seems to have a significant impact on awareness among pregnant women regarding AIDS, HIV transmission and prevention methods. As pointed out by Msellati [37], when referring to mothers’ access to PMTCT programmes in West Africa, the level of knowledge about the HIV/AIDS epidemic can be considered good in urban areas but worse in rural areas. Increased awareness by pregnant women is important as it improves their compliance with programmes targeted at preventing mother-to-child HIV transmission.
In addition to the socio-economic factors previously discussed, it is also known that weak health infrastructures exacerbate the impacts of the HIV/AIDS epidemic. As suggested by Coovadia and Hadingham [38] one of the major reasons for the apparent ineffectiveness of global interventions in battling the HIV/AIDS epidemic is the structural weaknesses in the health systems of underdeveloped countries, which contribute to bottlenecks in the distribution and utilisation of funds. As pointed out by these authors, robust health care systems play a critical role in channelling globally recognised prevention and treatment best practice for the mitigation of HIV/AIDS. It is important to bear in mind that investment in health infrastructures and in health care professionals can improve care provision, not only through improved detection and monitoring of HIV positive people but also through treatment of co-morbidities and nutritional support (Little et al. [39]). In order to account for this factor we have used the proxy variable “Total health expenditure (million US$)”. This variable is the sum of public and private health expenditure and it covers the provision of health services (preventive and curative), family planning activities, nutrition activities and emergency aid.
Finally, we decided to include a variable to account for political factors. There is evidence suggesting that political instability can undermine maternal and child health services (e.g. de Castella [40]) and compromise adherence to programmes targeted at preventing mother-to-child HIV transmission. Unstable governments tend to put HIV prevention at the bottom of their political agenda. In order to account for this factor and carry out a fairer comparison of countries, we have used the variable “Political stability and absence of violence/terrorism” as a non-controllable input in our model. This variable is from the Worldwide Governance Indicators (Kaufmann et al., [41]) and it reflects the compilation of responses on the quality of governance given by a large number of enterprise, citizen and expert survey respondents in industrial and developing countries. Considering that this variable ranges from approximately -2.5 (weak) to 2.5 (strong) governance performance, a transformation was undertaken in order to ensure that no negative values were present. Following Ali and Seiford [42], this input was transformed using the following expression:
X
io=
abs
(
Min
X
ij)
+
X
io+
c
~
expression, Xio ~
is the transformed value for input i of DMU0 and Xij is the
original value of input i for DMUj, Xio is the original value for input i of DMU0
and c is a constant.
In summary, the DEA model we propose to assess the efficiency of mother-to-child-HIV transmission interventions and which was developed based on the literature review and on the discussion presented above, is the one presented in Table 1:
Table 1: DEA model to assess efficiency of mother-to-child HIV transmission prevention
Inputs Outputs
Discretionary:
• Input 1: Prevention of mother-to-child HIV transmission domestic spending from public and international financing sources (million US$).
Non-discretionary:
• Input 2: People aged 15 years and older who can, with understanding, both read and write a short simple statement on their everyday life (millions);
• Input 3: People living in urban areas (millions);
• Input 4: Total health expenditure (million US$);
• Input 5: Political stability and absence of violence/terrorism.
• Output 1: Reported number of pregnant women tested for HIV;
• Output 2: Number of pregnant women living with HIV who received antiretrovirals for preventing mother-to-child transmission;
• Output 3: Reported number of infants born to women living with HIV receiving antiretrovirals for preventing mother-to-child transmission;
• Output 4: Reported number of infants born to women living with HIV receiving co-trimoxazole prophylaxis within two months of birth.
It is important to point out that a sequential production process may be in place here, rather than a simultaneous one, given that women must first be tested, and only afterwards can the other services be offered. However, considering that the available data does not allow distinction between the money that is spent on testing and that spent on targeted medication, it is important to include both types of outputs in the model. The DEA assumption of trade-offs between the output
variables is still applicable in this context, as certain countries may choose, at first, to spend most of the money on developing programmes to reach women for opportunistic testing. Other countries, which may already have in place effective testing programmes may choose to spend more money on providing targeted medication. In the future, if disaggregated data is available regarding the resources used for HIV testing and the resources used for targeted medication, it may be interesting to analyse the efficiency of each of these production stages as well as the effectiveness of the programmes in order to assess the impact of the services delivered.
3.2. Data and Efficiency Results
The data used in this study refers to the activity of 52 low- and middle-income countries regarding mother-to-child HIV prevention in 2008. As previously discussed, PMTCT programmes in developed countries have almost eliminated vertical HIV transmission. However, progress in low- and middle-income countries has been slow, and therefore, it is fundamental to compare prevention programmes in these countries in order to identify best practice. Whilst lack of availability of data prevented us from considering all low- and middle-income countries in the analysis, we believe that the 52 nations assessed are reflective of the problems faced by many other low- and middle-income countries worldwide regarding mother-to-child HIV prevention. Our sample includes countries belonging to various geographic regions. In particular, it includes 27 countries from sub-Saharan Africa, 6 from East, South and South-East Asia, 9 from Europe and Central Asia and 10 from Latin America and the Caribbean. Of these, 28 are low-income countries and 24 are middle-income countries. Our sample also includes countries with various HIV epidemic levels. In 26 of the countries assessed the epidemic is considered concentrated, in 22 it is considered generalised and in 4 it is considered low.
The data used in our analysis was collected from a variety of international public sources including the Joint United Nations Program for HIV/AIDS, United Nations Development Program, World Health Organization and World Bank.
Although these are trustworthy sources, some of the information they provide is supplied by each individual country. Considering that some of these countries have very poor statistics, the analysis that follows has to be interpreted with caution.
Table 2 presents a descriptive summary of the data for the 52 countries considered in the analysis.
Table 2 - Summary statistics for the variables used in the study
Spending in prevention (106 US$) Literate population (millions) Urban population (millions) Spending in health care (106 US$) Political stability index Pregnant women tested Pregnant women that received antiretrovirals Infants that received antiretrovirals Infants that received prophylactic treatment Input 1 Input 2 Input 3 Input 4 Input 5 Output 1 Output 2 Output 3 Output 4 Low-income countries Average 2.59 29.29 19.80 2959.79 1.39 340155 7486 5404 1643 St Dev 5.97 103.50 63.68 10167.21 0.78 793671 14925 10844 4270 Max 29.33 551.00 336.75 53485.00 2.42 4234401 59601 41253 21841 Min 0.00 0.08 0.10 15.00 0.01 6281 15 11 0 Middle-income countries Average 2.75 30.28 28.77 24007.08 1.68 361629 2635 2379 947 St Dev 3.47 45.48 44.03 49086.92 0.61 553201 3742 3465 2271 Max 13.90 157.71 163.92 195414.00 3.01 2381280 11971 10308 8315 Min 0.00 0.35 0.26 124.00 0.24 5335 6 0 0 Total Average 2.67 29.74 23.94 12674.92 1.52 350066 5247 4008 1322 St Dev 4.93 81.27 55.15 35406.58 0.71 686742 11411 8366 3479 Max 29.33 551.00 336.75 195414.00 3.01 4234401 59601 41253 21841 Min 0.001 0.08 0.10 15 0.01 5335 6 0 0
From this table, one can see that there are considerable discrepancies across countries. For example, whilst the average spending on prevention of mother-to-child HIV transmission is approximately US$2.7 million per country, some have spent considerably more than others. For instance, Sao Tome and Principe reports the lowest annual spending on this prevention programme (US$1,035), whilst Kenya the highest (US$29.3 million). From another angle, we can see that the estimated number of people aged 15 years and older who can, with understanding, both read and write is also highly variable between nations. This is explained in part by the fact that some countries like India are highly populated compared to other, small, countries (e.g. Sao Tome and Principle). Total health expenditure,
political stability and urbanization are also highly variable as can be seen from Table 2.
Considering that there are remarkable discrepancies at the level of the inputs, it is not surprising that these will also exist at the outputs level. As shown in Table 2, the number of pregnant women tested for HIV and the number found to be HIV-positive and receiving antiretroviral therapy also varies considerably among the 52 nations in our sample. The same applies to the number of infants receiving antiretrovirals and/or co-trimoxazole. In this particular case, it is important to mention that the zero value, shown as the minimum, indicates that the countries are not providing these medicines to infants or, most likely, that data were not reported, and therefore, it was assumed as being zero. Given that there is no consensus in the DEA literature on how best to handle the issue of missing data, that the model we propose has several outputs, and that no weight restrictions are imposed on the outputs, we decided to adopt the approach proposed by Kuosmanen [43], who suggests replacing missing outputs by zero. This ensures that countries with no data available do not benefit in the performance assessment in relation to their counterparts. Furthermore, this approach does not bias the calculation of the efficient frontier as long as the countries with the missing data are inefficient, even if these data had been reported correctly. However, this approach, like alternative approaches, also has its own limitations. In particular, in can impact the DEA results in two ways. Firstly, it may bias the efficient frontier if the countries with the missing data would have been efficient had the missing data been reported correctly. Secondly, it may bias the efficiency scores for the countries who fail to report the data, because it may make them appear less efficient than they actually are.
In order to assess each nation’s efficiency, we have used the PIM DEA software [44] and a DEA model with output orientation. This is justified by reasoning that countries should aim to increase the level of service provision, given spending on prevention and in health care in general, the population’s education, the degree of urbanization and the level of political stability observed. Furthermore, we have used an assumption of variable returns to scale (VRS), as proposed by Banker et al. [18]. According to Marseille et al. [45] the assumption of constant unit costs in
the context of HIV prevention may result in substantial inaccuracies as they found compelling evidence that efficiency increased (unit costs decreased) with scale, across all countries and interventions examined. Brandeau et al. [5] and Brandeau and Zaric [46], also discuss the issue of scale in HIV prevention programmes, pointing out that the relationship between investment in HIV prevention and HIV infections averted may not be linear, which indicates that increased spending on a prevention programme may not always be cost effective. Our choice of a VRS assumption is also consistent with the publication of Hollingsworth and Smith [47], which warns that when ratios are used, as is the case of the variable political stability, the BCC formulation [18] should be adopted. We have also used a weight restriction on the input side, in order to prevent countries from attributing a null weight to the variable related to spending on PMTCT. This restriction imposes that the sum of the virtual weights given by each country to the non-controllable inputs cannot exceed the virtual weight given to the non-controllable input. The development of this virtual weight restriction follows the approach proposed by Sarrico and Dyson [48]. Please refer to the appendix for more details on the DEA model used.
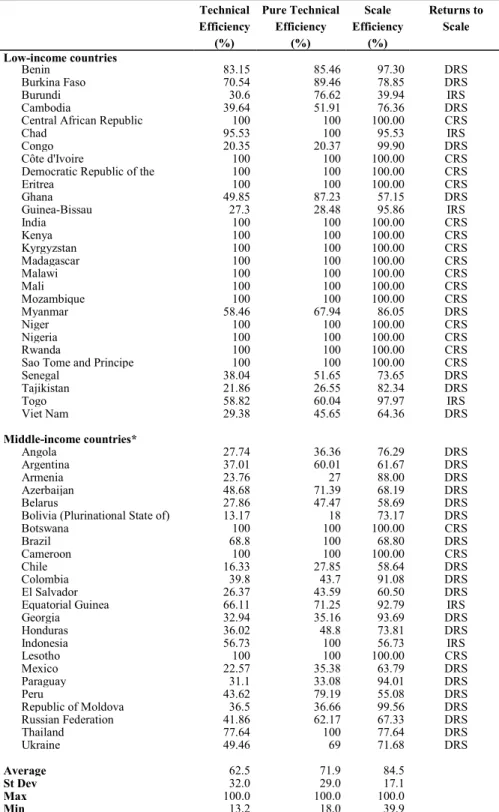
Table 3 presents the preliminary results from the DEA model discussed above. It presents the efficiency scores for each one of the 52 countries during 2008 as well as the returns to scale for each country.
Due to the exploratory nature of this research and the limitations of the data, caution needs to be taken when we analyse these results. In spite of this, the results shown on Table 3 corroborate some previous findings reported in the literature and highlight some relevant aspects about the efficiency of each country in preventing mother-to-child HIV transmissions.
Table 3: Countries efficiency scores for 2008 Technical Efficiency (%) Pure Technical Efficiency (%) Scale Efficiency (%) Returns to Scale Low-income countries Benin 83.15 85.46 97.30 DRS Burkina Faso 70.54 89.46 78.85 DRS Burundi 30.6 76.62 39.94 IRS Cambodia 39.64 51.91 76.36 DRS
Central African Republic 100 100 100.00 CRS
Chad 95.53 100 95.53 IRS
Congo 20.35 20.37 99.90 DRS
Côte d'Ivoire 100 100 100.00 CRS
Democratic Republic of the 100 100 100.00 CRS
Eritrea 100 100 100.00 CRS Ghana 49.85 87.23 57.15 DRS Guinea-Bissau 27.3 28.48 95.86 IRS India 100 100 100.00 CRS Kenya 100 100 100.00 CRS Kyrgyzstan 100 100 100.00 CRS Madagascar 100 100 100.00 CRS Malawi 100 100 100.00 CRS Mali 100 100 100.00 CRS Mozambique 100 100 100.00 CRS Myanmar 58.46 67.94 86.05 DRS Niger 100 100 100.00 CRS Nigeria 100 100 100.00 CRS Rwanda 100 100 100.00 CRS
Sao Tome and Principe 100 100 100.00 CRS
Senegal 38.04 51.65 73.65 DRS Tajikistan 21.86 26.55 82.34 DRS Togo 58.82 60.04 97.97 IRS Viet Nam 29.38 45.65 64.36 DRS Middle-income countries* Angola 27.74 36.36 76.29 DRS Argentina 37.01 60.01 61.67 DRS Armenia 23.76 27 88.00 DRS Azerbaijan 48.68 71.39 68.19 DRS Belarus 27.86 47.47 58.69 DRS
Bolivia (Plurinational State of) 13.17 18 73.17 DRS
Botswana 100 100 100.00 CRS Brazil 68.8 100 68.80 DRS Cameroon 100 100 100.00 CRS Chile 16.33 27.85 58.64 DRS Colombia 39.8 43.7 91.08 DRS El Salvador 26.37 43.59 60.50 DRS
Equatorial Guinea 66.11 71.25 92.79 IRS
Georgia 32.94 35.16 93.69 DRS Honduras 36.02 48.8 73.81 DRS Indonesia 56.73 100 56.73 IRS Lesotho 100 100 100.00 CRS Mexico 22.57 35.38 63.79 DRS Paraguay 31.1 33.08 94.01 DRS Peru 43.62 79.19 55.08 DRS Republic of Moldova 36.5 36.66 99.56 DRS Russian Federation 41.86 62.17 67.33 DRS Thailand 77.64 100 77.64 DRS Ukraine 49.46 69 71.68 DRS Average 62.5 71.9 84.5 St Dev 32.0 29.0 17.1 Max 100.0 100.0 100.0 Min 13.2 18.0 39.9
Note: IRS=increasing returns to scale; CRS=constant returns to scale; DRS=decreasing returns to scale. *Includes lower-middle income and upper-middle income countries.
As can be seen from Table 3, we have broken down the technical efficiency score into pure technical efficiency and scale efficiency. In 2008, the average total efficiency score of the 52 countries was only 62.5%, with a standard deviation of approximately 32.0%, which indicates that there are considerable differences between countries and remarkable potential for improvement in some of them. In our study, the spending on preventing vertical transmission of HIV is classified CRS efficient in eighteen countries: Botswana, Cameroon, Central African Republic, Côte d’Ivoire, Democratic Republic of the Congo, Eritrea, India, Kenya, Kyrgyzstan, Lesotho, Madagascar, Malawi, Mali, Mozambique, Niger, Nigeria, Rwanda and Sao Tome and Principe. When we allow VRS, which seems to be a more appropriate assumption to adopt in this context, as explained previously, the average efficiency score increases to 71.9% and the number of efficient countries increases to twenty two. This means that we have only four countries (Brazil, Chad, Indonesia and Thailand) that are technically efficient while operating under sub-optimal scale sizes. Chad and Indonesia seem to operate under increasing returns to scale (IRS), which suggests that a bigger scale of operation would lead to a greater ratio of outputs over inputs. Brazil and Thailand seem to operate under decreasing returns to scale (DRS). In fact, with regard to most of the countries that are technically inefficient, the DEA results suggest that they operate under DRS, indicating that they could benefit from decreasing their size of operation. These results seem to counter the findings of Marseille et al. [45], who found evidence that efficiency increased with scale. The only countries which could benefit from operating at a higher scale are, according to the results in Table 3, Burundi, Chad, Equatorial Guinea, Guinea-Bissau, Indonesia and Togo. Whilst scale seems to play an important role in the efficiency of some countries (e.g. Burundi, Ghana, Indonesia and Thailand), others (e.g. Benin, Congo, Georgia, Guinea-Bissau, Republic of Moldova and Togo) could benefit mostly from a better use of the resources allocated to preventing mother-to-child HIV transmission, whilst maintaining their size of operation.
In analysing the efficiency results it is also important to identify the optimal weight structure chosen by each country. Despite the fact that the DEA model may yield alternative optimal solutions for the weights of the countries classified as efficient (Cooper et al. [49]), the different optimal weights identified can
provide useful information. For instance, the different optimal output weight profiles are useful to identify different service delivery strategies. Table 4 illustrates some of these different strategies.
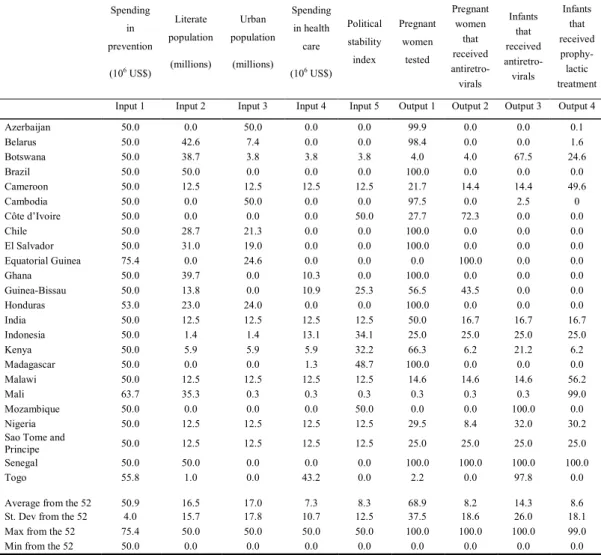
Table 4: Virtual weights attributed to the variables by some of the countries (%)
Spending in prevention (106 US$) Literate population (millions) Urban population (millions) Spending in health care (106 US$) Political stability index Pregnant women tested Pregnant women that received antiretro-virals Infants that received antiretro-virals Infants that received prophy-lactic treatment Input 1 Input 2 Input 3 Input 4 Input 5 Output 1 Output 2 Output 3 Output 4 Azerbaijan 50.0 0.0 50.0 0.0 0.0 99.9 0.0 0.0 0.1 Belarus 50.0 42.6 7.4 0.0 0.0 98.4 0.0 0.0 1.6 Botswana 50.0 38.7 3.8 3.8 3.8 4.0 4.0 67.5 24.6 Brazil 50.0 50.0 0.0 0.0 0.0 100.0 0.0 0.0 0.0 Cameroon 50.0 12.5 12.5 12.5 12.5 21.7 14.4 14.4 49.6 Cambodia 50.0 0.0 50.0 0.0 0.0 97.5 0.0 2.5 0 Côte d’Ivoire 50.0 0.0 0.0 0.0 50.0 27.7 72.3 0.0 0.0 Chile 50.0 28.7 21.3 0.0 0.0 100.0 0.0 0.0 0.0 El Salvador 50.0 31.0 19.0 0.0 0.0 100.0 0.0 0.0 0.0 Equatorial Guinea 75.4 0.0 24.6 0.0 0.0 0.0 100.0 0.0 0.0 Ghana 50.0 39.7 0.0 10.3 0.0 100.0 0.0 0.0 0.0 Guinea-Bissau 50.0 13.8 0.0 10.9 25.3 56.5 43.5 0.0 0.0 Honduras 53.0 23.0 24.0 0.0 0.0 100.0 0.0 0.0 0.0 India 50.0 12.5 12.5 12.5 12.5 50.0 16.7 16.7 16.7 Indonesia 50.0 1.4 1.4 13.1 34.1 25.0 25.0 25.0 25.0 Kenya 50.0 5.9 5.9 5.9 32.2 66.3 6.2 21.2 6.2 Madagascar 50.0 0.0 0.0 1.3 48.7 100.0 0.0 0.0 0.0 Malawi 50.0 12.5 12.5 12.5 12.5 14.6 14.6 14.6 56.2 Mali 63.7 35.3 0.3 0.3 0.3 0.3 0.3 0.3 99.0 Mozambique 50.0 0.0 0.0 0.0 50.0 0.0 0.0 100.0 0.0 Nigeria 50.0 12.5 12.5 12.5 12.5 29.5 8.4 32.0 30.2 Sao Tome and
Principe 50.0 12.5 12.5 12.5 12.5 25.0 25.0 25.0 25.0 Senegal 50.0 50.0 0.0 0.0 0.0 100.0 100.0 100.0 100.0 Togo 55.8 1.0 0.0 43.2 0.0 2.2 0.0 97.8 0.0
Average from the 52 50.9 16.5 17.0 7.3 8.3 68.9 8.2 14.3 8.6 St. Dev from the 52 4.0 15.7 17.8 10.7 12.5 37.5 18.6 26.0 18.1 Max from the 52 75.4 50.0 50.0 50.0 50.0 100.0 100.0 100.0 99.0 Min from the 52 50.0 0.0 0.0 0.0 0.0 0.0 0.0 0.0 0.0
Note: The input weights of the countries classified as inefficient have been standardised to add to 100%, in order to allow for easier interpretation.
As shown in Table 4, several different output weight profiles can be identified. Whilst some countries placed all the output weight in one of the outputs (e.g. Brazil, Equatorial Guinea, Mozambique), other countries distributed the weights between several or all outputs (e.g. Botswana, Cameroon, Kenya, Nigeria). The analysis of the results for the 52 countries shows that a large number of countries (i.e. 18 countries) have placed all the output weight on the output variable: “Reported number of pregnant women tested for HIV”. Brazil and Madagascar
are two examples of these countries: they have been classified as efficient, and placed 100% of the output weight on this output. A minority of countries also present an unbalanced profile of output weights, by placing all their weight on one of the other three outputs. For example, whilst Equatorial Guinea has put all its output weight on the variable “Number of pregnant women living with HIV who received antiretrovirals for preventing mother-to-child transmission”, Mozambique has placed all its output weight on the variable “Reported number of infants born to women living with HIV receiving antiretrovirals for preventing mother-to-child transmission”. Contrasting with this, we find four countries classified as efficient (Central African Republic, Chad, Indonesia and Sao Tome and Principe) that present a totally balanced weight profile regarding service provision, giving 25% of the weight to each output. The remaining countries present weights unequally distributed between two, three or all outputs.
Table 4 shows that different input weight profiles can also be identified. At this stage it is important to recall that virtual weight restrictions were imposed to prevent countries from attributing less than 50% of the total input weight to the total spending on prevention of HIV transmission from mother-to-child. It is possible to verify that the weight attributed to this input varies between 50% and 75.4%, with the large majority of countries attributing the minimum weight required. The remaining part of the input weight is distributed between the four environmental variables which account for socio-cultural, political and economic factors. In this respect, it is possible to find different weight profiles within these environmental variables, suggesting that some countries share some socio-cultural, political or economic commonalities. For example, Cameroon, India, Malawi, Nigeria, and San Tome and Principe distribute the environmental input weight evenly between the four variables. Opposite to this, some countries place all their environmental weight on a single variable. For example, Senegal and Brazil place all their environmental weight on the input capturing the literacy rate, whilst Azerbaijan and Cambodia place all their environmental weight on the number of people living in urban areas. As expected, countries with considerable social and political unrest, such as Chad, Democratic Republic of Congo, Côte d’Ivoire, Central African Republic and Colombia, place a considerable amount of weight on the input capturing this aspect.
Another interesting piece of information provided by DEA relates to the identification of benchmarks for each of the inefficient countries. Benchmarks are units that are classified as efficient when applying the optimal weight structure of the inefficient units under analysis. For example, as illustrated on Table 5, Honduras and El Salvador, two neighbouring countries who share several socio-cultural and economic commonalities, have similar sets of benchmarks for learning. These two countries were classified with below average efficiency rates suggesting great potential for improvement in this context. On one side, Honduras achieved 48.8% in terms of pure technical efficiency and its benchmarks for learning are Côte d’Ivoire, Niger, Madagascar and Malawi. On the other side, El Salvador achieved 43.59% in terms of pure technical efficiency and its benchmarks for learning are Côte d’Ivoire, Niger and Madagascar. In developing their strategies, policies and programmes for HIV prevention, Honduras and El Salvador can get inspiration from the policies and strategies developed by Côte d’Ivoire, Niger and Madagascar. These countries were identified as benchmarks for Honduras and El Salvador because they share commonalities in their social and economic structures, suggesting that similar policies can be effective in fighting vertical transmission of HIV. Honduras and El Salvador are two countries characterised by a high percentage of the population living in rural areas, below average literacy rates, low rates of contraception usage and high rates of teenage pregnancies, combined with fragmented, inefficient and inequitable health care systems which limit the access to services (World Health Organization [50, 51]). With specific relevance to the context of HIV prevention is the fact that these two countries have low coverage of family planning and low pre-natal, childbirth and post-natal care, as well as deficient training in public health, resulting in low levels of maternal education (World Health Organization [50, 51]). If we inspect the optimal input weight structure of Honduras and El Salvador, we can confirm that these two countries distribute all their environmental weight between the variable capturing literacy rate and the variable measuring urban population. From another side, if we inspect the output weight structure of these countries, we conclude that all the output weight was put on the number of women tested for HIV. This means that, even with deficient coverage, this is the service in which
these countries appear to be focusing. Their relative performance in terms of the other three outputs (related with access to targeted medication) is even worse.
If we inspect the strategies, policies and programmes developed by their benchmark countries, we can get inspiration for improvement in Honduras and El Salvador HIV prevention systems. Côte d’Ivoire, Niger and Madagascar (the three common countries which are benchmarks for Honduras and El Salvador) are also characterised by a high level of rural population and low literacy rate, resulting in challenges regarding access to ante-natal care (World Health Organization [52]). However, these three countries have developed inspiring policies and programmes to address these challenges. Due to the effectiveness of these programmes, steady progress has been achieved in terms of PMTCT (especially in terms of HIV testing). These good results allowed them to be identified by our DEA model as robust best practice examples. These policies and programmes have in common the focus on improving health coverage through the involvement of several actors in the health sector and the community. In these countries, innovative programmes were developed to address existing inequalities in access to services, such as the ‘mother and child health week’ introduced in Madagascar in October 2007 which provides an opportunity for female HIV testing throughout the country (UNICEF [53]). Examples of other strategies and innovative programmes are discussed in detail in the next section.
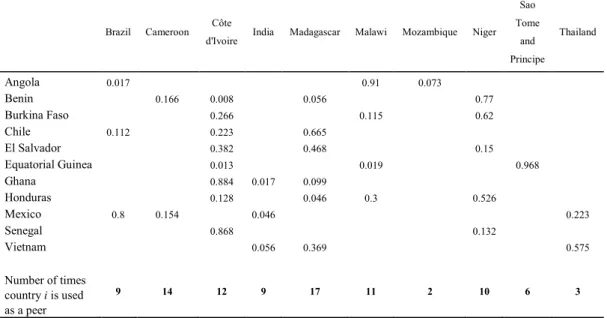
In addition to the information regarding the benchmarks from which the inefficient countries can learn, Table 5 also provides useful information to define the targets to be achieved by these countries. This information is contained in the lambda values displayed in each of the rows of Table 5. For example, the values of the lambdas associated with El Salvador (i.e. 0.382, 0.468 and 0.15) represent the proportion of the service levels of Cote d’Ivoire, Madagascar and Niger that El Salvador is required to achieve to become efficient.
Table 5: Peers and lambdas for some countries
Brazil Cameroon Côte
d'Ivoire India Madagascar Malawi Mozambique Niger Sao Tome and Principe Thailand Angola 0.017 0.91 0.073 Benin 0.166 0.008 0.056 0.77 Burkina Faso 0.266 0.115 0.62 Chile 0.112 0.223 0.665 El Salvador 0.382 0.468 0.15 Equatorial Guinea 0.013 0.019 0.968 Ghana 0.884 0.017 0.099 Honduras 0.128 0.046 0.3 0.526 Mexico 0.8 0.154 0.046 0.223 Senegal 0.868 0.132 Vietnam 0.056 0.369 0.575 Number of times country i is used as a peer 9 14 12 9 17 11 2 10 6 3
Whilst some countries serve as benchmarks for a large number of countries, others are classified as efficient but do not serve as a reference for other countries. From the 52 countries compared, Botswana, Chad, Democratic Republic of the Congo, Indonesia, Kenya, Lesotho, Mali, Nigeria and Rwanda have been classified as efficient but do not serve as references to any other country. These countries have chosen very peculiar weight structures, which means that they have been classified as efficient because there are no other countries to which they can be compared. In contrast, as presented in Table 5, there are five countries that serve as benchmarks to 10 or more countries, presenting robust efficiency status. These countries are: Madagascar, Cameroon, Côte d’Ivoire, Malawi and Niger. These results indicate that the policies and service delivery strategies used by these countries should be identified in order to provide guidance for other countries. We will now discuss some of these strategies.
3.3. The practical and policy implications of the results
Despite the exploratory nature of this research and data limitations, some important lessons can be derived from the results previously discussed. In particular, the results highlight that there is considerable potential to save the lives of thousands of children each year by improving PMTCT services across countries. In addition, the results constitute a valuable source of information to
policy makers, programme planners, managers, and implementers. By identifying best practices, the study points out those countries whose HIV prevention strategies ought to be investigated in order to develop sound strategies that can be replicated in those nations where HIV prevention strategies have been less successful.
Two of the countries that represent important learning peers for other nations are Cameroon and Côte D’Ivoire. These countries have been previously identified as important best practices in the area of PMTCT (Family Health International [54], Welty et al. [55]) and some of their service delivery strategies have been documented (Bolu et al. [56]). According to our results, together, these two countries serve as benchmarks to more than 20 of the nations assessed. Considering that the prevention programmes followed by these two countries have proven their effectiveness in battling HIV transmission from mothers to their infants, we believe that useful insights can be derived from their analysis.
Cameroon, which the DEA results indicate to be a benchmark to nations like Benin, Congo and Togo, can be an important example and inspiring model to these countries on how to reduce the incidence of HIV infection in children by involving the community in the scaling up of PMTCT services across the countries, including rural areas. By adopting a bottom-up approach Cameroon ensured the full involvement of the community and increased consensus, ownership and commitment towards successful PMTCT implementation. As identified by the AWARE-HIV/AIDS Project (Family Health International [54]), the success achieved by Cameroon is due, however, to several interrelated and complementary strategies. One of these strategies consists of using trained volunteers as community educators to help disseminate information regarding HIV/AIDS. This community education has been found to be an important forerunner of PMTCT as it is easier to provide counselling and testing to women who are knowledgeable about HIV/AIDS. Another important strategy adopted by the Cameroonian health authorities consists of the training of health workers in order to allow integration of PMTCT services in routine ante-natal care. This strategy, together with voluntary HIV counselling, an opt-out approach to HIV testing, and same day results for pregnant women in antenatal care, have
significantly increased the number of those who carry out the tests and who receive their results. This has proved fundamental in discovering the HIV status of pregnant women and assisting health care authorities to provide appropriate care to HIV-positive women and their newborns. The provision of antiretroviral therapy to HIV-positive pregnant women and the provision of counselling on infant feeding have proved critical to reduce the risk of mother-to-child transmission of HIV. Another strategy which has been fundamental in battling HIV transmission from mothers to children consists of involving local communities in service delivery through ‘trained birth attendants’ and through support groups involving HIV infected women (Wanyu [57]). This strategy has been particularly valuable and effective in the scaling up of PMTCT, by allowing psychosocial support and infant feeding counselling to reach more women in need.
These strategies have proved very effective in Cameroon, and therefore, we believe that their dissemination and replication in other countries could help them improve the efficiency and effectiveness of their prevention policies (see, for example, Msellati [31], Bolu et al. [56]). However, as demonstrated by the experience of Cameroon, for these strategies to produce the intended results it is fundamental that a clear and strong political leadership commitment exists to fight against HIV/AIDS. Furthermore, PMTCT needs to be seen as a major priority. Unless strong and available leadership gets involved early enough in the coordination of the implementation process, supervises the efforts on the ground through regular and effective monitoring and evaluation of PMTCT activities, and ensures the quality of the services provided, the strategies discussed previously are likely to fail.
The second example of a successful implementation of a PMTCT strategy is offered by Côte D’Ivoire and it illustrates how to integrate PMTCT training for health service providers in the curricula of training institutions in order to allow health care workers to take proper care of pregnant women, and in this way, battle HIV transmission from mother-to-child (Ministère de la Santé et de l’Hygiène Publique [58], Ministère de la lutte contre le SIDA [59]).
It is widely acknowledged that information, education and training are critical components of any programme targeted at preventing mother to child HIV transmission. Côte D’Ivoire has been successful in promoting these components, and therefore, the strategies adopted in this country also offer considerable scope for replication. Whilst the lessons learned from the experience of Côte D’Ivoire may be useful for many countries, we believe they are particularly relevant to those countries which the DEA analysis identified as having Côte D’Ivoire as a benchmark. These countries include, among others, Benin, Burkina Faso, Equatorial Guinea, El Salvador, Ghana, Honduras and Senegal.
Côte D’Ivoire experience, which is discussed in further detail in Family Health International [54], can help these countries develop and implement HIV sustainable PMTCT approaches grounded on a participatory process and targeted at promoting long-term quality training in health care training institutions. In fact, the process followed by Côte D’Ivoire, which consists of several steps, can work as a guide for other countries. The first step consists of carrying out a needs assessment to evaluate existing PMTCT pre-service and in-service training materials for health care workers and to determine how best to integrate PMTCT into pre-service and in-service health training curricula. Once this assessment has been conducted, good practice consists of holding a stakeholders meeting to share the findings and to create a steering committee to oversee, monitor progress and provide leadership in the development and standardisation of PMTCT in-service and pre-service training initiatives. It is then the responsibility of this steering committee to mobilise trainers and opinion leaders, to involve them in the PMTCT roll-out through a participatory process, and to sensitise them to the importance of the prevention plan and training needs. Once universities and training institutions are sensitised, the next step consists of developing PMTCT training materials for service providers. These initiatives, together with the creation of a pool of expert trainers representative of all the pre-service and in-service institutions, can assist countries in providing over the course of time a critical mass of health care professionals capable of mastering PMTCT practices throughout nations.
These two examples illustrate that DEA has strong potential to contribute to performance improvement in the context of PMTCT if used with formative purposes. By using DEA, policy makers and health care managers can identify which countries have been most successful in using the limited resources available to prevent the transmission of HIV from mothers to children. However, the identification of best practice is only the first step in the process. It is then fundamental that these practices are carefully analysed and documented in order to be disseminated and replicated.
Although our empirical analysis covers only a single year and a limited number of countries, it is important to emphasise that the results achieved still provide useful information for policy making, which can contribute to the development of programmes aimed at improving the efficiency of PMTCT.
4 – Conclusion
In spite of the remarkable progress that has been made in recent years in battling the HIV/AIDS epidemic, this disease still poses huge challenges for individuals, households and nations. It is estimated that more than 1,000 children are newly infected with HIV every day, and of these more than half will die as a result of AIDS because of a lack of access to HIV treatment [1]. Over 90 percent of the children living with HIV were infected through vertical transmission from mother to the baby during pregnancy, delivery or breastfeeding. Considering that there is compelling evidence that appropriate prevention and care can reduce the rate of these transmissions significantly, it is imperative that nations ensure that this prevention and care reaches all pregnant women and children in need and that the resources are used as efficiently as possible.
In the academic literature there have been important contributions exploring the efficiency and cost-effectiveness of different HIV prevention programmes, including mother-to-child transmission. Most of these contributions have, however, been narrowed to a small region, a single country or parts of it, and have