RESEARCH ARTICLE
A statistical model to identify determinants of
glycemic control in patients with type 2
diabetes with different pharmacotherapeutic
profiles
Artur Mendes MouraID1*, Marı´lia Antunes2,3, Sofia Oliveira Martins1, João Filipe Raposo4,5 1 Department of Social Pharmacy, Faculty of Pharmacy, University of Lisbon, Lisboa, Portugal,
2 Department of Statistics and Operational Research, Faculty of Sciences, University of Lisbon, Lisboa,
Portugal, 3 Centre of Statistics and its Applications of University of Lisbon (CEAUL), Lisboa, Portugal,
4 Department of Public Health, Nova Medical School, New University of Lisbon, Lisboa, Portugal, 5 Portuguese Diabetes Association (APDP), Lisboa, Portugal
*arturmoura@ff.ulisboa.pt
Abstract
Aim
To develop a statistical model to identify determinants of glycemic control.
Materials and methods
A database was extracted from patients’ records with at least one glycated hemoglobin (HbA1c) analysis and with antidiabetic therapy established and stabilized. A logistic regres-sion model was designed to identify the statistical significance of factors associated with gly-cemic control.
Results
Higher probability of success (HbA1c�8% [64 mmol/mol]) was found for those who were older in age, those who were men, and those with higher education levels. Increased values for the following variables were associated with the poorest glycemic control: number of years of T2DM since diagnosis, number of antidiabetic medicines, body mass index, low-density lipoprotein cholesterol, triglycerides, systolic blood pressure and number of diabetes consultations in the last twelve months. The following pharmacotherapeutic treatments were associated with glycemic control (in decreasing order of the results): oral antidiabetic drugs; oral antidiabetic drugs and insulin; insulin. Patients using metformin and a dipeptidyl peptidase-4 inhibitors have a higher probability of success than do patients using metformin and a sulfonylurea, and patients using insulin and metformin have a higher probability of success than do patients using insulin alone.
a1111111111 a1111111111 a1111111111 a1111111111 a1111111111 OPEN ACCESS
Citation: Moura AM, Antunes M, Martins SO, Raposo JF (2020) A statistical model to identify determinants of glycemic control in patients with type 2 diabetes with different pharmacotherapeutic profiles. PLoS ONE 15(7): e0235376.https://doi. org/10.1371/journal.pone.0235376
Editor: Manal S. Fawzy, Suez Canal University Faculty of Medicine, EGYPT
Received: January 24, 2020 Accepted: June 14, 2020 Published: July 6, 2020
Copyright:© 2020 Moura et al. This is an open access article distributed under the terms of the Creative Commons Attribution License, which permits unrestricted use, distribution, and reproduction in any medium, provided the original author and source are credited.
Data Availability Statement: All relevant data are within the manuscript and its Supporting Information files.
Funding: The authors received no specific funding for this work.
Competing interests: The authors have declared that no competing interests exist.
Conclusions
Sociodemographic, clinical and therapeutic parameters can strongly affect glycemic control. Studies based on real-life patient data provide important information on the development of more effective glycemic control.
Introduction
Type 2 diabetesmellitus (T2DM) is a chronic disease whose onset can be a years-long process;
moreover, T2DM can lead to multiple diabetes-related complications [1–3]. It is believed that good glycemic control is the best way to prevent diabetes complications [4]. However, 40–60% of individuals with T2DM are considered to have suboptimal glycemic control [5].
Patients with poor glycemic control who have multiple diabetes complications or who have had T2DM for many years are sometimes referred to specialized diabetes clinics, thus facilitat-ing a multifactorial approach to this complex disease [6] and usually obtaining better health results [7]. A wide range of antidiabetic medicines is available [8], and several therapeutic schemes can be prescribed to patients, including treatment with one or more noninsulin drugs, insulin in monotherapy or a combination of these two types of medicines [9].
In some cases, after a patient’s clinical and nonclinical characteristics are analyzed, glycemic control may be considered to be acceptable even with a glycated hemoglobin (HbA1c) value above that generally recommended [10]. To achieve successful glycemic control, it is impor-tant to be aware of the related determinants [11].
The aim of this study was the creation of a statistical model based on logistic regression pre-dicting the outcome of glycemic control from determinant variables, allowing for the adjust-ment of confounding effects in individuals with T2DM with stabilized antidiabetic
pharmacotherapeutic treatment (oral antidiabetic drugs [OAD]; OAD and insulin; insulin). Other objectives of this study were the model re-estimations of the following treatments: i) metformin and a sulfonylureaversus metformin and a dipeptidyl peptidase-4 (DPP-4)
inhibi-tor; and ii) insulinversus insulin and metformin.
Materials and methods
The database was extracted from informatics records of a specialized clinic in diabetes (Portu-guese Diabetes Association [APDP]). The database included the information of all patients who had at least one HbA1c laboratory analysis in 2012 (if patients had more than one analy-sis, the last one was used in the study) and who satisfied all the following criteria: i) at least one year of follow-up diabetes consultation; ii) at least one diabetes consultation in the last twelve months; and iii) antidiabetic therapy established and stabilized for at least 181 days.
The logistic regression model was designed with the objective of identifying statistically sig-nificant factors associated with glycemic control (HbA1c �8.0% [64 mmol/mol]). Age and sex were included in the model because they can be potential confounders. The education level variable was also included as a proxy for economic, social and health-related characteristics. This variable has some missing data (1694; 32.6%). However, it was included in the model because of its impact on the outcome. After these variables, other variables of the following groups were successively tested: i) diabetes characterization (age at time of T2DM diagnosis; years of T2DM since diagnosis); ii) antidiabetic pharmacological therapy (duration of current therapy; pharmacotherapeutic treatment [OAD; OAD and insulin; insulin]; number of differ-ent antidiabetic medicines); iii) laboratory parameters of renal function (glomerular filtration
rate; albuminuria); iv) anthropometric, metabolic and behavioral characteristics (body mass index [BMI]; abdominal perimeter; total cholesterol; high-density lipoprotein [HDL] choles-terol; low-density lipoprotein [LDL] cholescholes-terol; non-HDL cholescholes-terol; triglycerides; both sys-tolic and diassys-tolic blood pressure [SBP and DBP]; smoking); and v) access to health care (medication reimbursement system; number of diabetes consultations in the last twelve months). In each group of variables, multicollinearity was evaluated to prevent the high corre-lation of variables in the model.
In the process of variable selection, the following aspects were considered: i) lower p-value associated with the significance of the parameter to the variable; ii) greater reduction in the value of the statistical Akaike information criterion; and iii) absence of collinearity problems with variables included in the previous stage model.
For statistical calculations, the software R (version 3.2.0) was used.
This study obtained approval from the Ethical Committee of APDP (number 273/2013; from 8th of April). The database was received in an anonymized information format.
Results
Statistical modeling of glycemic control (HbA1c �8.0% [64 mmol/mol]);
antidiabetic pharmacotherapeutic treatment: OAD versus OAD and
insulin versus insulin
As described in the Materials and Methods section, several variables were tested during the development of the logistic regression model of glycemic control (HbA1c �8.0% [64 mmol/ mol]).Table 1includes only variables that were statistically significant as variables non-statisti-cally significant did not contribute to the statistical model.
For model estimation, 3454 cases with complete information for the study variables were included. For more patient’s details, please seeTable 2(column A).
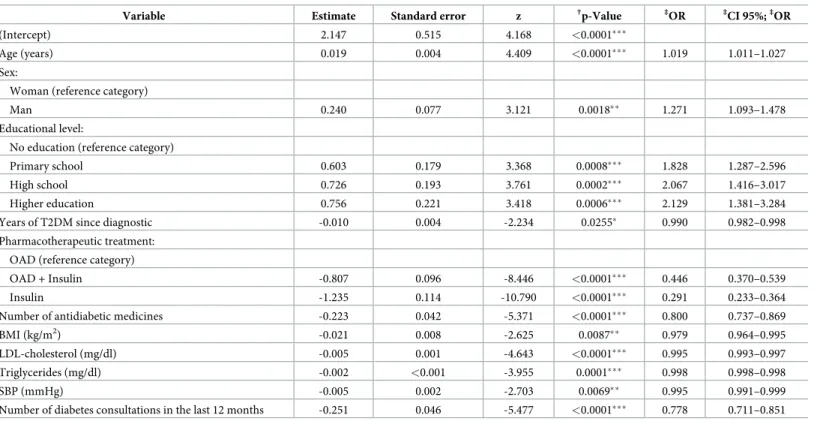
Being older in age and being a man were significantly associated with better outcomes (Table 1). Additionally, having a higher level of education is progressively more associated with better outcomes. In contrast, a lower probability of success was associated with a longer length of time with T2DM, taking more antidiabetic medicines, and having higher values of BMI, LDL-cholesterol, triglycerides and SBP. More diabetes consultations are also associated with a lower probability of success. Patients taking OAD associated with insulin or taking insu-lin only have a significantly lower probability of success than do patients taking OAD.
Model robustness
Only 44 cases (1.3%) were observed to be out of range for standardized Pearson residuals [-2;2]. Regarding the standardized deviance residuals, 7 cases (0.2%) were observed to be out of range. In relation to the diagonal values of matrix H (hat-values) and Cook distance values, only one case had high levels for both measures. This case also had a high standardized Pear-son residual. This specific case had the following characteristics: adequate glycemic control (HbA1c �8.0% [64 mmol/mol]); 61 years old; man; high school education level; 17 years of T2DM since the diagnosis; OAD associated with insulin treatment; 3 antidiabetic medicines; BMI of 36.5 kg/m2; LDL-cholesterol of 117 mg/dl; triglyceride level of 1473.5 mg/dl; SBP of 145 mmHg; and 2 diabetes consultations in the last twelve months. The exclusion of this case and the re-estimation of the model did not change the meaning of the variable’s coefficients (Table 3). In this re-estimation, no cases showed high hat-values and high Cook’s distance val-ues simultaneously. Also, with respect to standardized Pearson residuals, there were no cases that were out of range.
To test the quality of the model adjustment, the Hosmer-Lemeshow test was performed. A total of G = 10 groups were considered, and a value of H = 8.071335 (p-value = 0.4265) was obtained; hence, evidence of a lack of fit was found. According to the McFadden proposal, the pseudo-R2 (0.3909) was calculated.
With this model, the area under the curve (AUC = 0.6942) for the receiver operating char-acteristic (ROC) curve was calculated. This value is in the higher borderline range of reason-able, which is very close to the range of good.
Metformin and a sulfonylurea
versus metformin and a DPP-4 inhibitor
(HbA1c �8.0% [64 mmol/mol])
For comparison of different therapeutic treatments, the same model was applied by changing the pharmacotherapeutic treatment variable to the category metformin combined with a sulfo-nylurea and the category metformin combined with a DPP-4 inhibitor. In this model estima-tion, 284 cases were included. For more patient’s details, please seeTable 2(column B).
The dummy variable for the category metformin and a DPP-4 inhibitor presents a positive value for the coefficient estimate and a p-value <0.01 (Table 4). These results indicate that, maintaining the conditions for the other variables, patients with metformin and a DPP-4 inhibitor treatment have a higher probability of success (HbA1c �8.0% [64 mmol/mol]), with
Table 1. Summary of the statistical model for glycemic control: HbA1c �8.0% (64 mmol/mol); antidiabetic pharmacotherapeutic treatment: OADversus OAD and
insulinversus insulin.
Variable Estimate Standard error z †p-Value ‡OR ‡CI 95%;‡OR
(Intercept) 2.147 0.515 4.168 <0.0001���
Age (years) 0.019 0.004 4.409 <0.0001��� 1.019 1.011–1.027
Sex:
Woman (reference category)
Man 0.240 0.077 3.121 0.0018�� 1.271 1.093–1.478
Educational level:
No education (reference category)
Primary school 0.603 0.179 3.368 0.0008��� 1.828 1.287–2.596
High school 0.726 0.193 3.761 0.0002��� 2.067 1.416–3.017
Higher education 0.756 0.221 3.418 0.0006��� 2.129 1.381–3.284
Years of T2DM since diagnostic -0.010 0.004 -2.234 0.0255� 0.990 0.982–0.998
Pharmacotherapeutic treatment: OAD (reference category)
OAD + Insulin -0.807 0.096 -8.446 <0.0001��� 0.446 0.370–0.539
Insulin -1.235 0.114 -10.790 <0.0001��� 0.291 0.233–0.364
Number of antidiabetic medicines -0.223 0.042 -5.371 <0.0001��� 0.800 0.737–0.869
BMI (kg/m2) -0.021 0.008 -2.625 0.0087�� 0.979 0.964–0.995
LDL-cholesterol (mg/dl) -0.005 0.001 -4.643 <0.0001��� 0.995 0.993–0.997
Triglycerides (mg/dl) -0.002 <0.001 -3.955 0.0001��� 0.998 0.998–0.998
SBP (mmHg) -0.005 0.002 -2.703 0.0069�� 0.995 0.991–0.999
Number of diabetes consultations in the last 12 months -0.251 0.046 -5.477 <0.0001��� 0.778 0.711–0.851 † Significance: • p-value- <0.10 �p-value <0.05 ��p-value <0.01 ���p-value <0.001 / ‡
Odds ratio (OR) and Confidence interval (CI). https://doi.org/10.1371/journal.pone.0235376.t001
Table 2. Patients’ main characteristics for model estimation with different pharmacotherapeutic profiles.
A B C
Patients (N) 3454 284 1665
Age; average (years) 66.0 65.1 67.5
Sex
Women (%) 49.0 42.3 53.6
Time since diagnosis of T2DM; average (years) 18.6 13.3 23.1 Pharmacotherapeutic treatment A OAD (n) 967 OAD + Insulin (n) 1663 Insulin (n) 824 B Metformin + Sulphonylurea (n) 162 Metformin + DPP-4 inhibitor (n) 122 C Insulin (n) 824 Insulin + Metformin (n) 841 Glycaemic control Glycaemic controlled (n) 1777 213 759
Not glycaemic controlled (n) 1677 71 906
A (OAD / OAD + Insulin / Insulin); B (Metformin + Sulphonylurea / Metformin + DPP-4 inhibitor); C (Insulin / Insulin + Metformin).
https://doi.org/10.1371/journal.pone.0235376.t002
Table 3. Estimate and odds ratio for recalculation of the statistical model for glycemic control (HbA1c �8.0% [64 mmol/mol]) after the exclusion of one specific case.
Variable Estimate ‡OR
(Intercept) 2.149
Age (years) 0.019 1.019
Sex:
Woman (reference category)
Man 0.246 1.278
Educational level:
No education (reference category)
Primary school 0.605 1.830
High school 0.727 2.068
Higher education 0.740 2.095
Years of T2DM since diagnostic -0.010 0.990
Pharmacotherapeutic treatment: OAD (reference category)
OAD + Insulin -0.810 0.445
Insulin -1.238 0.290
Number of antidiabetic medicines -0.223 0.800
BMI (kg/m2) -0.021 0.980
LDL-cholesterol (mg/dl) -0.005 0.995
Triglycerides (mg/dl) -0.002 0.998
SBP (mmHg) -0.005 0.995
Number of diabetes consultations in the last 12 months -0.250 0.779
‡
Odds ratio (OR).
an increase of 175.3% [CI 95% 1.325;5.721], than patients with metformin and a sulfonylurea treatment. Both high school and higher education levels also have positive coefficient estimates and are statistically significant.
Insulin
versus insulin and metformin (HbA1c �8.0% [64 mmol/mol])
For the comparison of insulin therapyversus insulin and metformin therapy, the same model
was applied by changing the respective categories of pharmacotherapeutic treatment variables. In this model estimation, 1665 cases were included. For more patient’s details, please see
Table 2(column C).
The dummy variable for the category insulin and metformin treatment presents a positive value for the coefficient estimate and a p-value <0.01 (Table 5). These findings indicate that, maintaining the conditions for the other variables, patients with insulin and metformin treat-ment have a higher probability of success (HbA1c �8.0% [64 mmol/mol]), with an increase of 71.8% [CI 95% 1.329;2.220], than the patients with insulin monotherapy treatment. Age and sex (men) have positive coefficient estimates and are statistically significant. The number of antidiabetic medicines, BMI, LDL-cholesterol, triglycerides and the number of diabetes con-sultations in the last twelve months have negative coefficient estimates and are statistically significant.
Table 4. Summary of the statistical model for glycemic control (HbA1c �8.0% [64 mmol/mol]) in patients on metformin and a sulfonylurea treatmentversus in
patients on metformin and a DPP-4 inhibitor treatment.
Variable Estimate Standard error z †p-Value ‡OR ‡CI 95%;‡OR
(Intercept) -1.384 2.377 -0.582 0.560
Age (years) 0.028 0.018 1.529 0.126 1.028 0.992–1.066
Sex:
Woman (reference category)
Man 0.563 0.316 1.780 0.075• 1.756 0.945–3.266
Educational level:
No education (reference category)
Primary school 1.536 0.800 1.921 0.055• 4.648 0.969–22.289
High school 2.229 0.858 2.597 0.009�� 9.292 1.728–49.973
Higher education 2.062 0.913 2.259 0.024� 7.865 1.314–47.078
Years of T2DM since diagnostic -0.001 0.020 -0.070 0.944 0.999 0.960–1.039
Number of antidiabetic medicines -0.293 0.333 -0.880 0.379 0.746 0.388–1.434
BMI (kg/m2) -0.007 0.033 -0.217 0.828 0.993 0.931–1.059
LDL-cholesterol (mg/dl) -0.003 0.005 -0.572 0.567 0.997 0.988–1.007
Triglycerides (mg/dl) 0.000 0.002 -0.212 0.832 1.000 0.996–1.003
SBP (mmHg) -0.006 0.007 -0.780 0.435 0.994 0.980–1.009
Number of diabetes consultations in the last 12 months 0.196 0.242 0.810 0.418 1.216 0.757–1.953 Pharmacotherapeutic treatment:
Metformin + Sulfonylurea (reference category)
Metformin + DPP-4-inhibitor 1.013 0.373 2.714 0.007�� 2.753 1.325–5.721 † Significance: • p-value <0.10 �p-value <0.05 ��p-value <0.01 ���p-value <0.001 / ‡
Odds ratio (OR) and Confidence interval (CI). https://doi.org/10.1371/journal.pone.0235376.t004
Discussion
There are several studies already published related with determinants of glycemic control but there are different values to consider that glycemic control is achieved. Concerning the present study, it is adequate to start the discussion with results from studies that chose approximately the same target value.
In a nationwide study in the United States of America, with the outcome of success defined as HbA1c <8.0% (64 mmol/mol), a logistic regression established statistical significance for the variables age (older), sex (men) and therapeutic profile; furthermore, the probability of success for therapeutic profile was as follows (in ascending order): OAD conjugated with insu-lin; only insuinsu-lin; only OAD [12]. Another nationwide epidemiologic study in Brazil, which also defined the outcome of success as HbA1c <8.0% (64 mmol/mol), found a higher probabil-ity of success in older people, patients who had T2DM for a shorter period of time and patients who were not under insulin treatment; these findings were statistically significant [13]. In gen-eral, these studies are in line with the determinants found on the present study; there is a higher probability of glycemic control for men, older patients, and patients with less years of T2DM since diagnosis. A common finding is that patients taking insulin have a lower proba-bility of achieving glycemic control. Usually patients are first treated with OAD being insulin
Table 5. Summary of the statistical model for glycemic control (HbA1c �8.0% [64 mmol/mol]) in patients on insulin treatmentversus in patients on insulin and
metformin treatment.
Variable Estimate Standard error z †p-Value ‡OR ‡CI 95%;‡OR
(Intercept) 0.741 1.909 0.056•
Age (years) 0.018 0.006 2.930 0.003�� 1.018 1.006–1.031
Sex:
Woman (reference category)
Man 0.310 0.109 2.839 0.005�� 1.364 1.101–1.689
Educational level:
No education (reference category)
Primary school 0.275 0.236 1.161 0.246 1.316 0.828–2.092
High school 0.396 0.260 1.521 0.128 1.486 0.892–2.475
Higher education 0.485 0.329 1.474 0.141 1.624 0.852–3.095
Years of T2DM since diagnostic -0.007 0.006 -1.116 0.264 0.993 0.982–1.005
Number of antidiabetic medicines -0.321 0.085 -3.785 <0.001��� 0.725 0.614–0.856
BMI (kg/m2) -0.024 0.011 -2.129 0.033� 0.976 0.955–0.998
LDL-cholesterol (mg/dl) -0.005 0.002 -3.273 0.001�� 0.995 0.991–0.998
Triglycerides (mg/dl) -0.001 <0.001 -2.270 0.023� 0.999 0.998–1.000
SBP (mmHg) -0.005 0.003 -1.794 0.073• 0.995 0.991–1.000
Number of diabetes consultations in the last 12 months -0.335 0.066 -5.070 <0.001��� 0.715 0.629–0.814 Pharmacotherapeutic treatment:
Insulin (reference category)
Insulin + Metformin 0.541 0.131 4.132 <0.001��� 1.718 1.329–2.220 † Significance: • p-value <0.10 �p-value <0.05 ��p-value <0.01 ���p-value <0.001 / ‡
Odds ratio (OR) and Confidence interval (CI). https://doi.org/10.1371/journal.pone.0235376.t005
added to treatment at a later stage when the glycemic control fails. Thus, it is reasonable that insulin is associated with the poorest results for glycemic control.
Other findings of the present study are that an increased number of antidiabetic medicines prescribed and an increased number of diabetes consultations are associated with a worst gly-cemic control, what probably reflects the fact that patients with poor glygly-cemic control need more drugs or tighter clinical follow-up.
Despite other studies selected lower glycemic control values, those studies are important to have an overview of their findings. One study in primary care units in the United Kingdom used logistic regression to examine glycemic control, defined as HbA1c �7.5% (59 mmol/ mol), and revealed a higher probability of success in older people and in patients treated with five or fewer medicines (not only antidiabetic medicines); these findings were statistically sig-nificant [14]. For glycemic control defined as HbA1c �7.0% (53 mmol/mol), another study in Brazil performed in ambulatory patients from an university clinic detected a higher probability of success in older people, patients with �100 mg/dl of LDL-cholesterol and patients without insulin treatment; these findings were statistically significant [15]. For the same glycemic con-trol level, a study performed in an endocrinology clinic in Beirut, Lebanon, showed a higher probability of success in patients with <150 mg/dl of triglycerides and without insulin treat-ment; these findings were statistically significant [16]. A study of glycemic control, defined as HbA1c <7.0% (53 mmol/mol), that was performed in nationwide Chinese hospitals found a higher probability of success in older people, women and those only under OAD treatment (instead of OAD combined with insulin treatment); these findings were statistically significant [17]. In individuals from the Jordan National Center for Diabetes, there was a higher probabil-ity of success in patients who had T2DM for seven or fewer years; with respect to the therapeu-tic profile, the ascending probability of success was as follows: both OAD and insulin; only insulin; only OAD [18].
In these studies, the statistically significant variables are in line with the present study, except for the study performed in Chinese in hospitals where women got more probability of glycemic control. In the present study many metabolic variables where statistically significant (BMI, LDL-cholesterol, triglycerides and SBP) and only two studies [15,16] obtained statistical significance for this type of variables.
However, not only clinical parameters are important to glycemic control. One of the most important finding in the present study was that educational level has a strong association to a successful glycemic control. This variable was not analysed or relevant in the studies previously mentioned.
Concerning the specific treatments of metformin combined with a sulfonylureaversus
met-formin combined with a DPP-4 inhibitor, one German multicenter study followed individuals with these treatments for twelve months. For the first treatment, at the beginning of the study, patients had T2DM for an average of 5.4 years and had an average HbA1c value of 7.6±0.8% (60±9 mmol/mol); at the end of the study, an average change of -0.6±0.9% (-7±10 mmol/mol) was observed. For the second treatment, at the beginning of the study, patients had T2DM for an average of 4.7 years and an average HbA1c value of 7.5±0.7% (59±8 mmol/mol); at the of the study, an average change of -0.6±0.8% (-7±9 mmol/mol) was observed. No statistical sig-nificance was observed between these two average changes in HbA1c [19].
In one study that focused on the addition of a sulfonylurea or a DPP-4 inhibitor to metfor-min, the use of a DPP-4 inhibitor led to a higher proportion of patients with good glycemic control (HbA1c <7% [53 mmol/mol]); these findings were statistically significant [20]. Another study also showed better results with a DPP-4 inhibitor than with a sulfonylurea, both in addition to metformin, but these findings did not achieve statistical significance [21]. On the present study, concerning the addition of a DDP-4 inhibitorversus a sulfonylurea to
metformin, the result is very clear, as a strong statistical association was obtained: adding a DDP-4 inhibitor leads to a better probability of glycemic control. However, we need to consider that different populations, settings, and methodologies can lead to different out-comes. Regardless the medicine added to metformin treatment, the introduction of a second medicine, namely, a sulfonylurea or a DPP-4 inhibitor, leads to a decrease in HbA1c levels [20–24].
One meta-analysis that included twenty studies on treatment with both insulin and metfor-minversus treatment with only insulin presented an average reduction in HbA1c of 0.6% (7
mmol/mol) (CI 95% [-0.89, -0.31], p<0.001) in those treated with insulin combined with met-formin [25]. The reduction in HbA1c levels with this type of drug combination continues to be described in more recent studies [26,27] and they are in line with the strong statistic associ-ation revealed in the present study.
Regarding the limitations of this study, the information on this database is from 2012, and we now have additional medicines. However, this advancement does not invalidate the statisti-cal model and the comparison of different therapeutic treatments. The database was extracted from clinic records and these records do not have information related with important aspects such as income, rural or non-rural residence, marital status, and if the patient leaves alone or not. Other important clinic information, such as other diseases or patient’s phenotypes could not consistently be extracted from the records.
With respect to the setting (APDP), this clinic is established in Lisbon and it is well known in Portugal. Many patients with diabetes are referred to this clinic, especially patients without glycemic control, and all patients are follow-up by their own diabetologist doctor. The statistical model was created for the outcome HbA1c �8.0% (64 mmol/mol) because in the population under study, this glycemic level is a realistic goal with respect to patients’ profiles [10].
In Portugal anyone living in the country has access to National Health Service (NHS). This clinic has a protocol with the NHS, so it receives all kind of people, irrespectively of their origin and level income. However, because of its location, most patients came from Lisbon Metropol-itan Area. Therefore, this clinic is not representative of the Portuguese population with diabe-tes, but it supports many patients with a difficult glycemic control.
Conclusions
In patients with T2DM, the determinants of the achievement of glycemic control are very important. In this study, being older in age, being a man, and having a higher education level were associated with better glycemic control. The increase in the value of the following vari-ables was associated with the poorest glycemic control: number of years since T2DM diagno-sis, number of antidiabetic medicines, BMI, LDL-cholesterol, triglycerides, SBP and number of diabetes consultations in the last twelve months.
The pharmacotherapeutic treatment is associated with glycemic control. The patients treated with OAD have more probability of glycemic control than patients treated with OAD and insulin. The patients taking only insulin have the poorest probability of glycemic control.
When glycemic control is not established with metformin treatment, it is crucial to choose a second medicine. The addition of a DPP-4 inhibitor or a sulfonylurea should be contem-plated, with better results achieved with the former.
In patients with insulin treatment, maintaining metformin can be useful for better glycemic control.
Finally, to develop better glycemic control, it is very important to understand the informa-tion provided by studies based on real-life patient data.
Supporting information
S1 Data.
(SAV)
Acknowledgments
The authors wish to express our thanks to APDP for making these data available for this study to be conducted and to Mr. Luı´s Flores (informatics engineer) for his informatics work in the extraction of the database.
Author Contributions
Conceptualization: Artur Mendes Moura, Marı´lia Antunes, Sofia Oliveira Martins, João Filipe Raposo.
Formal analysis: Artur Mendes Moura.
Methodology: Artur Mendes Moura, Marı´lia Antunes, Sofia Oliveira Martins, João Filipe Raposo.
Resources: João Filipe Raposo.
Validation: Artur Mendes Moura.
Writing – original draft: Artur Mendes Moura.
Writing – review & editing: Marı´lia Antunes, Sofia Oliveira Martins, João Filipe Raposo.
References
1. Canivell S, Gomis R. Diagnosis and classification of autoimmune diabetes mellitus. Autoimmun Rev. 2014; 13(4–5):403–407.https://doi.org/10.1016/j.autrev.2014.01.020PMID:24424179
2. Smushkin G, Vella A. What is type 2 diabetes? Medicine (Baltimore). 2010; 38(11):597–601.https://doi. org/10.1016/j.mpmed.2010.08.008PMID:21151710
3. Kautzky-Willer A, Harreiter J, Pacini G. Sex and Gender Differences in Risk, Pathophysiology and Com-plications of Type 2 Diabetes Mellitus. Endocr Rev. 2016; 37(3):278–316.https://doi.org/10.1210/er. 2015-1137PMID:27159875
4. Fava S. Glycaemic Control: A Balancing Act or A Different Approach? Curr Diabetes Rev. 2014; 10 (2):124–130.https://doi.org/10.2174/1573399810666140421124051PMID:24745817
5. Blonde L, Aschner P, Bailey C, et al. Gaps and barriers in the control of blood glucose in people with type 2 diabetes. Diabetes Vasc Dis Res. 2017; 14(3):172–183.https://doi.org/10.1177/
1479164116679775PMID:28467203
6. Safai N, Carstensen B, Vestergaard H, et al. Impact of a multifactorial treatment programme on clinical outcomes and cardiovascular risk estimates: A retrospective cohort study from a specialised diabetes centre in Denmark. BMJ Open. 2018; 8(3):1–9.https://doi.org/10.1136/bmjopen-2017-019214PMID: 29550776
7. Sieng S, Hurst C. A combination of process of care and clinical target among type 2 diabetes mellitus patients in general medical clinics and specialist diabetes clinics at hospital levels. BMC Health Serv Res. 2017; 17(1):1–9.https://doi.org/10.1186/s12913-016-1943-zPMID:28049468
8. Skugor M. Medical treatment of diabetes mellitus. Cleve Clin J Med. 2017; 84(1):S57–S61.https://doi. org/10.3949/ccjm.84.s1.07PMID:28708483
9. NICE. Type 2 diabetes in adults: management. NICE Guidel (NG 28; 2 December 2015). 2019;(Last update May 2017). https://www.nice.org.uk/guidance/ng28/resources/type-2-diabetes-in-adults-management-pdf-1837338615493.
10. Qaseem A, Wilt TJ, Kansagara D, et al. Hemoglobin A1ctargets for glycemic control with pharmacologic therapy for nonpregnant adults with type 2 diabetes mellitus: A guidance statement update from the American college of physicians. Ann Intern Med. 2018; 168(8):569–576. https://doi.org/10.7326/M17-0939PMID:29507945
11. Alramadan MJ, Afroz A, Hussain SM, et al. Patient-related determinants of glycaemic control in people with type 2 diabetes in the gulf cooperation council countries: A systematic review. J Diabetes Res. 2018; 25 Februar:1–14.https://doi.org/10.1155/2018/9389265PMID:29682584
12. Egede LE, Gebregziabher M, Hunt KJ, et al. Regional, geographic, and racial/ethnic variation in glyce-mic control in a national sample of veterans with diabetes. Diabetes Care. 2011; 34:938–943.https:// doi.org/10.2337/dc10-1504PMID:21335370
13. Viana LV, Leitão CB, Kramer CK, et al. Poor glycaemic control in Brazilian patients with type 2 diabetes attending the public healthcare system: a cross-sectional study. BMJ Open. 2013; 3:e003336.https:// doi.org/10.1136/bmjopen-2013-003336PMID:24052610
14. Nagrebetsky A, Griffin S, Kinmonth AL, et al. Predictors of suboptimal glycaemic control in type 2 diabe-tes patients: the role of medication adherence and body mass index in the relationship between glycae-mia and age. Diabetes Res Clin Pract. 2012; 96:119–128.https://doi.org/10.1016/j.diabres.2011.12. 003PMID:22261095
15. Panarotto D, Teles AR, Schumacher MV. Fatores associados ao controle glicêmico em pacientes com diabetes tipo 2. Rev Assoc Med Bras. 2008; 54(4):314–321.http://www.scielo.br/pdf/ramb/v54n4/15. pdf.https://doi.org/10.1590/s0104-42302008000400016PMID:18719789
16. Noureddine H, Nakhoul N, Galal A, et al. Level of A1c control and its predictors among Lebanese type 2 diabetic patients. Ther Adv Endocrinol Metab. 2014; 5(3):43–52.https://doi.org/10.1177/
2042018814544890PMID:25126407
17. Ji L-N, Lu J-M, Guo X-H, et al. Glycemic control among patients in China with type 2 diabetes mellitus receiving oral drugs or injectables. BMC Public Health. 2013; 13:602. https://doi.org/10.1186/1471-2458-13-602PMID:23800082
18. Khattab M, Khader YS, Al-Khawaldeh A, et al. Factors associated with poor glycemic control among patients with type 2 diabetes. J Diabetes Complications. 2010; 24:84–89.https://doi.org/10.1016/j. jdiacomp.2008.12.008PMID:19282203
19. Gitt AK, Bramlage P, Binz C, et al. Prognostic implications of DPP-4 inhibitor vs sulfonylurea use on top of metformin in a real world setting—results of the 1 year follow-up of the prospective DiaRegis registry. Int J Clin Pract. 2013; 67(10):1005–1014.https://doi.org/10.1111/ijcp.12179PMID:23981060
20. Rathmann W, Bongaerts B, Kostev K. Change in glycated haemoglobin levels after initiating second-line therapy in type 2 diabetes: a primary care database study. Diabetes, Obes Metab. 2016; 18 (8):840–843.https://doi.org/10.1111/dom.12673PMID:27062643
21. Go¨ke R, Gruenberger JB, Bader G, et al. Real-life efficacy and safety of vildagliptin compared with sul-fonylureas as add-on to metformin in patients with type 2 diabetes mellitus in Germany. Curr Med Res Opin. 2014; 30(5):785–789.https://doi.org/10.1185/03007995.2013.875464PMID:24328429
22. Phung OJ, Sobieraj DM, Engel SS, et al. Early combination therapy for the treatment of type 2 diabetes mellitus: systematic review and meta-analysis. Diabetes, Obes Metab. 2014; 16(5):410–417.https:// doi.org/10.1111/dom.12233PMID:24205921
23. Goldshtein I, Karasik A, Melzer-Cohen C, et al. Urinary albumin excretion with sitagliptin compared to sulfonylurea as add on to metformin in type 2 diabetes patients with albuminuria: A real-world evidence study. J Diabetes Complications. 2016; 30(7):1354–1359.https://doi.org/10.1016/j.jdiacomp.2016.05. 012PMID:27320183
24. Zhang Y, Mccoy RG, Mason JE, et al. Second-line agents for glycemic control for type 2 diabetes: are newer agents better? Diabetes Care. 2014; 37(May):1338–1345.https://doi.org/10.2337/dc13-1901 PMID:24574345
25. Hemmingsen B, Chritensen LL, Wetterslev J, et al. Comparison of metformin and insulin versus insulin alone for type 2 diabetes: systematic review of randomised clinical trials with meta-analyses and trial sequential analyses. BMJ. 2012; 344:e1771.https://doi.org/10.1136/bmj.e1771PMID:22517929
26. Lundby-Christensen L, Tarnow L, Boesgaard TW, et al. Metformin versus placebo in combination with insulin analogues in patients with type 2 diabetes mellitus—the randomised, blinded Copenhagen Insu-lin and Metformin Therapy (CIMT) trial. BMJ Open. 2016; 6(2):1–11. https://doi.org/10.1136/bmjopen-2015-008376PMID:26916684
27. Zhang Y, Zhao Z, Wang S, et al. Intensive insulin therapy combined with metformin is associated with reduction in both glucose variability and nocturnal hypoglycaemia in patients with type 2 diabetes. Dia-betes Metab Res Rev. 2017; 33(7):1–8.https://doi.org/10.1002/dmrr.2913PMID:28609547
![Table 4. Summary of the statistical model for glycemic control (HbA1c �8.0% [64 mmol/mol]) in patients on metformin and a sulfonylurea treatment versus in patients on metformin and a DPP-4 inhibitor treatment.](https://thumb-eu.123doks.com/thumbv2/123dok_br/18142823.871193/6.918.49.867.146.546/summary-statistical-metformin-sulfonylurea-treatment-metformin-inhibitor-treatment.webp)
![Table 5. Summary of the statistical model for glycemic control (HbA1c �8.0% [64 mmol/mol]) in patients on insulin treatment versus in patients on insulin and metformin treatment.](https://thumb-eu.123doks.com/thumbv2/123dok_br/18142823.871193/7.918.50.868.145.548/summary-statistical-glycemic-patients-treatment-patients-metformin-treatment.webp)
