Article
Printed in Brazil - ©2018 Sociedade Brasileira de Química*e-mail: [email protected]
Potential Bio-Oil Production from Invasive Aquatic Plants by Microscale
Pyrolysis Studies
Luana O. Santos, Fernanda F. Silva, Lidiane C. Santos, Ingred S. C. Carregosa and Alberto Wisniewski Jr.*
Grupo de Pesquisa em Petróleo e Energia da Biomassa (PEB), Departamento de Química, Universidade Federal de Sergipe, Rodovia Marechal Randon, s/n, Jardim Rosa Elze,
49100-000 São Cristóvão-SE, Brazil
The invasive aquatic plants Eichhornia crassipes (water hyacinth), Eichhornia azurea, and Nymphaea spp. were evaluated as sources of lignocellulosic biomass for the production of bio-oil. These plants have high growth rates that can lead to various environmental problems and the production of large amounts of waste biomass. The materials were characterized in terms of their contents of moisture, oil, and ash, and by analysis using thermogravimetry, infrared spectroscopy (IR), elemental analysis, and energy dispersive X-ray fluorescence spectrometry (EDX). The in natura biomasses had moisture contents of around 90%. Micropyrolysis studies were performed at 500 °C using the dried biomasses (ca. 8% moisture). The liquid product of pyrolysis (bio-oil) was trapped in an adsorbent and then eluted with different solvents. The best recovery was achieved using tetrahydrofuran. The bio-oil solutions were derivatized with N-methyl-N-(trimethylsilyl) trifluoroacetamide (MSTFA) and analyzed by gas chromatography mass spectrometry (GC-MS). The main compounds found in the bio-oils were glycerol, o-benzenediol, p-benzenediol, arabinoic acid, levuglucosan, and hexadecanoic acid.
Keywords: aquatic plants, biomass, pyrolysis, bio-oil, water hyacinth
Introduction
Energy demand has increased steadily due to population growth and uncontrolled industrial development, with increasing consumption of energy from oil, coal, and natural gas. The associated emissions of greenhouse gases (CO2, NOx, and SOx) can lead to various negative environmental effects including climate change, rising sea levels, and loss of biodiversity, amongst others.1
There is therefore a need for new sources of renewable energy that are low cost and generate lower greenhouse gas emissions,2 such as biomass, geothermal, and solar technologies. Biomass resources are abundant throughout the world and can be economically, socially, and environmentally viable as an alternative to enable the reduced use and gradual replacement of fossil fuels.3
Biomass has great potential for energy generation and for the production of chemical compounds with high added value. The materials that can be used for these purposes include forestry and agricultural wastes, amongst
others,4 and account for around 10 percent of world energy consumption.5 These materials can be converted into liquid, solid, and gaseous fuels using biochemical and thermochemical conversion processes.6
Lignocellulosic biomass has been increasingly studied in recent years, because its use as energy source does not directly compete with food production. In addition, the conversion of lignocellulosic waste by means of thermal or biochemical processes can produce liquid fuels such as ethanol or bio-oil, gaseous fuels such as biogas (methane), and electricity.7
The water hyacinth (plants of the genus Eichhornia) can be a useful source of biomass because of its rapid growth. This aquatic plant is native to South America, where it is well known for the environmental problems it causes.8,9 Clumping leads to the formation of dense mats that obstruct the passage of light to submerged plants and reduce oxygen levels in the water. These mats also affect navigation and fishing, reduce biodiversity,10 and can cause hygiene problems that affect human health.11 The annual growth rate corresponds to approximately 40-140 tons of dry material
to the Nymphaeaceae family, which includes several species that are usually rooted in the sediment, with floating leaves and flowers whose color varies according to species.13 No studies were found in the literature concerning its chemical composition or processes for its conversion.
Substantial sums are spent annually on developing techniques to control the spread of water hyacinth, including physical removal, chemical methods (herbicide application), and release of biological control agents (insects). However, none of these methods has proved to be fully effective, necessitating the development of alternative strategies.10 Water hyacinth can be used in phytoremediation, for example in the decontamination of effluent ponds containing high levels of heavy metals, although it can also be a source of pollution.14
The conversion of biomass from aquatic plants such as water hyacinth by pyrolysis can be used to obtain second generation biofuels. It has been reported that the thermal conversion, at 400 °C, of water hyacinth containing 15% moisture resulted in the production of around 45, 25 and 12% of biochar, biogas, and bio-oil, respectively, the latter with a high calorific value and composed mainly of alkanes (26%), benzene derivatives (13%), nitro compounds (24%), phenol derivatives (27%), and other compounds (10%).15
Investigation of the kinetics of pyrolysis and hydrothermal decomposition of water hyacinth at low temperatures found that 116 and 90 kJ mol-1 were required for pyrolysis and hydrothermal decomposition, respectively. Thermal decomposition required less energy for biomass conversion, with decomposition of lignin at temperatures below 280 °C, which did not occur in the pyrolysis process.8 In evaluation of the catalytic and non-catalytic pyrolysis of water hyacinth for syngas production, the best results were achieved using KCl at 900 °C.16
The present work describes the use of a micropyrolysis process for bio-oil production from Eichhornia crassipes
(EC), Eichhornia azurea (EA), and Nymphaea spp. (Ny), with determination of the chemical compositions of the pyrolysates.
Experimental
Materials and methods
The aquatic plants were chosen based on their presence in the water bodies from which the Sergipe Sanitation Company (DESO) extracts water for treatment and distribution. Eichhornia azurea and Nymphaea
were collected in the Poxim River (at 10° 55’ 14.35’’ S; 37° 5’ 51.76’’ W). Eichhornia crassipes was collected at the Macela weir (at 10° 40’ 19.83’’ S; 37° 25’ 14.60’’ W).
The collection of the plants was performed by removing entire clumps to the water surface, followed by washing to remove the sludge. The roots were removed, and the stems and leaves were cut into pieces sized approximately 2 cm2. A sample of the material was immediately used for moisture determination, and the remainder was dried in an oven at 50 °C for 48 h, followed by reduction to a 48 mesh particle size.
Biomass characterization
Oil content
The oil content was determined using 5 g of dried sample extracted with petroleum ether in a Soxhlet apparatus for 8 h.17
Ash content
The ash content was determined using about 2 g of biomass subjected to 525 °C for 4 h (TAPPI T211 om-93 method).
Thermogravimetry (TG)
The thermal behaviors of the biomasses were characterized using a Shimadzu TGA-50 analyzer, with nitrogen as the purge gas at a flow of 40 mL min-1. Approximately 8 mg of sample was heated from 25 to 600 °C, at a rate of 5 °C min-1.
Infrared analysis
For infrared (IR) analysis, the biomasses were first passed through a 250 mesh sieve. IR spectra were acquired in the range 400-4000 cm-1 using a PerkinElmer Spectrum BX FTIR system. The biomass samples were thoroughly mixed with potassium bromide (KBr), and the mixture was compressed prior to analysis.
Elemental analysis and calorific value
The elemental compositions (considering C, H, N, O, and S) of the materials were determined using a Thermo Finnigan analyzer (Flash EA 1112 Series). The oxygen content was determined by difference. The calorific values (HHV: high heating value) of the biomasses were calculated using equation 1, with 90% accuracy and ± 5% error.18
HHV (MJ kg-1) = −1.3675 + 0.3137C + 0.7009H − 0.0318O (1)
Energy dispersive X-ray fluorescence spectrometry (EDX)
with a rhodium X-ray generator tube, silicon detector, 10 mm collimator, and liquid nitrogen cooling system. The working range was between the atoms Na-Sc (15 kV) and Ti-U (50 kV), comprising atoms with atomic numbers 11-92, and the total analysis time was 100 s (for operation in qualitative-quantitative mode). The equipment was calibrated using a standard reference compound alloy with the following composition: Cr (18.395%), Mn (1.709%), Fe (70.718%), Ni (8.655%), Cu (0.278%), and Mo (0.245%). For the analysis, a layer of sample was formed between sheets of Mylar film (thickness 0.05 mm).
Micropyrolysis
The home-made micropyrolysis system consisted of a borosilicate glass tube (100 × 4 mm) wrapped with nickel-chromium resistance wire.19 One end of the tube was attached to a nitrogen line with a constant flow of 2 mL min-1, and the other end was coupled to a cartridge containing an adsorbent material (activated charcoal, ca. 1 cm tube section) that functioned as a trap for the pyrolysate. About 50 mg of the comminuted biomass was placed inside the tube, supported on glass wool near the entrance, and was purged with nitrogen (2 mL min-1) for about 1 min prior to heating. The process started with heating for around 3 min in order to reach a temperature of 500 ± 10 °C, which was then maintained for 0.5 min (Figure 1). The products retained in the adsorbent were eluted using solvents and then analyzed by gas chromatography mass spectrometry (GC-MS). The chemical composition of the pyrolysate was determined using the NIST (05 and 07) and Wiley 8 spectral libraries, with all identified compounds having similarity index values above 80%. Relative quantification of the pyrolysate composition was performed using gas chromatography with flame ionization detection (GC-FID) analyses.
Gas chromatography mass spectrometry (GC-MS)
The solutions were analyzed using a Shimadzu QP2010 gas chromatograph-mass spectrometer system. An Rtx-5MS capillary column was used (5% diphenyl, 95% dimethylpolysiloxane, 30 m, 0.25 mm i.d., 0.25 µm). The oven program was 50 °C for 3.0 min, followed by a ramp
at 10 °C min-1 up to 280 °C (held for 7.0 min). The carrier gas was He at a constant flow rate of 1.00 mL min-1, the injection volume was 1 µL (splitless mode, 1 min), and the injector and interface temperatures were both 280 °C. The mass spectrometer was operated using electron ionization at 70 eV, and the analysis time was 33 min.
Gas chromatography with flame ionization detection (GC-FID)
The solutions were analyzed using a LECO GC×GC (Agilent 7890A) instrument operated in single mode. The columns used were HP-5ms (30 m × 0.25 mm i.d., 0.25 µm) and DB-17 (1.5 m × 0.1 mm i.d., 0.1 µm). The injected volume was 1 µL, using split mode (1:20) and injector temperature of 280 °C. Hydrogen was employed as the carrier gas, at a constant flow rate of 1 mL min-1. The primary oven temperature program was 40 °C for 5 min, followed by a ramp at 5 °C min-1 to 280 °C (held for 7 min). The secondary oven was operated at 20 °C above the primary oven temperature.
Results and Discussion
Characterization of the biomasses
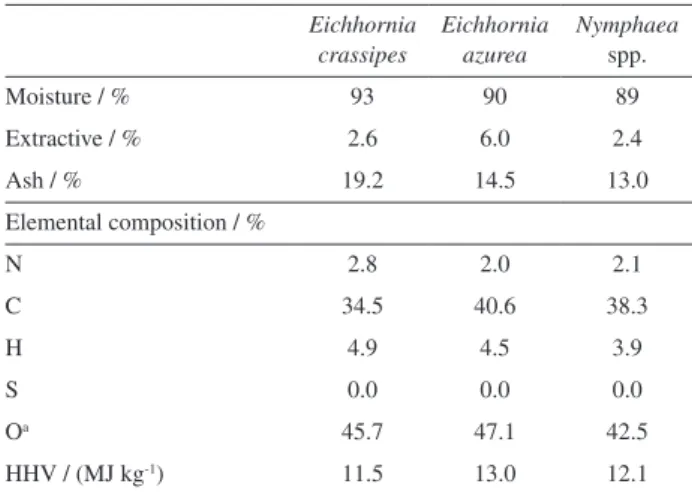
The biomass compositions are summarized in Table 1. The Eichhornia crassipes, Eichhornia azurea, and Nymphaea spp. plants innatura had high moisture contents (89-90%) and therefore required drying prior to compositional analysis. The extractives of EA, EC, and Ny were 6.0% (m/m), 2.6% (m/m), and 2.4% (m/m), respectively, relative to the dry mass (10% moisture content). The ash contents of EA and Ny were 14.5 and 13.0%, respectively. The approximate analyses were reported elsewhere.12-15
Figure 1. Micropyrolysis system (adapted from reference 19).
Table 1. Elemental compositions of the biomasses
Eichhornia crassipes
Eichhornia azurea
Nymphaea spp.
Moisture / % 93 90 89
Extractive / % 2.6 6.0 2.4
Ash / % 19.2 14.5 13.0
Elemental composition / %
N 2.8 2.0 2.1
C 34.5 40.6 38.3
H 4.9 4.5 3.9
S 0.0 0.0 0.0
Oa 45.7 47.1 42.5
HHV / (MJ kg-1) 11.5 13.0 12.1
The IR spectra of the biomasses showed similar profiles. The main functional groups were O−H (3000-3600 cm-1), C−H (3000-2800 cm-1), C=C (ca. 1650 cm-1), and C−O (1200-1300 cm-1)20 (Table 2). Due to the lignocellulosic nature of biomasses, the main constituents were probably alkenes, esters, aromatics, alcohols, and ketones with different oxygen-containing functional groups.21 The elemental analyses indicated high carbon and oxygen contents,22 and the calculated calorific values were close to the value reported in the literature for water hyacinth (14.36 MJ kg-1).23
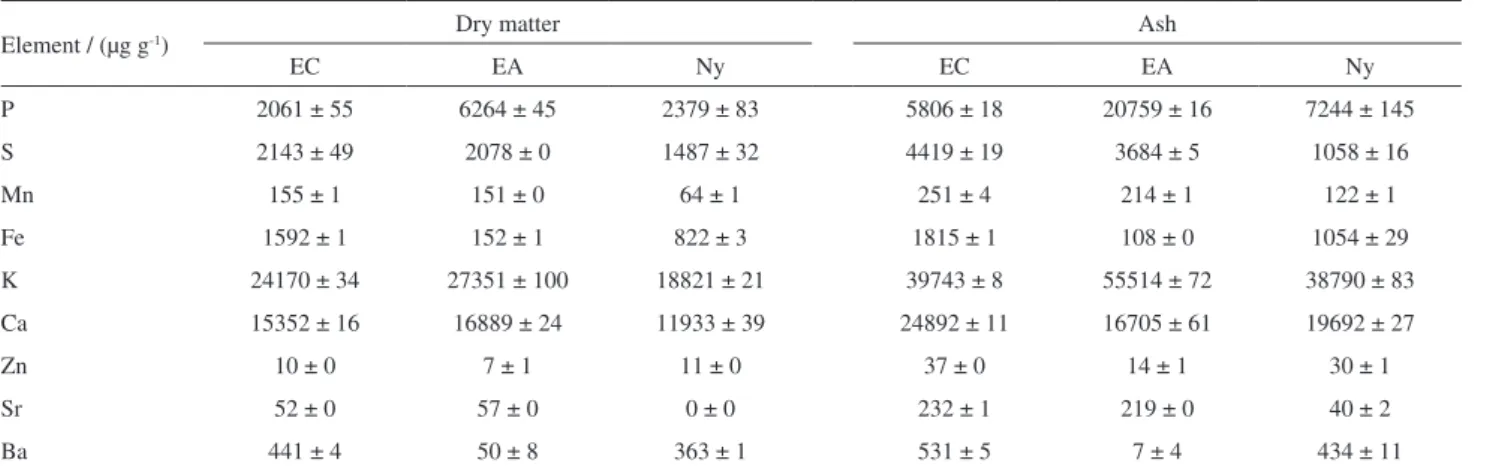
Table 2 presents the EDX results for the biomasses and their corresponding ashes. The macronutrients (P, S, K, and Ca) were present at high concentrations, as expected because they are natural constituents of proteins or act as osmotic agents. There were smaller quantities of the micronutrients (Fe, Mn, and Zn) that are essential for plant development and act in fundamental plant growth responses and photosynthesis. As expected, the ashes showed higher concentrations of the elements analyzed, compared to the dry plant material.
Thermal analysis
Figure 2 illustrates the thermal behaviors of the samples. Although the plants had been oven-dried, there were mass losses of 7.3% (EC), 8.8% (EA), and 5.3% (Ny) up to 100 °C, attributed to the removal of water. Mass losses in the temperature range 170-415 °C corresponded to thermal decomposition of the total amounts of hemicellulose and cellulose, which consist of saturated compounds and decompose at low temperatures. Hemicellulose has a smaller molecular mass than cellulose and therefore decomposes more readily.24 Lignin, which is more stable due to its aromatic structure, decomposes
at higher temperatures.8-22,24-26 The decomposition that occurred at 400-600 °C could therefore be attributed to lignin degradation.12 However, it has been reported that the decomposition of lignin takes place gradually, at a very low rate and throughout the temperature range.27,28
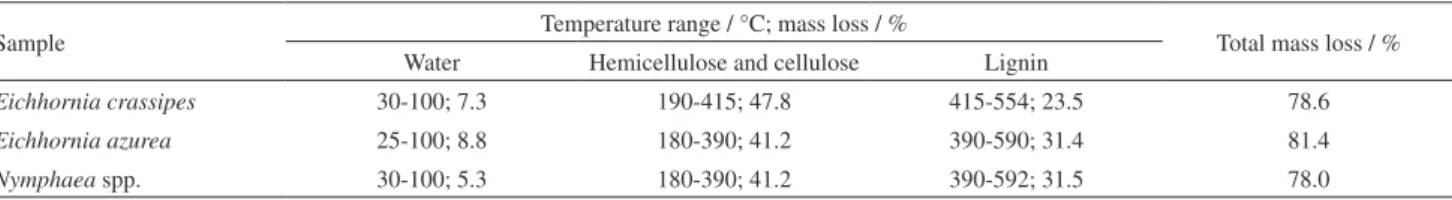
Table 3 shows the percentage compositions of the biomasses, based on analysis of the thermal profiles. The solid residues remaining after the TG analyses of EA, EC, and Ny contributed 18.5, 21.4, and 24.5% of the mass, respectively, and consisted of charcoal and ash formed during the pyrolysis process.
Micropyrolysis
The products of pyrolysis trapped in the adsorbent material were recovered using different solvents, namely dichloromethane (DCM), acetonitrile (ACN), and tetrahydrofuran (THF). Each solvent was used separately,
Table 2. Inorganic constituents of the biomasses (n = 2)
Element / (µg g-1) Dry matter Ash
EC EA Ny EC EA Ny
P 2061 ± 55 6264 ± 45 2379 ± 83 5806 ± 18 20759 ± 16 7244 ± 145
S 2143 ± 49 2078 ± 0 1487 ± 32 4419 ± 19 3684 ± 5 1058 ± 16
Mn 155 ± 1 151 ± 0 64 ± 1 251 ± 4 214 ± 1 122 ± 1
Fe 1592 ± 1 152 ± 1 822 ± 3 1815 ± 1 108 ± 0 1054 ± 29
K 24170 ± 34 27351 ± 100 18821 ± 21 39743 ± 8 55514 ± 72 38790 ± 83
Ca 15352 ± 16 16889 ± 24 11933 ± 39 24892 ± 11 16705 ± 61 19692 ± 27
Zn 10 ± 0 7 ± 1 11 ± 0 37 ± 0 14 ± 1 30 ± 1
Sr 52 ± 0 57 ± 0 0 ± 0 232 ± 1 219 ± 0 40 ± 2
Ba 441 ± 4 50 ± 8 363 ± 1 531 ± 5 7 ± 4 434 ± 11
EC: Eichhornia crassipes; EA: Eichhornia azurea; Ny: Nymphaea spp.
Figure 2. TG curves for Eichhornia crassipes (EC), Eichhornia azurea
and each resulting solution of bio-oil was analyzed using GC-MS. Poor total ion current chromatograms (TICCs) were obtained for these solutions, even when a modified trap was tested with anhydrous sodium sulfate, in a proportion of 1:1, in order to retain the water generated in the pyrolysis process. Figure 3 shows a schematic representation of the bio-oil elution procedure. The first solvent tested was DCM, which is commonly employed in off-line pyrolysis studies.29 ACN was also tested to ensure that polar compounds were also being removed from the adsorbent material. Different visual appearances were observed for the pyrolysis products obtained using DCM, ACN, or THF as eluent.
Among the three solvents tested, THF showed the best bio-oil recovery, with the TICCs presenting a greater
number of compounds with higher intensity, compared to the use of ACN or DCM. This behavior was similar for all the biomasses tested (Figure 4), and could be explained by the intermediate polarity of THF, which enabled the elution of most of the compounds of medium to high polarity. Given that the best results were obtained using THF, this solvent was then tested with the addition of MSTFA derivatization agent (N-methyl-N-(trimethylsilyl) trifluoroacetamide), using various bio-oil solution:MSTFA ratios in an attempt to improve the TICC profile, with best results obtained for a 1:1 ratio.
Chemical compositions of the pyrolysates
The bio-oil solutions analyzed showed similar profiles, with a variety of different compounds. Chemical characterization was not straightforward, due to the complex mixture of many hydroxylated compounds that were mostly present in small amounts. Figure 5 shows the TICC of EA, together with the main compounds identified.
The chemical composition of bio-oil from lignocellulosic biomass includes a highly complex mixture of different oxygenated organic molecules. These oxygenates include acids, alcohols, phenols, and furans, together with their derivatives, obtained from the thermal decomposition
Table 3. Temperature ranges and corresponding estimated mass percentages of the main constituents of the biomasses
Sample Temperature range / °C; mass loss / % Total mass loss / %
Water Hemicellulose and cellulose Lignin
Eichhornia crassipes 30-100; 7.3 190-415; 47.8 415-554; 23.5 78.6
Eichhornia azurea 25-100; 8.8 180-390; 41.2 390-590; 31.4 81.4
Nymphaea spp. 30-100; 5.3 180-390; 41.2 390-592; 31.5 78.0
Figure 3. Bio-oil elution scheme.
Figure 4. TICCs for bio-oil solutions derived from Eichhornia azurea (EA), Eichhornia crassipes (EC), and Nymphaea spp. (Ny), obtained using DCM
of hemicellulose and cellulose. There are also present phenolic and cyclic oxygenated compounds derived from lignin, which is a complex structure of substituted aromatic phenyl-propane units linked by methoxylic and hydroxyl groups. In addition to these, the bio-oil contains water originating from pyrolysis dehydration reactions and the initial moisture in the lignocellulosic biomass.
In previous work,30 we used the Fourier transform-ion cyclotron resonance mass spectrometry (FT-ICR MS) technique with an electrospray ionization source (ESI) to characterize the bio-oil of the same invasive aquatic plants. The use of ESI(+) revealed a wide range of chemical classes in these bio-oils, including pyridine (class N), imidazole, and pyrazine derivatives (class N2). The use of ESI(−) identified greater ranges of oxygenated classes (Ox, where x = 2-5), with the most abundant class being the fatty acids (class O2), as well as aromaticity.30 In the same earlier work, using FT-ICR MS with ESI enabled the detection of highly polar compounds with masses in
the range 200-600 Da. In the present work, we provide a complementary characterization using GC-MS and GC-FID, showing compounds with different polarities and (mostly) molecular masses smaller than 200 Da.
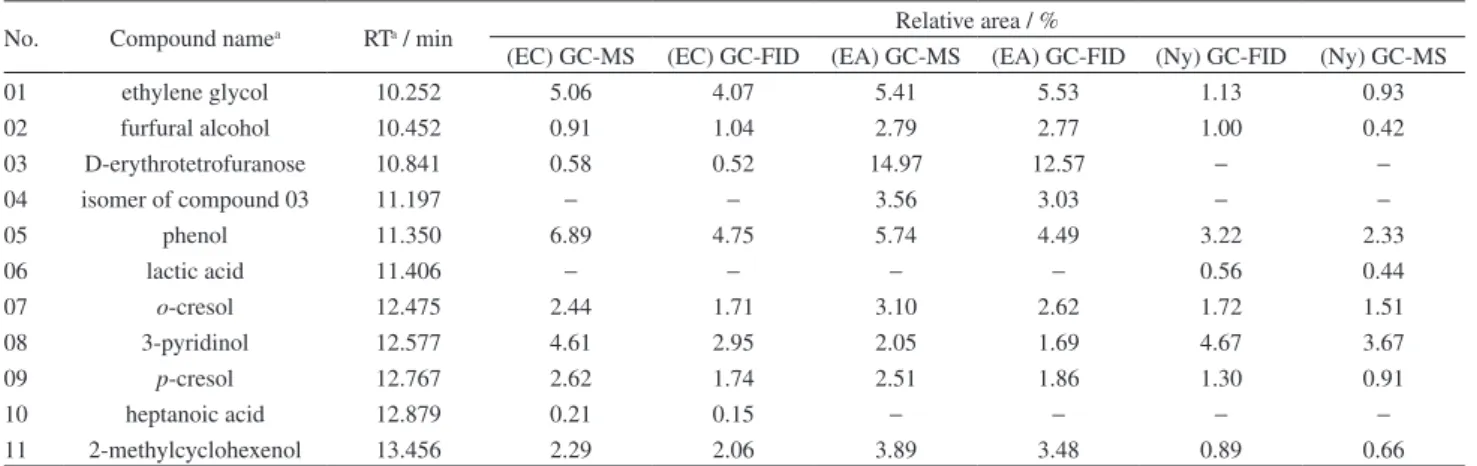
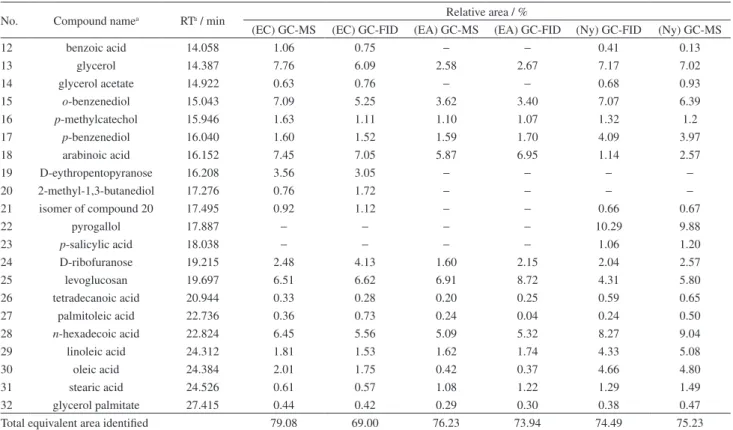
The chemical compositions of the bio-oils obtained from the three biomasses were similar, differing only in the relative amounts of the components (Table 4). The main compounds present were THF peroxide, alcohols (2-methylpropanol, 2-methylbutanol, and 1-pentanol), and levoglucosan derived from the thermal decomposition of cellulose; phenol and D-erythro-pentopyranose, formed during the pyrolysis of cellulose and hemicellulose, respectively; and benzenediol and carboxylic acids (hexadecanoic and oleic + linoleic acids). Levoglucosan (1,6-anhydro-β-D-glucopyranose), formed during the fast pyrolysis of lignocellulosic biomass, can potentially be used to produce biofuels such as ethanol and butanol.6 Hence, bio-oils derived from the biomasses of the invasive aquatic plants EC, EA, and Ny could be used to produce levoglucosan ethanol.
Figure 5. TICC of the derivatized bio-oil solution obtained from Eichhornia azurea.
Table 4. Relative chemical compositions of the invasive aquatic plant bio-oils
No. Compound namea RTa / min Relative area / %
(EC) GC-MS (EC) GC-FID (EA) GC-MS (EA) GC-FID (Ny) GC-FID (Ny) GC-MS
01 ethylene glycol 10.252 5.06 4.07 5.41 5.53 1.13 0.93
02 furfural alcohol 10.452 0.91 1.04 2.79 2.77 1.00 0.42
03 D-erythrotetrofuranose 10.841 0.58 0.52 14.97 12.57 − −
04 isomer of compound 03 11.197 − − 3.56 3.03 − −
05 phenol 11.350 6.89 4.75 5.74 4.49 3.22 2.33
06 lactic acid 11.406 − − − − 0.56 0.44
07 o-cresol 12.475 2.44 1.71 3.10 2.62 1.72 1.51
08 3-pyridinol 12.577 4.61 2.95 2.05 1.69 4.67 3.67
09 p-cresol 12.767 2.62 1.74 2.51 1.86 1.30 0.91
10 heptanoic acid 12.879 0.21 0.15 − − − −
Conclusions
Invasive aquatic plants have excellent potential as sources of biomass, due to their rapid rates of growth and accumulation. Furthermore, the use of these invasive plants does not have any direct impact on food production. EDX analysis of the ashes showed high levels of macronutrients and micronutrients, which would be included in biochars, indicating the potential application of these materials in soil management.
Micropyrolysis experiments appear as an excellent tool to reveal the potential for the thermal conversion of biomass into bio-oil. In a few minutes and with a few milligrams of biomass is possible to evaluate the potential of any biomass to produce bio-oil. In this work we evaluate three invasive aquatic plants as feedstock to study the bio-oil production capacities, identifying the production of compounds including acids, sugars, alcohols, phenols, and other derivatives. Among the solvents tested for elution of the compounds from an adsorbent, THF was most efficient due to the compatibility of its polarity with that of the pyrolysate, as well as its compatibility with the derivatization agent.
The results generated in this study may lead to scale-up
actions aimed at the use of biomass for the production of biofuels or fine chemicals.
Acknowledgments
The authors are grateful to CAPES for fellowships. We also thank CNPq (Brazilian National Research Council) for financial support (process 5525818/2011-5).
References
1. Nigam, P. S.; Singh, A.; Prog. Energy Combust. Sci.2011, 37, 52.
2. Zhang, X.; Yang, W.; Blasiak, W.; J. Anal. Appl. Pyrolysis2012, 96, 110.
3. Wiggers, V. R.; Wisniewski Jr., A.; Madureira, L. A. S.; Barros, A. A. C.; Meier, H. F.; Fuel2009, 88, 2135.
4. Moraes, M. S. A.; Migliorini, M. V.; Damasceno, F. C.; Georges, F.; Almeida, S.; Zinia, C. A.; Jacques, R. A.; Caramão, E. B.; J. Anal. Appl. Pyrolysis2012, 98, 51.
5. Demiral, İ.; Kul, Ş. Ç.; J. Anal. Appl. Pyrolysis2014, 107, 17. 6. Li, Q.; Steele, P. H.; Yu, F.; Mitchell, B.; Hassan, El-B. M.;
J. Anal. Appl. Pyrolysis2013, 100, 33.
7. Menon, V.; Rao, M.; Prog. Energy Combust. Sci.2012, 38, 1.
No. Compound namea RTa / min Relative area / %
(EC) GC-MS (EC) GC-FID (EA) GC-MS (EA) GC-FID (Ny) GC-FID (Ny) GC-MS
12 benzoic acid 14.058 1.06 0.75 − − 0.41 0.13
13 glycerol 14.387 7.76 6.09 2.58 2.67 7.17 7.02
14 glycerol acetate 14.922 0.63 0.76 − − 0.68 0.93
15 o-benzenediol 15.043 7.09 5.25 3.62 3.40 7.07 6.39
16 p-methylcatechol 15.946 1.63 1.11 1.10 1.07 1.32 1.2
17 p-benzenediol 16.040 1.60 1.52 1.59 1.70 4.09 3.97
18 arabinoic acid 16.152 7.45 7.05 5.87 6.95 1.14 2.57
19 D-eythropentopyranose 16.208 3.56 3.05 − − − −
20 2-methyl-1,3-butanediol 17.276 0.76 1.72 − − − −
21 isomer of compound 20 17.495 0.92 1.12 − − 0.66 0.67
22 pyrogallol 17.887 − − − − 10.29 9.88
23 p-salicylic acid 18.038 − − − − 1.06 1.20
24 D-ribofuranose 19.215 2.48 4.13 1.60 2.15 2.04 2.57
25 levoglucosan 19.697 6.51 6.62 6.91 8.72 4.31 5.80
26 tetradecanoic acid 20.944 0.33 0.28 0.20 0.25 0.59 0.65
27 palmitoleic acid 22.736 0.36 0.73 0.24 0.04 0.24 0.50
28 n-hexadecoic acid 22.824 6.45 5.56 5.09 5.32 8.27 9.04
29 linoleic acid 24.312 1.81 1.53 1.62 1.74 4.33 5.08
30 oleic acid 24.384 2.01 1.75 0.42 0.37 4.66 4.80
31 stearic acid 24.526 0.61 0.57 1.08 1.22 1.29 1.49
32 glycerol palmitate 27.415 0.44 0.42 0.29 0.30 0.38 0.47
Total equivalent area identified 79.08 69.00 76.23 73.94 74.49 75.23
aIdentification and retention times (RT) referred to the trimethylsilyl derivatized forms. EC: Eichhornia crassipes; EA: Eichhornia azurea; Ny: Nymphaea spp.; GC-MS: gas chromatography mass spectrometry; GC-FID: gas chromatography flame ionization detection.
8. Luo, G.; Strong, P. J.; Wang, H.; Ni, W.; Shi., W.; Bioresour. Technol.2011, 102, 6990.
9. Villamagna, A. M.; Murphy, B. R.; Freshwater Biol.2010, 55, 282.
10. Malik, A.; Environ. Int.2007, 33, 122.
11. Gunnarsson, C. C.; Petersen, C. M.; Waste Manage. 2007, 27, 117.
12. Harun, M. Y.; Dayang Radiah, A. B.; Zainal Abidin, Z.; Yunus, R.; Bioresour. Technol.2011, 102, 5193.
13. Marquina, S.; Bonilla-Barbosa, J.; Alvarez, L.; Phytochemistry
2005, 66, 921.
14. Soltan, M. E.; Rashed, M. N.; Adv. Environ. Res.2003, 7, 321. 15. Lu, W.; Wang, C.; Yang, Z.; Bioresour. Technol.2009, 100,
6451.
16. Hu, Z.; Ma, X.; Li, L.; Energy Convers. Manage.2015, 94, 337. 17. AOAC International; Official Methods of Analysis of AOAC
International, 18th ed., revision 3; Horwitz, W.; Latimer Jr., G., eds.; AOAC International: Gaithersburg, 2010.
18. Sheng, C.; Azevedo, J. L. T.; Biomass Bioenergy2005, 28, 499. 19. Maciel, S. T. A.; Wisniewski Jr., A.; Souza, M. J. B.; J. Therm.
Anal. Calorim.2015, 122, 369.
20. Barbosa, L. C. A.; Espectroscopia no Infravermelho na Caracterização de Compostos Orgânicos; Editora UFV: Viçosa, 2007.
21. Yang, H.; Yan, R.; Chen, H.; Lee, D. H.; Zheng, C.; Fuel2007, 86, 1781.
22. Singh, R.; Balagurumurthy, B.; Prakash, A.; Bhasrkar, T.; Bioresour. Technol.2015, 178, 157.
23. Doumer, M. E.; Arízaga, G. G. C.; Silva, D. A.; Yamamoto, C. I.; Novotny, E. H.; Santos, J. M.; Santos, L. O.; Wisniewski Jr., A.; Andrade, J. B.; Mangrich, A. S.; J. Anal. Appl. Pyrolysis2015, 113, 434.
24. Ateş, F.; Erginel, N.; Fuel2012, 102, 681.
25. Tan, L.; Zhu, D.; Zhou, W.; Mi, W.; Ma, L.; He, W.; Bioresour. Technol.2008, 99, 4460.
26. Ghetti, P.; Ricca, L.; Angelini, L.; Fuel1995, 75, 565. 27. Haykiri-Acma, H.; Yaman, S.; Kucukbayrak, S.; Fuel Process.
Technol.2010, 91, 759.
28. Lv, G.; Wu, S.; J. Anal. Appl. Pyrolysis2012, 97, 11. 29. Uzun, B. B; Pütün, A. E.; Pütün, E.; J. Anal. Appl. Pyrolysis
2007, 79, 147.
30. Santos, J. M.; Santos, L. O.; Silva, F. F.; Eberlin, M. N.; Wisniewski, A.; BioEnergy Res. 2015, 8, 1938.
Submitted: May 20, 2017
Published online: June 29, 2017