Sleep problems and associated factors
in a rural population of a Southern
Brazilian city
Adriana Kramer Fiala MachadoI, Andrea WendtI, Fernando César WehrmeisterII
I Universidade Federal de Pelotas. Faculdade de Medicina. Programa de Pós-Graduação em Epidemiologia.
Pelotas, RS, Brasil
II Universidade Federal de Pelotas. Faculdade de Medicina. Departamento de Medicina Social. Pelotas, RS, Brasil
ABSTRACT
OBJECTIVE: To estimate the average of a sleep problems score and their associated factors in adults living in rural areas.
METHODS: A population-based cross-sectional study with individuals from the rural area of the city of Pelotas, Southern Brazil. Twenty-four of the 50 census tracts that make up the eight rural districts of the city were randomly selected. Individuals of 18 years of age or older residing in the households chosen were considered eligible. Sleep problems were measured using the Mini Sleep Questionnaire, which ranged from 10 to 70 points and the higher the score, the greater the sleep problems. The independent variables evaluated included socioeconomic, demographic, behavioral and health characteristics. In the analysis, linear regression was used, obeying a previous hierarchical model.
RESULTS: The sample consisted of 1,421 individuals. The average obtained for sleep problems was 29.4 points (95%CI 28.7–30.1). After adjusted analysis, the following variables were associated factors for greater sleep problems: female sex, age greater than or equal to 40 years, lower schooling level, depressive symptoms, pesticide poisoning, and poorer quality of life.
CONCLUSIONS: The Mini Sleep Questionnaire average in this study was 4.4 points above the cut-off point that established sleep problems. The total points found in the score was high for the rural population. Strategies to improve sleep for these individuals should be focused on higher-risk groups such as women and the elderly and those with pesticide poisoning.
DESCRIPTORS: Sleep Wake Disorders, epidemiology. Agrochemicals, adverse effects. Cross-Sectional Studies. Rural Population.
Correspondence:
Adriana Kramer Fiala Machado Rua Marechal Deodoro 1160 3º andar
96020-220 Pelotas, RS, Brasil E-mail: drikramer@hotmail.com
Received: May 31, 2017 Approved: Nov 23, 2017
How to cite: Machado AKF, Wendt A, Wehrmeister FC.Sleep problems and associated factors in a rural population of a Southern Brazilian city. Rev Saude Publica. 2018;52 Suppl 1:5s.
Copyright: This is an open-access article distributed under the terms of the Creative Commons Attribution License, which permits unrestricted use, distribution, and reproduction in any medium, provided that the original author and source are credited.
INTRODUCTION
Sleep disorders are recognized as a relevant public health problem, given the numerous
consequences that they can bring to the physical and mental well-being of individuals1.
These include increased fatigue, memory failure, attention and concentration difficulties,
non-communicable chronic diseases, and use of substances such as alcohol, tobacco, and illicit drugs2. In addition, sleep disorders can increase the risk of work accidents and traffic accidents.
In fact, one in five traffic accidents is attributed to excessive sleepiness when driving vehicles2.
In recent decades, the hectic lifestyle of societies has caused detrimental effects on individuals’ sleep3. This may explain, in part, the high prevalence of sleep disorders that are
found in several countries with different levels of economic development. In the United States, it is estimated that between 25% and 30% of the adult population is affected by some
decrease in sleep health2. In cities located in Mexico and in some South American countries
(Uruguay, Chile, and Venezuela), snoring was the most prevalent sleep problem and was present in more than half of the population aged 40 years or older4.
In Brazil, a study carried out in 132 cities found that 76% of the sample, comprised of individuals aged 16 years or older, had at least one sleep problem, with the most frequent being insufficient sleep and snoring5. In São Paulo, the difficulty of initiating sleep in adults
increased by 11% in the period between 1987 and 2007, with the prevalence being 25% in
this last year3.
Although most studies on sleep-related problems are conducted in samples with urban residents, individuals living in rural areas also have a relatively high proportion of sleep-related
problems. In Japan and China, respectively, 25.5% and 49.5% of rural individuals presented
poor sleep quality6,7. In Brazil, we found only one population-based study that evaluated the
theme in relation to the rural area, conducted with adolescents between 15 and 19 years
old8. In this study, a significant increase in the prevalence of short-term sleep was observed
between 2001 and 2011 (36.3% to 42.0%)8.
Results of research conducted in urban areas do not allow extrapolation to the rural area,
given the markedly different characteristics of the environment, quality of life, work, and
other behaviors9. Given the high prevalence of sleep problems found in urban areas, the
absence of studies on the subject in the country’s rural adult population and its impact on
health, the present study aimed to identify factors associated with sleep problems in adult residents of the countryside.
METHODS
This research was carried out in the rural area of Pelotas, Rio Grande do Sul. The city is considered the third most populous of the state, with about 330,000 inhabitants, of which approximately 7% reside in the rural zone. Data from the Brazilian Institute of Geography and Statistics (IBGE) show that the rural population of Pelotas is predominantly male (51.4%), with individuals aged between 30 and 59 years old (41.7%)10. Data collection took place from
January to July 2016, targeting individuals aged 18 years or older.
This is a cross-sectional population-based study, which is part of a larger survey investigating the health of the Pelotan population biennially since 1999, and this is the first one to include
the city’s rural area11.
The rural area of the city has 50 census tracts, divided among eight districts. The sampling process in conglomerates occurred in two stages. First, 24 census tracts were selected,
systematically, in proportion to the number of permanent residences in each district.
Considering that there were two adults per household (IBGE), it was defined that 30 houses would be visited in each census tract. Subsequently, the Google Earth software was used,
For the selection of nuclei, the site with the largest branch of streets was first found, which was called the center of the nucleus. The houses located within a radius of one kilometer of this center belonged to the same nucleus, which should contain at least five houses. The selection of the residences began by the nucleus with the greater number of houses and,
when arriving at the center of the nucleus, the direction to be traveled was drawn randomly.
If all the residences were not identified in the first direction, we returned to the center of the nucleus and proceeded to the right-most path of the first. If a total of 30 residences were not
reached in this nucleus, we moved towards the center of the second largest nucleus and the process was repeated. In each randomly selected household, we included all the residents
that were 18 years of age or older. Exclusion criteria were institutionalized individuals at the
time of the research and those with some cognitive impairment that made it impossible to answer the questionnaire.
To measure sleep problems, the Mini Sleep Questionnaire (MSQ)12, standardized and used in
Brazil, was chosen13. This instrument consists of 10 questions, each with seven possibilities
of answer ranging from never (one point) to always (seven points). Thus, the score ranges
from 10 to 70 points and the higher the score, the more sleep problems there are.
The independent variables evaluated were: gender (male, female); skin color (reported by the interviewee and categorized as white, black or brown, others); age (18 to 24, 25 to 39, 40 to 59, 60 or more complete years); assets index, based on analysis of principal components, using household goods and possessions (categorized in quintiles); has partner (no, yes); schooling in full years (zero to four, five to eight, nine or more); and place of work (not working, urban area, rural area, both).
Total physical activity, measured by the Global Physical Activity Questionnaire (GPAC) [insufficiently active (< 150 minutes/week); active (≥ 150 minutes/week)] was also included as exposures; alcohol consumption, assessed by the instrument Alcohol use disorder identification test (AUDIT) (consumption without risk < 8 points; consumption with risk ≥ 8 points); current smoking (never smoked, ex-smoker, smoker, i.e., smokes every day, at least one cigarette, during the last month); pesticide poisoning, measured by the question “Have you ever had pesticide poisoning in your life?” (never, not sure, yes, certainly); quality of life, assessed using the question from the short WHOQOL questionnaire: “How is your quality of life?” (regular, bad, very bad, good, very good); and depressive symptoms assessed by the Edinburgh Postnatal Depression Scale (EPDS) (no symptoms < 8 points, shows symptoms > 8 points). The presence of morbidities was measured using the question, “Has a doctor
or health professional ever told you that you have high blood pressure or blood sugar?”.
Finally, weight and height were measured to calculate the body mass index (BMI), which was categorized according to the World Health Organization (WHO) criteria14 (≤ 24.9 kg/m²,
25.0 kg/m² to 29.9 kg/m², ≥ 30.0 kg/m²).
The information was collected by trained and standardized interviewers for the measurement of anthropometric data. The data was entered via tablets by the RedCap software.
The different aspects of sleep present in the questionnaire were evaluated by the proportions of each of their 10 questions. The answers were categorized into: never; very rarely or rarely; sometimes; often, very often or always.
Statistical analyzes were carried out using the svy command in Stata version 13.1 (Stata Corporation, College Station, USA), in order to consider the effect of cluster sampling. The sample
was described by the proportion of individuals in each category of the variables, as well as the mean
Table 1. Description of the sample and score averages of sleep problems in adults living in the rural area of Pelotas, State of Rio Grande do Sul, Brazil, 2016. (n = 1,421)
Variable Total MSQ pa
n (%) Average (95%CI)
Gender < 0.001
Male 686 (48.2) 27.6 (26.8–28.5)
Female 735 (51.8) 31.0 (30.2–31.8)
Skin color 0.927
White 1,211 (85.0) 29.3 (28.6–30.1)
Black or brown 181 (12.9) 29.4 (28.2–30.7)
Others 29 (2.1) 30.0 (25.9–34.1)
Age (years) < 0.001
18–24 166 (11.7) 26.3(24.9–27.7)
25–39 333 (23.6) 28.7 (27.6–29.8)
40–59 561 (39.5) 30.3 (29.3–31.3)
60 or older 361 (25.2) 30.0 (29.0–30.8)
Romantic partner 0.002
No 400 (28.2) 28.0 (27.0–28.9)
Yes 1,021 (71.8) 29.9 (29.1–30.7)
Education (complete years) < 0.001b
0–4 524 (37.1) 30.8 (29.7–32.0)
5–8 528 (37.2) 29.3 (28.6–30.0)
9 or more 364 (25.7) 27.4 (26.6–28.1)
Assets index (quintiles) 0.440
5th (richest) 290 (18.8) 29.9 (28.4–31.4)
4th 296 (19.9) 29.7 (28.4–30.9)
3rd 282 (20.0) 30.0 (28.5–31.4)
2nd 283 (20.8) 29.7 (27.8–30.0)
1st (poorest) 260 (20.5) 28.9 (28.4–31.4)
Workplace 0.001
Urban area 123 (8.7) 26.9 (25.6–28.3)
Rural area 689 (48.4) 29.2 (28.1–30.2)
Both 59 (4.1) 28.1 (26.0–30.3)
Is unemployed 549 (38.8) 30.3 (29.4–31.2)
Pesticide poisoning < 0.001
Never 1,226 (86.5) 29.0 (28.3–29.7)
Uncertain 109 (7.5) 31.8 (30.3–33.4)
Certain 85 (6.0) 31.9 (30.0–33.9)
Smoking 0.433
No 925 (64.8) 29.2 (28.2–30.1)
Yes 229 (16.4) 30.0 (28.8–31.2)
Former smoker 267 (18.8) 29.5 (28.5–30.4)
Alcohol consumption 0.983
No risk 1,300 (94.0) 29.4 (28.7–30.0)
At risk 121 (6.0) 29.4 (27.7–31.1)
Physical activity 0.748
Active 1,157 (84.8) 29.3 (28.6–30.0)
Inactive 208 (15.2) 29.5 (28.2–30.8)
Depression (symptoms) < 0.001
No 900 (64.5) 26.8 (26.2–27.4)
Yes 492 (35.5) 34.1 (33.3–34.9)
Nutritional status (BMI)c 0.030
Low weight/Eutrophic 475 (35.1) 28.8 (27.8–29.8)
Overweight 480 (35.2) 29.2 (28.1–30.2)
Obesity 404 (29.7) 30.2 (29.4–31.1)
Quality of life < 0.001
Very good 185 (13.0) 25.5 (24.3–26.8)
Good 917 (64.5) 29.0 (28.1–29.8)
Very bad/Bad/Fair 318 (22.5) 32.8 (31.8–33.7)
Hypertension < 0.001
No 946 (66.8) 28.2 (27.3–29.1)
Yes 473 (33.2) 31.9 (30.9–32.9)
Diabetes < 0.001
No 1,282 (90.2) 29.1 (28.4–29.8)
Yes 137 (9.8) 32.5 (31.0–34.0)
Average Score (MSQ) 1,421 (100) 29.4 (28.7–30.1)
MSQ: Mini Sleep Questionnaire; BMI: body mass index
a Heterogeneity p-value. b Trend p-value.
and pesticide intoxication; and at the level most proximal to the outcome, depressive symptoms, quality of life, BMI, hypertension and diabetes. The stepwise regression model was used, in which all the variables of the first hierarchical level were introduced, and then those with p > 0.20 were excluded. The variables of the second level were adjusted for all those of the same level plus those
of the previous level that remained in the model, repeating this procedure for the other levels.
Factors associated with the outcome were considered as those with p < 0.05.
The project was approved by the Ethics Committee of the Faculdade de Medicina of the Universidade Federal de Pelotas (Approval 1.363.979). All participants signed the informed
consent form.
Figure. Frequency of Mini Sleep Questionnaire items, according to gender, in adults living in the rural area of Pelotas, State of Rio Grande do Sul, Brazil, 2016.
36% 29% 26% 9%
24% 29% 34% 13%
23% 34% 30% 13%
28% 26% 28% 18%
69% 5% 6% 20%
25% 28% 28% 19%
23% 24% 31% 22%
39% 19% 24% 18%
9% 30% 37% 24%
28% 21% 27% 24%
Wakes up with a headache Feels tired for no apparent reason Wakes up at dawn and does not go back to sleep Has trouble falling asleep at night Uses sedatives or sleeping pills Has restless sleep with changes of position Wakes up and still feels tired Snores Wakes up at night Sleeps during the day
Never Very rarely/Rarely
Sometimes Often/Very often/Always
Never Very rarely/Rarely
Sometimes Often/Very often/Always
52% 30% 14% 4%
35% 36% 24% 5%
33% 34% 22% 11%
39% 33% 18% 10%
85% 4% 3% 8%
25% 31% 27% 17%
27% 27% 32% 14%
35% 19% 25% 21%
13% 34% 31% 22%
23% 26% 25% 26%
0% 10% 20% 30% 40% 50% 60% 70% 80% 90% 100%
0% 10% 20% 30% 40% 50% 60% 70% 80% 90% 100%
Wakes up with a headache Feels tired for no apparent reason Wakes up at dawn and does not go back to sleep Has trouble falling asleep at night Uses sedatives or sleeping pills Has restless sleep with changes of position Wakes up and still feels tired Snores Wakes up at night Sleeps during the day Men
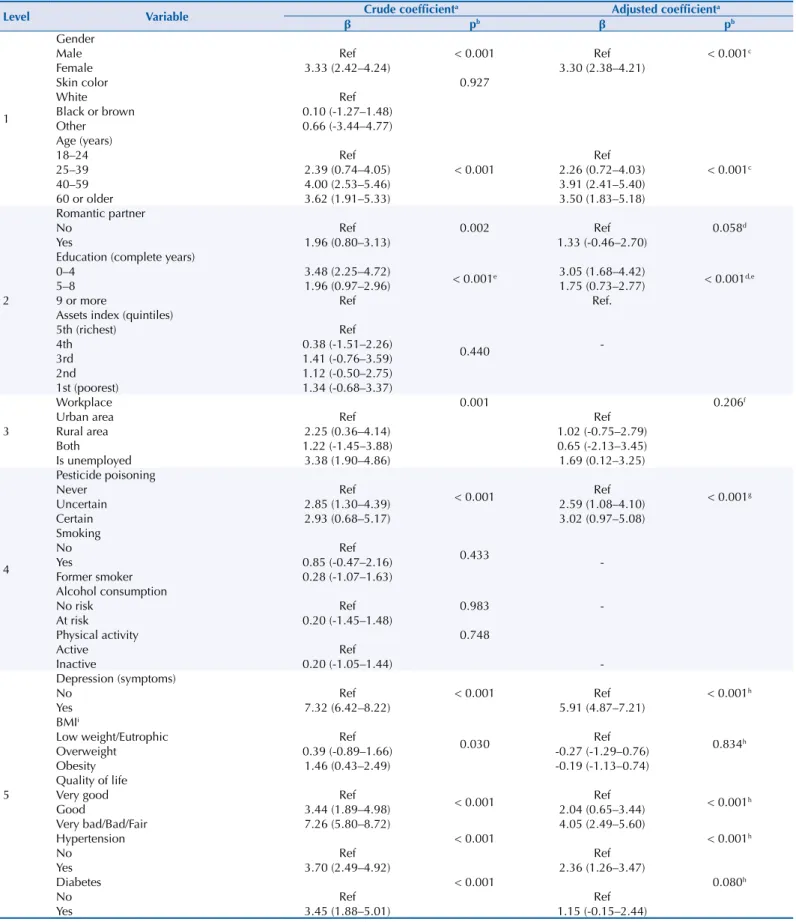
Table 2. Associations between sleep problems and independent variables in adults living in the rural area of Pelotas, State of Rio Grande do Sul, Brazil, 2016.
Level Variable β Crude coefficienta Adjusted coefficienta
pb β pb
1
Gender
< 0.001 < 0.001c
Male Ref Ref
Female 3.33 (2.42–4.24) 3.30 (2.38–4.21)
Skin color 0.927
White Ref
Black or brown 0.10 (-1.27–1.48)
Other 0.66 (-3.44–4.77)
Age (years)
< 0.001 < 0.001c
18–24 Ref Ref
25–39 2.39 (0.74–4.05) 2.26 (0.72–4.03)
40–59 4.00 (2.53–5.46) 3.91 (2.41–5.40)
60 or older 3.62 (1.91–5.33) 3.50 (1.83–5.18)
2
Romantic partner
0.002 0.058d
No Ref Ref
Yes 1.96 (0.80–3.13) 1.33 (-0.46–2.70)
Education (complete years)
< 0.001e < 0.001d,e
0–4 3.48 (2.25–4.72) 3.05 (1.68–4.42)
5–8 1.96 (0.97–2.96) 1.75 (0.73–2.77)
9 or more Ref Ref.
Assets index (quintiles)
0.440
5th (richest) Ref
4th 0.38 (-1.51–2.26)
-3rd 1.41 (-0.76–3.59)
2nd 1.12 (-0.50–2.75)
1st (poorest) 1.34 (-0.68–3.37)
3
Workplace 0.001 0.206f
Urban area Ref Ref
Rural area 2.25 (0.36–4.14) 1.02 (-0.75–2.79)
Both 1.22 (-1.45–3.88) 0.65 (-2.13–3.45)
Is unemployed 3.38 (1.90–4.86) 1.69 (0.12–3.25)
4
Pesticide poisoning
< 0.001 < 0.001g
Never Ref Ref
Uncertain 2.85 (1.30–4.39) 2.59 (1.08–4.10)
Certain 2.93 (0.68–5.17) 3.02 (0.97–5.08)
Smoking
0.433
No Ref
Yes 0.85 (-0.47–2.16)
-Former smoker 0.28 (-1.07–1.63)
Alcohol consumption
0.983
No risk Ref
-At risk 0.20 (-1.45–1.48)
Physical activity 0.748
Active Ref
Inactive 0.20 (-1.05–1.44)
-5
Depression (symptoms)
< 0.001 < 0.001h
No Ref Ref
Yes 7.32 (6.42–8.22) 5.91 (4.87–7.21)
BMIi
0.030 0.834h
Low weight/Eutrophic Ref Ref
Overweight 0.39 (-0.89–1.66) -0.27 (-1.29–0.76)
Obesity 1.46 (0.43–2.49) -0.19 (-1.13–0.74)
Quality of life
< 0.001 < 0.001h
Very good Ref Ref
Good 3.44 (1.89–4.98) 2.04 (0.65–3.44)
Very bad/Bad/Fair 7.26 (5.80–8.72) 4.05 (2.49–5.60)
Hypertension < 0.001 < 0.001h
No Ref Ref
Yes 3.70 (2.49–4.92) 2.36 (1.26–3.47)
Diabetes < 0.001 0.080h
No Ref Ref
Yes 3.45 (1.88–5.01) 1.15 (-0.15–2.44)
BMI: body mass index; Ref: reference
a Linear Regression. b Heterogeneity p-value. c Adjustments: sex and age.
d Adjustments: sex, age, partner, and schooling. e Trend p-value.
f Adjustments: sex, age, partner, schooling, and place of work. g Adjustments: sex, age, partner, schooling, and pesticide poisoning.
RESULTS
A total of 1,697 individuals were identified as eligible, of which 1,519 were interviewed, totaling 87 (5.1%) losses and 91 (5.4%) refusals. The average age between losses and refusals was 42.2 years (SD = 17.1), different from the one found in the sample, 47.8 (SD = 17.4, p = 0.007). The percentage of men among the losses and refusals was 70.8%, while in the sample, only 48.3% (p < 0.001). Sixty-six individuals (3.9%) did not respond to any question about the outcome and were considered as losses. Thus, information on sleep problems was obtained from 1,421 individuals, which is the final sample of the study.
The result of the interaction test for the sex variable was not significant. Table 1 shows the
general characteristics of the sample and the average in the MSQ score according to each
category of variables. The sample average in the score was 29.4 (95%CI 28.7–30.1). The
individuals with the highest scores, that is, more sleep problems, were: female, aged between
40 and 59 years old, living with a partner, with less schooling, who did not work, who had
poisoning by pesticide, with symptoms of depression, obese, hypertensive, diabetic, and with worse quality of life.
The figure shows the frequencies of each MSQ question according to sex. In general, the female sex reported more sleep problems. Using sedatives or sleeping pills very often, often
or always had an occurrence about twice as high in women as in men, while snoring and sleeping during the day were reported more consistently by males.
Table 2 presents the crude and adjusted coefficients of the association between sleep problems and independent variables. After an adjusted analysis, the women had a higher risk of presenting sleep problems, averaging 3.30 points higher in the score than the men. Those aged 40 years or older had more sleep problems than younger people (18–24 years). The schooling presented an inverse relation with sleep problems, i.e., individuals with
lower schooling presented higher averages in the score. Among those who had pesticide
poisoning, the score was, on average, 3.02 points higher than individuals who did not have
it. People who presented symptoms of depression and reported regular, poor or very poor
quality of life scored, on average, respectively, 5.19 and 4.05 more when compared to their counterparts. Hypertensive individuals had a score of 2.36 points, on average, higher than
those without hypertension.
DISCUSSION
The average sample score in the MSQ was high, 4.4 points higher than the limit determined by the instrument (25 points). Being female, 40 years of age or older, having less schooling,
having been poisoned by pesticides, presenting depressive symptoms and reporting a normal, poor or very poor quality of life were the characteristics associated with more sleep problems.
It is possible that there is a direct relationship between higher scores in the MSQ score and worse health condition of individuals. According to Buysse15, sleep health is a multidimensional
pattern of sleep-wakefulness, adapted to individual, social, and environmental demands, that
promotes physical and mental well-being. Therefore, changes in its quality and duration may increase the risk of adverse effects such as morbidity and even mortality. We emphasize
that there were no studies that used MSQ to evaluate the sleep of individuals living in rural
areas; therefore, the comparison between the results should be done with caution. However, research using other methods have shown that sleep disorders affect a good part of this
population7,9. In Japan, the mean score obtained on the Pittsburgh Sleep Quality Index
(PSQI) in adults was 4.9 points; and the PSQI considers as sleep problems scores equal to or greater than five16. Li et al.7, using this same instrument, found an average score of 7.7
points in Chinese elderly. In Canada, both in urban and rural areas, 15.9% of those aged 18 years or older present excessive daytime sleepiness as measured by the Epworth Sleepiness
generally shown in the form of prevalence, which varies widely. These differences probably occur due to the lack of standardization in sleep measurements (quality, problem, insomnia or its symptoms, disorders), the different instruments used, the period evaluated (last month, last year, lifetime) and the different populations studied (adolescents, adults or elderly).
When assessing MSQ questions separately, we found that the most frequently reported situation in the sample was sleeping during the day. We observed that the sample studied
awakens early in the morning, possibly due to work in the field, and returns to the house
for lunch, remaining there until the climax of the heat decreases. Sleeping during the day, therefore, was set up as a habit in this population, not a behavior suggestive of sleep problems.
In principal component analysis (PCA) (data not shown) including the 10 variables of the questionnaire, we verified that the MSQ score has a correlation coefficient of 0.96 (p < 0.001) with the score generated by the PCA. In addition, the behavior of sleeping during the day,
even though the issue was reported more frequently, was the one that had less weight in
the sum of the score (0.007).
In the present study, women presented worse average scores, which is consistent with
the literature findings18–20. A multicenter study with urban and rural data from low- and
middle-income countries showed that men are 23% less likely to present sleep complaints19.
Hormonal, behavioral, and psychological factors may be responsible for this association. In younger women, biological factors such as motherhood can adversely affect sleep, whereas in
later ages, menopause may lead to worsening of the sleep quality21. In addition, anxiety and
depression, known to be more frequent in females, may also be present in this relationship21.
It is widely reported in the literature that the occurrence of sleep problems tends to increase with age7,18,19,21. However, in this study, this trend was not observed, considering that the
risk of presenting the outcome was not different above 40 years of age. It is possible that
the elderly did not present the worst result due to the occurrence of survival bias, in which older individuals with poorer sleep quality and a greater burden of chronic diseases did not participate in the study since they have already died. Another factor that could lead to the
observed result is the possibility that sleep perception may be different in the elderly, which
may result in fewer complaints22.
The findings on the association between sleep problems and educational level in the literature
are inconclusive. In middle- and lower-income countries, having a higher education level
reduced the risk of complaining of sleep problems by 6%; in China, presenting lower levels of education reduced the risk of snoring and apnea by 27%. Nonetheless, other studies did not find associations18,21. However, lower schooling leads to manual occupational activities and
long hours of work, which may contribute to an increase in the occurrence of sleep disorders9.
In addition, a higher educational level is associated with health-promoting behaviors, thus
preventing events that may cause sleep problems9.
There are numerous consequences of the use of pesticides on human health, among them
neurobehavioral alterations24. Central nervous system dysfunctions due to the use of these
pesticides can lead to insomnia or disturbed sleep, excessive dreams or nightmares24. In China, researchers have observed a higher occurrence of excessive daytime sleepiness among those
who have been exposed to organophosphates for longer25. In European countries, exposure
to pesticides was a potential risk factor for REM (rapid eye movement) disorders26.
The literature has suggested that leisure physical activity promotes sleep quality
improvement19, but this relationship was not found in our study. This may have occurred
due to the fact that almost all the participants performed physical activity only at work, and physical activity was practically non-existent. Physical activity in leisure has been associated with better health conditions and, consequently, better sleep19. Excessive physical activity
at work can be detrimental to health and sleep. Akerstedt et al.27 argue that both the high
demands of work and the physical effort performed in this environment have a negative
The association between the presence of depressive symptoms and increased sleep problems
found in this study is consistent with the literature18,19,21. Serotonin, the key hormone in
sleep regulation, is decreased during a depressive episode, often leading to insomnia. On
the other hand, changes in the circadian rhythm, such as changes in usual sleeping time
and sleep deprivation, may induce depressive symptoms. Therefore, changes in sleep may
occur before the depressive episode, in its early stages, or may be a residual symptom of non-responsive depression28.
The relationship between sleep problems and quality of life found here is also described by other investigations. In China, a study of individuals between 15 and 34 years old found
worse quality of life in those with insomnia or sleep disorders18. The possible mechanism
for this association is that problems in sleep can affect the ability of the immune system to
function properly, impair performance in school, work and social activities, as well as have a great physical, mental and emotional impact on overall quality of life29. This relationship
may also occur indirectly, since poorer sleep quality is associated with the development of chronic diseases, such as hypertension and diabetes20,30, which in turn may have a negative
impact on quality of life29.
Hypertensive individuals presented greater sleep problems: the relationship between these variables is bidirectional. Sleep deprivation can affect the sympathetic nervous system and
alter the secretion of cortisol and antidiuretic hormone, increasing blood pressure31. On the
other hand, the lower cerebral blood flow caused by hypertension can be offset by increased flow in other areas of the brain and these changes over time can manifest as sleep disorders32.
Furthermore, the use of diuretics to control blood pressure intensifies the need to urinate,
which can increase the fragmentation of sleep.
In this study, we did not find an association of sleep quality with alcohol consumption, smoking, and BMI. In a complementary analysis (data not shown), we could observe that the
occurrence of snoring was greater in those who were obese and smokers, but this association
was not maintained when we evaluated the questionnaire as a whole. These factors seem
to be more related to respiratory sleep disorders than to their quality23,32. Regarding alcohol
consumption, some studies have shown that this relationship seems to depend on the number of doses ingested and the stage of use33.
When interpreting the results presented here, one should consider some limitations of the
study. The cross-sectional design does not allow us to infer causality in some associations,
such as depression, quality of life, and hypertension, considering the bidirectional relationship
that these variables may present with sleep problems. However, this outline has the potential to raise hypotheses and subsidize public health policies. The absence of information regarding
the type, the workload, and the work shift did not allow for a more detailed analysis of its
relationship to the outcome. The percentage of losses and refusals obtained (14.4%) should be noted: these individuals presented characteristics (greater percentage of men and youngest individuals) different from the sample. This may suggest an overestimation of the results,
since losses and refusals include individuals who, according to the literature18,19,21, have fewer
sleep problems. In addition, the questionnaire used by this study is not validated for rural
populations. As rural dwellers present different characteristics and behaviors when compared to the urban population, the questions present in the instrument may not reflect the real distribution of the sleep problems of this sample. However, a pilot study was conducted
to verify the understanding of the questionnaire and to minimize this possible limitation.
Aspects related to sleep are rarely studied in rural areas, be it in Brazil or in the world. The MSQ average in this study was 4.4 points higher than the cutoff point that established sleep problems. The associated factors were female gender, age of 40 years or older, less schooling,
REFERENCES
1. Daley M, Morin CM, LeBlanc M, Grégoire JP, Savard J. The economic burden of insomnia: direct and indirect costs for individuals with insomnia syndrome, insomnia symptoms, and good
sleepers. Sleep. 2009;32(1):55-64. https://doi.org/10.5665/sleep/32.1.55
2. National Institutes of Health, Nacional Center on Sleep Disorders Research. National Institutes of Health Sleep Disorders Research Plan. Bethesdda: NIH; 2011 [cited 2018 Feb 12]. (NHI Publication Nº 11-7820). Available from: https://www.nhlbi.nih.gov/files/docs/ncsdr/201101011 NationalSleepDisordersResearchPlanDHHSPublication11-7820.pdf
3. Santos-Silva R, Bittencourt LRA, Pires MLN, Mello MT, Taddei JA, Benedito-Silva AA, et al.
Increasing trends of sleep complaints in the city of Sao Paulo, Brazil. Sleep Med. 2010;11(6)
520-4. https://doi.org/10.1016/j.sleep.2009.12.011
4. Bouscoulet LT, Vázquez-Garcia JC, Muiño A, López MV, Montes de Oca M, et al. Prevalence of
sleep related symptoms in four Latin American cities. J Clin Sleep Med. 2008;4(6) 579-85.
5. Hirotsu C, Bittencourt L, Garbuio S, Andersen ML, Tufik S. Sleep complaints in the
Brazilian population: impact of socioeconomic factors. Sleep Sci. 2014;7(3):135-42.
https://doi.org/10.1016/j.slsci.2014.08.001
6. Nakajima S, Inoue Y, Sasai T, Okajima I, Komada Y, Nomura T, et al. Impact of frequency of nightmares comorbid with insomnia on depression in Japanese rural community residents: a
cross-sectional study. Sleep Med. 2014;15(3):371-4. https://doi.org/10.1016/j.sleep.2013.11.785
7. Li J, Yao YS, Dong Q, Dong YH, LIU JJ, Yang LS, et al. Characterization and factors associated
with sleep quality among rural elderly in China. Arch Gerontol Geriatr. 2013;56(1):237-43.
https://doi.org/10.1016/j.archger.2012.08.002
8. Hoefelmann LP, Lopes AS, Silva KS, Moritz P, Nahas MV. Sociodemographic factors associated with sleep quality and sleep duration in adolescents from Santa Catarina, Brazil: what changed between
2011 and 2011? Sleep Med. 2013;14(10):1017-23. https://doi.org/10.1016/j.sleep.2013.05.015
9. Zanuto EAC, Lima MCS, Araújo RG, Silva EP, Anzolin CC, Araújo MYC, et al. Distúrbios do
sono em adultos de uma cidade do Estado de São Paulo. Rev. Bras Epidemiol. 2015;18(1):42-53.
https://doi.org/10.1590/1980-5497201500010004
10. Instituto Brasileiro de Geografia e Estatística. Censo demográfico 2010. Brasília (DF): IBGE; 2010 [cited 2018 Feb 12]. Available from: http://www.censo2010.ibge.gov.br/
11. Barros AJD, Menezes AMB, Santos IS, Assunção MCF, Gigante D, Fassa AG, et al. O
Mestrado do Programa de Pós-graduação em Epidemiologia da UFPel baseado em consórcio
de pesquisa: uma experiência inovadora. Rev Bras Epidemiol. 2008;11 Supl 1:133-44.
https://doi.org/10.1590/s1415-790x2008000500014
12. Zomer J, Peled R, Rubin AH, Lavie P. Mini Sleep Questionnaire (MSQ) for screening large population for EDS complaints. In: Koella WP, Ruether E, Schulz H, editors. Sleep’84:
proceedings of the 7. European Congress on Sleep Research; 3-7 Sep 1984; Munich, Germany. Basel: Karger; 1985; p.469-70.
13. Falavigna A, Bezerra MLS, Teles AR, Kleber FD, Velho MC, Silva RC, et al. Consistency and reliability of the Brazilian Portuguese version of the Mini-Sleep Questionnaire in undergraduate
students. Sleep Breath. 2011;15(3):351-5. https://doi.org/10.1007/s11325-010-0392-x
14. World Health Organization. Obesity: preventing and managing the global epidemic: report of a World Health Organization Consultation. Geneva: WHO; 2000 [cited 2018 Feb 12]. (Technical Report Series, 284). Available from: http://www.who.int/nutrition/publications/obesity/WHO_TRS_894/en/
15. Buysse DJ. Sleep health: can we define it? Does it matter? Sleep. 2014;37(1):9-17.
https://doi.org/10.5665/sleep.3298
16. Hayashino Y, Yamazaki S, Takegami M, Nakayama T, Sokejima S, Fukuhara S. Association between number of comorbid conditions, depression, and sleep quality using the Pittsburgh
Sleep Quality Index: results from a population-based survey. Sleep Med. 2010;11(4):366-71.
https://doi.org/10.1016/j.sleep.2009.05.021
17. Gjevre JA, Pahwa P, Karunanayake CP, Hagel L, Rennie DC, Lawson J, et al. Excessive
daytime sleepiness among rural residents in Saskatchewan. Can Respir J. 2014;21(4):227-33.
https://doi.org/10.1155/2014/921541
18. Chiu HF, Xiang Y, Dai J, Chan SS, Leung T, Yu X, et al. The prevalence of sleep problems and
their socio-demographic and clinical correlates in young Chinese rural residents. Psychiatry Res.
19. Mazzotti DR, Guindalini C, Sosa AL, Ferri CP, Tufik S. Prevalence and correlates for sleep complaints in older adults in low and middle income countries: a 10/66 Dementia Research
Group study. Sleep Med. 2012;13(6):697-702. https://doi.org/10.1016/j.sleep.2012.02.009
20. Wang T, Lu J, Wang W, Mu Y, Zhao J, Liu C, et al. Sleep duration and snoring associate with
hypertension and glycaemic control in patients with diabetes. Diabet Med. 2015;32(8):1001-7.
https://doi.org/10.1111/dme.12809
21. Stranges S, Tigbe W, Gomez-Olivé F, Thorogood M, Kandala N. Sleep problems: an emerging global epidemic? Findings from the INDEPTH WHO-SAGE STUDY among more than
40,000 older adults from 8 countries across Africa and Asia. Sleep. 2012;35(8):1173-81.
https://doi.org/10.5665/sleep.2012
22. Vitiello MV, Larsen LH, Moe KE. Age-related sleep change: gender and estrogen effects on the subjective-objective sleep quality relationships of healthy, noncomplaining older men and
women. J Psychosom Res. 2004;56(5):503-10. https://doi.org/10.1016/S0022-3999(04)00023-6
23. Liu J, Wei C, Huang L, Wang W, Liang D, Lei Z, et al. Prevalence of signs and symptoms
suggestive of obstructive sleep apnea syndrome in Guangxi, China. Sleep Breath.
2014;18(2):375-82. https://doi.org/10.1007/s11325-013-0896-2
24. Londres F. Agrotóxicos no Brasil: um guia para ação em defesa da vida. Rio de Janeiro: Assessoria e Serviços a Projetos em Agricultura Alternativa; 2011 [cited 2018 Feb 12]. Available from: http://aspta.org.br/wp-content/uploads/2011/09/Agrotoxicos-no-Brasil-mobile.pdf 25. Zhou ZJ. Health problem caused by long-term organophosphorus pesticides. In: Stoytcheva
M, editor. Pesticides in the modern world: effects of pesticides exposure. London: INTECH; 2011 [cited 2018 Feb 13]. Available from: https://www.intechopen.com/books/pesticides-in-the-modern-world-effects-of pesticides-exposure/health-problem-caused-by-long-term-organophosphorus-pesticides-exposure-study-in-china
26. Postuma RB, Montplaisir JY, Pelletier A, Dauvilliers Y, Oertel W, Iranzo A, et al.
Environmental risk factors for REM sleep behavior disorder. Neurology. 2012;79(5):428-34.
https://doi.org/10.1212/WNL.0b013e31825dd383
27. Åkerstedt T, Knutsson A, Westerholm P, Theorell T, Alfredsson L, Kecklund G. Sleep disturbances,
work stress and work hours a cross-sectional study. J Psychosom Res. 2002;53(3):741-8.
https://doi.org/10.1016/S0022-3999(02)00333-1
28. Chellapa SL, Araujo JF. Qualidade subjetiva do sono em pacientes com transtorno depressivo.
Estud Psicol (Natal). 2007;12(3):269-74. https://doi.org/10.1590/S1413-294X2007000300009
29. Chen X, Gelaye B, Williams MA. Sleep characteristics and health-related quality of life among
a national sample of American young adults: assessment of possible health disparities. Qual Life
Res. 2014;23(2):613-25. https://doi.org/10.1007/s11136-013-0475-9
30. Del Brutto OH, Mera RM, Zambrano M, Del Brutto VJ, Castillo PR. Association between sleep
quality and cardiovascular health: a door-to-door survey in rural Ecuador. Environ Health Prev
Med. 2014;19(3):234-7. https://doi.org/10.1007/s12199-014-0379-5
31. Cha DS, Patel HP, Hains DS, Mahan JD.The effects of hypertension on cognitive functionin
children and adolescents. Int J Pedriatr. 2012:891094. https://doi.org/10.1155/2012/891094
32. Kim KS, Kim JH, Park SY, Won HR, Lee HJ, Yang HS, et al. Smoking induces oropharyngeal
narrowing and increases the severity of obstructive sleep apnea syndrome. J Clin Sleep Med.
2012;8(4):367-74. https://doi.org/10.5664/jcsm.2024
33. Garcia AN, Salloum IM. Polysomnographic sleep disturbances in nicotine, caffeine, alcohol,
cocaine, opioid, and cannabis use: a focused review. Am J Addict. 2015;24(7):590-8.
htps://doi.org/10.1111/ajad.12291
Funding: Programa de Excelência Acadêmica of the Coordenação de Aperfeiçoamento de Pessoal do Nível Superior (PROEX/CAPES – Process 23038.002445/2015-97, benefit number 1012/2015).
Authors’ Contribution: Data analysis and interpretation: AKFM, AW, FCW. Manuscript writing: AKFM, AW. Manuscript critical review: AKFM, AW, FCW. All authors have approved the final version of the manuscript and
assume public responsibility for its content.