Received: 04 June 2018 Accepted: 18 January 2019 Published: 27 April 2020 Copyright: © 2019 Girotto et al.
This is an open access article distributed under a Creative Commons Attribution License
(CC BY), which allows for unrestricted use, distribution, and reproduction, as long as the original source is credited.
Funding: Fundação de Amparo
à Pesquisa e Inovação do Estado de Santa Catarina (FAPESC); Universidade do Estado de Santa Catarina (UDESC/CAV).
Publisher:
..REVIEW ARTICLE..
Evaluation of characterization models for the
photochemical smog impact category focused
on the Brazilian reality
Avaliação de modelos de caracterização para a categoria de
impacto smog fotoquímico voltada à realidade brasileira
Evaluación de modelos de caracterización para la categoría de
impacto smog fotoquímico enfocado en la realidad brasileña
Sandy Bernardi Falcadi Tedesco Girotto1*
Flávio José Simioni1
Yara de Souza Tadano2
Valdeci José Costa1
Rodrigo Augusto Freitas de Alvarenga3
1 Universidade do Estado de Santa Catarina, Florianópolis, SC, Brasil
2 Campus Ponta Grossa, Universidade Tecnológica Federal do Paraná, Ponta Grossa, PR, Brasil 3 Faculty of Bioscience Engineering, Ghent University, Ghent, Belgium
Abstract
The Life Cycle Impact Assessment (LCIA) is composed of characterization models, and in Brazil, the methodological and scientific LCIA framework is still under development. The research’s aim was to evaluate the literature available characterization models to photochemical smog category. Thus, the contribution of work is recommending one of these models to be used in Brazilian LCA studies, standardizing the studies in Brazil. The methodology consisted of searching the literature and selecting, describing and analyzing the characterization models as well as elaborating a table of criteria for better comparison. Aiming to visualize the differences in the results of each selected model, a case study was applied to analyze the photochemical smog formation potential to the transport of one ton of sugar using two transportation modes (road and railroad). Five characterization models related to smog category were selected, described and compared. Herewith, it was observed that the models present significant differences, that is, each model presents Characterization Factors (CF) for different categories within the environmental impact chain of the photochemical smog (midpoint and/or endpoint), differences in modeling, scale of the model (regional, continental or global), quantity and quality of elementary flows, etc. Those factors have influence in the CF’s calculation and, consequently, the LCA’s results, in the same case study. The criteria table’s results suggested that the model of Van Zelm et al. (2016) – World (midpoint and endpoint), is the best interim option to be used in studies of LCA in Brazil, because it was the model that resulted in the highest grade referring to the established criteria and it presents results on a Global scale. However, the results do not rule out the need for regionalization studies, which would develop a model that presents results and studies directed to the Brazilian reality or adjust the model of Van Zelm et al. (2016) - Brazil.
Keywords: Life Cycle Assessment. Life Cycle Impact Assessment. LCIA methods. Tropospheric ozone. Characterization Factors. Regionalization of models.
Resumo
A Avaliação de Impacto do Ciclo de Vida (AICV) é composta por modelos de caracterização e, no Brasil, a estrutura metodológica e científica da AICV está em desenvolvimento. O objetivo desta pesquisa foi avaliar os modelos de caracterização para a categoria de impacto smog fotoquímico presentes na literatura. Assim, a contribuição do trabalho é recomendar um destes modelos para ser utilizado em estudos brasileiros de ACV, padronizando os estudos no Brasil. A metodologia consistiu de pesquisa na literatura e na seleção, descrição e análise dos modelos de caracterização, como também na elaboração de uma tabela de critérios para melhor comparação. Com o objetivo de visualizar as diferenças nos resultados de cada modelo selecionado, um estudo de caso foi aplicado para analisar o potencial de formação de smog fotoquímico do transporte de uma tonelada de açúcar usando dois modais de transporte (rodoviário e ferroviário). Após a pesquisa, cinco modelos de caracterização relacionados a categoria de impacto smog foram selecionados, descritos e comparados. Com isso, observou-se que os modelos apreobservou-sentam diferenças significativas, ou observou-seja, cada modelo apresenta Fatores de Caracterização (FC) para diferentes categorias dentro da cadeia de impacto ambiental do smog fotoquímico (ponto médio e/ou ponto final), diferenças na modelagem, na escala do modelo (regional, continental ou global), na quantidade e qualidade dos fluxos elementares, etc. Esses fatores influenciam no cálculo do FC e, consequentemente, nos resultados de uma ACV, para um mesmo estudo de caso. Os resultados da tabela de critérios sugerem o modelo de Van Zelm et al. (2016) - Global (ponto médio e ponto final), como uma boa opção provisória a ser utilizado em estudos de ACV no Brasil, pois este foi o modelo que resultou na maior nota referente aos critérios estabelecidos, sendo que apresenta resultados em escala Global. Entretanto, os resultados não descartam a necessidade de estudos de regionalização, voltados à realidade brasileira. Outra possibilidade apontada é a ampliação e ajuste do modelo de Van Zelm et al. (2016) - Brasil. Palavras-chave: Avaliação do Ciclo de Vida. Avaliação de Impacto do Ciclo de Vida. Métodos de AICV. Ozônio troposférico. Fatores de Caracterização. Regionalização de modelos.
Resumen
La Evaluación de Impacto del Ciclo de Vida (EICV) se compone de modelos de caracterización, y en Brasil, la estructura metodológica y científica de la EICV está en desarrollo. El objetivo de esta investigación fue evaluar los modelos de caracterización para la categoría de impacto smog fotoquímico presentes en la literatura. Por lo tanto, la contribución del trabajo es recomendar uno de estos modelos para ser utilizado en estudios brasileños de ECV, estandarizando estudios en Brasil. La metodología consistió en la investigación en la literatura y selección, descripción y análisis de los modelos de caracterización, así como en la elaboración de una tabla de criterios para una mejor comparación. Con el objetivo de visualizar las diferencias en los resultados de cada modelo seleccionado, se usó un estudio de caso para analizar el potencial de formación de smog fotoquímico del transporte de una tonelada de azúcar usando dos modales de transporte (carretera y ferrocarril). Después de la investigación, cinco modelos de caracterización relacionados con la categoría de impacto smog fueron seleccionados, descritos y comparados. Con ello, se observó que los modelos difieren significativamente, o sea, cada modelo presenta Factores de Caracterización (FC) para diferentes categorías dentro de la cadena de impacto ambiental del smog fotoquímico (punto medio y/o punto final), diferencias en el modelado, en la escala del modelo (regional, continental o global), en la cantidad y calidad de los flujos elementales, etc. Estos factores influyen en el cálculo del FC y, consecuentemente, en los resultados de una ECV, para un mismo estudio de caso. Los resultados de la tabla de criterios sugieren el modelo de Van Zelm et al. (2016) - Global (punto medio y/o punto final), como una buena opción provisional para ser utilizado en los estudios de ECV en Brasil, pues éste fue el modelo que resultó en la mayor nota referente a los criterios establecidos, presentando resultados en escala global. Sin embargo, los resultados no descartan la necesidad de estudios de regionalización, volcados a la realidad brasileña. Otra posibilidad apuntada es la ampliación y ajuste del modelo de Van Zelm et al. (2016) - Brasil.
Palabras clave: Evaluación del Ciclo de Vida. Evaluación de Impacto del Ciclo de Vida. Métodos de EICV. Ozono troposférico. Factores de Caracterización. Regionalización de modelos.
1. INTRODUCTION
Lately, the research focusing at sustainable development is increasing, aiming to reduce the environmental and social impacts. One way to improve these studies is through tools that quantify the life cycle impacts of products and services, such as Life Cycle Assessment (LCA), which provides a comprehensive view of potential impacts. The LCA is composed of four stages, the third one — Life Cycle Impact Assessment (LCIA) — allows the calculation of environmental impacts by means of LCIA methods, which are composed by mathematical models (also called characterization models) and facilitate the understanding of the impacts (Hauschild et al. 2011). The scientific community developed regionalized LCIA characterization models at continental and regional scale to different regions around the world, as well as to a global scale. Therefore, LCA practitioners can choose different LCIA characterization models, for different impact categories. However, there are large differences between the models found in the literature, which lead to two problems: (1) different models yield different results to the same case study and; (2) the uncertainties in the results are high (Renou et al. 2008).
One of the scientific challenges in the LCA community is the regionalization of LCIA methods, once “the location of the source and its surrounding conditions influence the fate of the emitted pollutant and the subsequent exposure it causes” (Potting et al. 2006). This way, LCA studies based on LCIA methods with regionalized characterization models bring more reliable and accurate results, resulting in more credible studies (Bare 2010; Finnveden et al. 2009). LCA studies in Brazil use the methodologies and database of other countries, generating subjectivity in this phase (Associação Brasileira de Normas Técnicas 2014). Therefore, it is necessary that the LCIA methods and their characterization models represent the Brazilian reality (Ministério do Desenvolvimento, Indústria e Comércio Exterior [Brasil] 2010).
The Brazilian Program of Life Cycle Assessment (in Portuguese “Programa Brasileiro de
Avaliação do Ciclo de Vida – PBACV”) aims to support the development of the LCA
methodology in Brazil. It covers four strategic themes, where the second one relates to the LCIA, and leads to three goals: to research and to define the relevant impact categories to the Brazilian reality; to identify the characterization models, collect, update and make available its data; and to identify the existent LCIA methods, making adjustments to establish one Brazilian LCIA method (Ministério do Desenvolvimento, Indústria e Comércio Exterior [Brasil] 2010). Currently in Brazil, the methodological and scientific framework of the LCIA is still under development, whereas studies of characterization models to the impact categories are in different stages, and there is a gap related to the photochemical smog impact category.
Photochemical smog is a phenomenon that depends on meteorological conditions and certain concentrations of secondary pollutants emitted by the life cycle of products and services (Baird, Cann 2011). The negative impacts are due to their reactive nature that allows them to oxidize organic molecules (Santos 2006). Brazil has large urban centers, which have great potential to emit precursor gases of photochemical smog, such as the Metropolitan Region of São Paulo (Companhia Ambiental do Estado de São Paulo 2015).
With that in mind, this research aimed to compare and provide information about the characterization models for the photochemical smog impact category. In order to analyze the possibility of recommending one of these models to be used in Brazilian LCA studies, standardizing studies in the country. It also aims to apply the selected characterization models in a case study, where it is evaluated the photochemical smog formation potential from transporting one ton of sugar, considering two routes (road and railroad).
2. METHODOLY
The methodology adopted to compare the characterization models is presented in detail. Then, the information about the considered case study was presented.
2.1 Selection and description of characterization models
In order to carry out the study of the LCIA characterization models, the initial procedure was a bibliographical review of the different LCIA methods that present characterization models for the photochemical smog impact category, as well as the models that are not part of the LCIA methods. The selected models were Derwent et al. (1998), Jenkin and Hayman (1999); Krewitt et al. (2001); Van Goethem et al. (2013); Van Zelm et al. (2008; 2013); Van Zelm et al. (2016). 2.1.1 Description of the LCIA characterization models
The selected characterization models’ description was according to their main characteristics: a) LCIA method: which makes use of the featured characterization model, when present
in any LCIA method;
b) Impact assessment level: midpoint and/or endpoint;
c) Environmental impact assessed: within the cause-effect chain;
d) Final reference unit: of each Characterization Factor (CF), calculated by the characterization model;
e) Scale: when the model presents CF for a country or a continent, its representation takes the name of this one, and when global simply by “Global”; and in some cases also includes the number of sub-regions.
2.2 Comparative analysis of characterization models 2.2.1 Criteria for comparative analysis
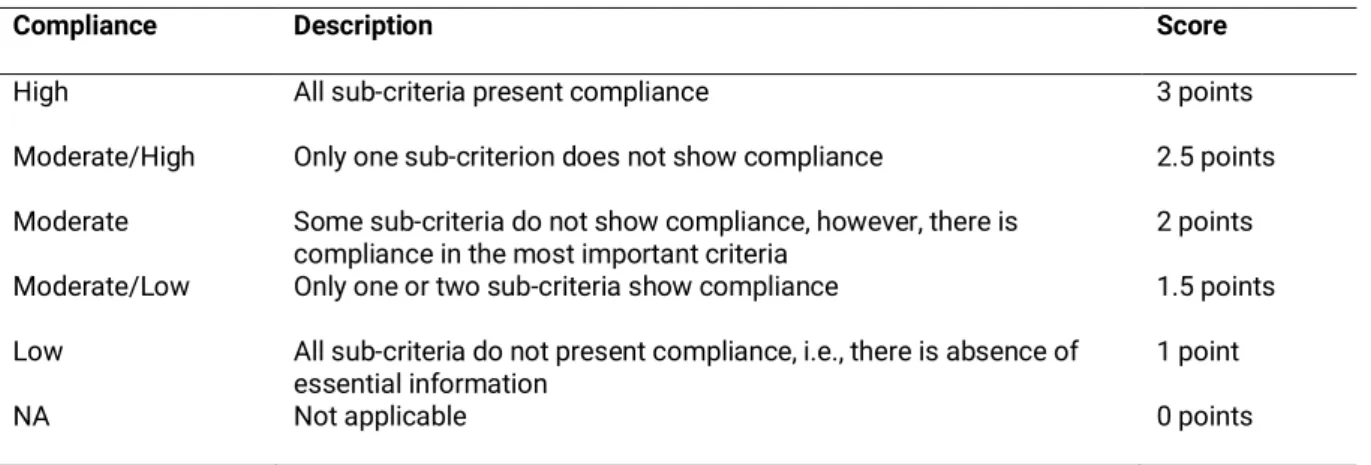
In order to compare and evaluate the conformity of the characterization models studied, three main criteria and their sub-criteria were established. These criteria were adapted from the general criteria elaborated by the Research Network in LCIA – Brazil, present in Ugaya et al. (2016) and Ugaya et al. (2019), taking into consideration the study of the selected characterization models. Thus, the three main criteria (Scope, Scientific Robustness and National CF) classifies as the scoring procedure in Table 1.
Table 1. Scoring procedure used to the comparative analysis of the models.
Compliance Description Score
High All sub-criteria present compliance 3 points
Moderate/High Only one sub-criterion does not show compliance 2.5 points Moderate Some sub-criteria do not show compliance, however, there is
compliance in the most important criteria 2 points Moderate/Low Only one or two sub-criteria show compliance 1.5 points Low All sub-criteria do not present compliance, i.e., there is absence of
essential information
1 point
NA Not applicable 0 points
Source: Scoring procedure adapted from Hauschild et al. (2011).
The scoring does not follow a standard scale, it depends on a broad qualitative assessment, considering the value obtained by each sub-criterion, as well as the general aspects of the model (degree of accuracy of the dispersion model used, degree of detail of the criteria, etc.). The description and the aim of the three main criteria (Scope, Scientific Robustness and National CF) and their sub-criteria, were:
CRITERION 1 - SCOPE: the evaluation of this criterion is subjective, taking into account the quality of the scope of each model, according to the sub-criteria:
1.1. Range of scope’s application: the classification of this item accorded to the range/scale of the model: global, continental, national, regional.
1.1.1. Spatial differentiation level: considering the resolution (km × km) used in the pollutant transport model.
1.1.1.1. Spatial resolution represents formation and dispersion of photochemical smog: considers if the spatial differentiation of the item 1.1.1 represents the photochemical smog formation.
1.1.2. Level of elementary flows considered: a) Level of elementary flows in the source (paper), and b) Level of elementary flows in the software. It was observed that the number of elementary flows present in the source was different from that present in the software.
CRITERION 2 - SCIENTIFIC ROBUSTNESS: the evaluation of this criterion takes into account the transparency and clarity of the data, in order to facilitate the indication of the model that has the best conditions to be reproduced.
2.1. Is it part of any LCIA method? Does the scientific community recognize it?
2.2. Cause-Effect Chain: indicates the level of impact assessment considered by the model. 2.3. Transparency and accessibility: indicates if the description of the equations, the chemical transport model and the secondary data used by the model are appropriate.
2.3.1. Clarity of the equations: indicates if the characterization model describes clearly, how the equations were calculated and which the source of the secondary data is.
2.3.2. Clarity of the variables: indicates if the model describes how they obtained the variables used in the CF calculations and if the values are available in the literature.
2.3.3. Mathematical model of transport: if the model shows the chemical transport model used and if its description is available in the literature.
2.3.3.1. It represents the nonlinear reactions of the photochemical smog formation: if the used chemical transport model describes the formation reactions of the phenomenon.
CRITERION 3 - NATIONAL CF: this criterion aims to identify the models that have CF for Brazil and to analyze if it is suitable for the Brazilian reality.
3.1. Has CF for Brazil.
3.1.1. Spatial differentiation level: considers the resolution (km × km) of Brazil’s CF.
3.1.2. CF appropriate for the national context: indicates if the model can represent the photochemical smog formation in Brazil.
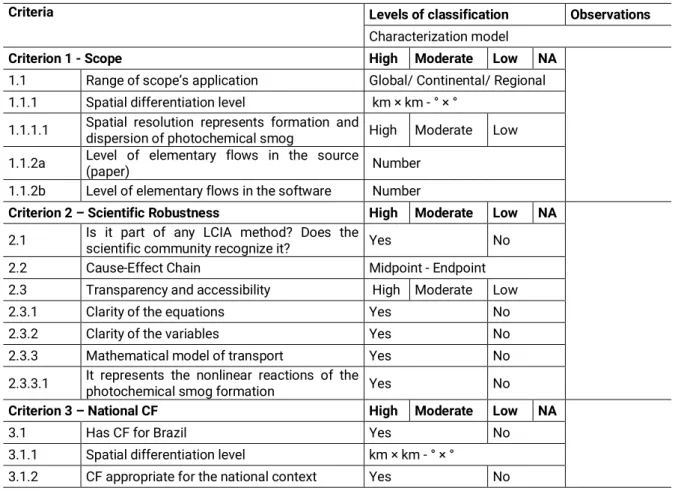
Summarizing this procedure, Table 2 presents the criteria and sub-criteria of comparison and selection of the characterization models with each levels of classification. These criteria were adapted from Ugaya et al. (2016) and Ugaya et al. (2019). There is a slight difference between Ugaya et al. (2016) and Ugaya et al. (2019), in the sub-criterion “2.2 Cause-Effect Chain”, Ugaya et al. (2019) includes a more specific item “2.2.1. Is it presented and is it clear?”.
However, such difference does not change the result of the present study. Then, the sub-item 2.2.1 was omitted.
Table 2. Criteria for comparison and selection of the characterization models.
Criteria Levels of classification Observations
Characterization model
Criterion 1 - Scope High Moderate Low NA
1.1 Range of scope’s application Global/ Continental/ Regional 1.1.1 Spatial differentiation level km × km - ° × °
1.1.1.1 Spatial resolution represents formation and dispersion of photochemical smog High Moderate Low 1.1.2a Level of elementary flows in the source (paper) Number
1.1.2b Level of elementary flows in the software Number
Criterion 2 – Scientific Robustness High Moderate Low NA
2.1 Is it part of any LCIA method? Does the scientific community recognize it? Yes No
2.2 Cause-Effect Chain Midpoint - Endpoint
2.3 Transparency and accessibility High Moderate Low
2.3.1 Clarity of the equations Yes No
2.3.2 Clarity of the variables Yes No
2.3.3 Mathematical model of transport Yes No
2.3.3.1 It represents the nonlinear reactions of the photochemical smog formation Yes No
Criterion 3 – National CF High Moderate Low NA
3.1 Has CF for Brazil Yes No
3.1.1 Spatial differentiation level km × km - ° × °
3.1.2 CF appropriate for the national context Yes No Source: Adapted from Ugaya et al. (2016) and Ugaya et al. (2019).
2.3 Application of the models: a case study
The LCIA methods, composed by characterization models, optimize and facilitate LCA studies. To complete the comparison and analysis, a case study applied the selected characterization models in the previous step, which are: Derwent et al. (1998), Jenkin and Hayman (1999); Krewitt et al. (2001); Van Goethem et al. (2013); Van Zelm et al. (2008; 2013); Van Zelm et al. (2016).
The models of Krewitt et al. (2001), Van Goethem et al. (2013) and Van Zelm et al. (2016) are not present in the SimaPro® software version 8.3.0.0. (PRé 2016). Therefore, the impact
categories related to the photochemical smog formation of these models were included in the program's database, according to information obtained in the respective bibliographies: Krewitt et al. (2001); Van Goethem et al. (2013); Huijbregts et al. (2017).
2.3.1 Path and database selection
In order to compare the LCIA characterization models, they were applied to the same case study. It simulated one ton of sugar’s transportation, leaving the center of Campinas/São Paulo/Brazil to the Seaport of Santos, through two routes: road and railroad. The railroad route (186 km) was the simulation of a train leaving the railway terminal of Campinas/SP, passing through the center of Jundiaí/SP and São Paulo/SP cities, with the final destination being the Seaport of Santos in Santos/SP city. The road route (190 km) was the simulation of a truck coming from the same address (Campinas/SP), passing through the Anhanguera Highway (SP-330), the centers of Jundiaí/SP and São Paulo/SP cities, continuing along the Piaçaguera-Guarujá Highway to Seaport of Santos, in the city of Guarujá/SP (Figure 1).
Figure 1. Map of the routes from Campinas/SP to the Seaport of Santos - Brazil.
To analyze the LCIA models and the different routes, the SimaPro® software version 8.3.0.0
was used (PRé 2016). Due to the lack of a Brazilian database, the information of the transport model’s types comes from the database ecoinvent 3 – allocation, recycled content - unit present in the SimaPro and which represents the European types of transport. For railroad transport, it was used the database of a train powered by diesel, with particle filter. To road transport, it was used the database of a lorry powered by diesel, with a load capacity greater than 32 tons, which syntax is present in Table 3.
Table 3. Transport database used in the case study. Transport Ecoinvent database processes
Lorry Transport, freight, lorry >32 metric ton, EURO3 {RoW}| transport, freight, lorry >32 metric ton, EURO3 / Alloc Rec, U
Train Transport, freight train {RoW}| diesel, with particle filter/ Alloc Rec, U
The reference region (continent, country, and specific region), the impact category (evaluation level) of the models, the relative percentage of the routes and the final reference unit was detailed, in order to facilitate the evaluation and comparison between the characterization models.
The characterization models present different final reference units, which makes them not directly comparable to each other. However, through a relative percentage of the scenarios studied, we can compare the models and the paths (a procedure also known as internal normalization of results). In this way, the path with greater impact capacity received 100% of impact power and the path with the lowest capacity received a percentage relative to the one with the greatest impact.
3. RESULTS AND DISCUSSION
The description of the characterization models and their comparison were shown. Also, the results of the case study were presented.
3.1 Selection and description of characterization models
With the bibliographic review, we selected, described and embedded in the cause-effect chain five LCIA characterization models. The cause-effect chain adapted from ILCD Handbook (Hauschild et al. 2011), represents that the impacts at the endpoint level are the end-of-chain damage (damage on human health, crops and ecosystems), and the damage at the midpoint level are all the impacts that precede them (Figure 2).
It is also observed in Figure 2, that there are three models that present CF at midpoint level: (1) Van Zelm et al. (2008, 2013) – Ozone Formation Potential (OFP); (2) Derwent et al. (1998), Jenkin and Hayman (1999) – Photochemical Ozone Creation Potentials (POCP). These two represent the increase in tropospheric O3 concentration. (3) Van Zelm et al. (2016) –
Photochemical Oxidant Formation Potential: Humans (HOFP) and Photochemical Oxidant Formation Potential: Ecosystems (EOFP), which take into account the increase/critical exposure of humans and vegetation. Regarding the endpoint CF: three models present CF for damage on human health (Krewitt et al. 2001; Van Zelm et al. 2008, 2013; Van Zelm et al. 2016); two for damage to ecosystems (Van Goethem et al. 2013; Van Zelm et al. 2016); and one for damage to crops (Krewitt et al. 2001).
Figure 2. Cause-effect chain of photochemical smog formation.
Source: Adapted from (Hauschild et al. 2011).
3.1.1 Description of the LCIA characterization models
The Table 4 presents a description of the main characteristics of each characterization model evaluated.
Table 4. Description of the LCIA characterization models evaluated. Characterization
model LCIA method Impact assessment level Final reference unit Scale
Van Zelm et al. (2008,
2013) ReCiPe 2008 Damage on human health - E
a DALYc
(year.kg-1)
Europe
OFP – Mb NMVOCd-eq.
Derwent et al. (1998), Jenkin and Hayman (1999)
CML-IA
baseline POCP – M kg C2H4e eq.kg
-1 Northwest
Europe Van Zelm et al.
(2016) ReCiPe 2016 Damage on human health - E year.kton
-1 Global - 56
regions of the world
HOFP – M kg NOxf-eq.
Damage to ecosystems - E km2.year.kton-1
EOFP – M kg NOx-eq.
Van Goethem et al.
(2013) - Damage to ecosystems - E m
2.year.kg-1 Europe - 65
regions Krewitt et al. (2001) EcoSense Damage on human health - E YOLLg.kton-1 Europe - 14
countries Damage to crops – E Euro.kton-1
Note: aE: Endpoint; bM: Midpoint; cDALY: Disability-Adjusted Life Year – “one DALY can be thought of as one lost
year of "healthy" life” (World Health Organization [WHO] 2014); dNMVOC: Non-Methane Volatile Organic
We can observe in Table 4, that four models have CF for Europe; and one model has CF for Global scale and for 56 regions of the world, being one of these CF for Brazil. Each characterization model presents a different final reference unit, since each model has a specific form to calculate the level of environmental impact by either formula, chemical transport models or experiments. It is also noted that the model of Van Goethem et al. (2013) do not yet make part of any LCIA method.
3.2 Comparative analysis of characterization models 3.2.1 Criteria for comparative analysis
The results of the criteria table (Table 2) and the models’ studies supported its comparative analysis. This aimed to compare and analyze the characterization models and allowed to detect the pros and cons of each model studied. Therefore, three groups of comparison divided the models: (1) those with CF for midpoint level; (2) those with CF for damage to ecosystems; and (3) those with CF for damage on human health.
1) Models that have midpoint CF (POCP or OFP):
The model of Van Zelm et al. (2008, 2013), has midpoint CF (OFP) to 137 elementary flows and its resolution (0.25° × 0.25°) represents the formation and dispersion of smog in Europe. It is part of the LCIA method ReCiPe 2008, which has recognition by the scientific community. The model description presents transparency and accessibility of the equations, variables and chemical transport model (Lotos-Euro). According to these reasons, high compliance was considered to scope and scientific robustness criteria, and not applicable to the national CF criterion.
The model of Derwent et al. (1998), Jenkin and Hayman (1999), has midpoint (POCP) to 120 VOC, to NOx, carbon monoxide and SO2. Its resolution (0.5° × 0.5° and 0.1° × 0.1° in the
UK) represents the formation of photochemical smog over Europe. The LCIA method CML-IA
baseline, makes use of this model, which has recognition by the scientific community. The model
does not present transparency and accessibility in the equations, in the variables and in the chemical transport model used in the CF calculations. The method CML-IA baseline, presents in his inventory CF to 131 elementary flows, not including NMVOC and NOx. Thus, the model
shows high compliance to the scope criterion, moderate to scientific robustness and does not apply to national CF criterion.
The model of Van Zelm et al. (2016) has midpoint CF (EOFP and HOFP) on a global scale to 167 elementary flows. The model considers a moderate resolution (1° × 1°) since it may underestimate the formation of the phenomenon. The model, used by the LCIA method ReCiPe
2016, presents transparency and accessibility of equations, variables and the chemical transport
model (TM5-FASST). The model of Van Zelm et al. (2016) presents CF for Brazil, but only for two elementary flows: NOx and NMVOC. It considers a low resolution (1° × 1°) and a single
CF for Brazil as a whole. According to these reasons, the model shows moderate compliance to the scope criterion, high scientific robustness, and moderate/low national CF criterion.
2) Models that have CF for damage to ecosystems:
The model of Van Zelm et al. (2016) has endpoint CF (damage to ecosystems) on a global scale to 167 elementary flows. The model makes use of a moderate resolution (1° × 1°), which may underestimate the formation of photochemical smog in some regions. The model, used by the LCIA method ReCiPe 2016, presents transparency and accessibility of equations, variables and the chemical transport model (TM5-FASST). It presents CF for Brazil, but only for two elementary flows: NOx and NMVOC. The model considers a low resolution (1° × 1°) and a
single CF for Brazil as a whole. To the Southern Hemisphere it makes use of growing seasons to grassland and forest. It also multiplied the values corresponding to the thresholds concentration of AOT401 by the corresponding natural area of grassland or forest by region,
according to the Global Land Cover 2000 database (Bartholomé, Belward 2005). Therefore, the model shows moderate compliance to the scope criterion, high to scientific robustness, and moderate/low to national CF criterion.
The model of Van Goethem et al. (2013) has endpoint CF to 65 regions of Europe, for two elementary flows: NOx e NMVOC. The resolution (0.5° × 0.5°) represents the formation and
exposure of vegetation to photochemical smog. The model does not appear in any LCIA method but has recognition by the scientific community. It presents transparency and accessibility of the equations, variables and chemical transport model (EMEP). Therefore, the scope and scientific robustness criteria have high compliance, and the national CF criterion was not applicable. The model of Van Zelm et al. (2016), for damage to ecosystems, were derived from Van Goethem et al. (2013). The calculations used by both are similar, however Van Zelm et al. (2016) adapted the model, replacing the European chemical transport model (EMEP) by the global chemical transport model (TM5-FASST), as well as the European secondary parameters (AOT40, PAF2
and Area) by parameters that represent each of the 56 regions. This procedure indicates that it is possible to make an adaptation aiming the regionalization of the characterization models, as
1 AOT40: Accumulated ozone exposure over a threshold of 40 ppb (80 µg/m³), i.e. only concentrations of ozone above 40 ppb are included (IRCEL CELINE 2017).
2 PAF – Potentially Affected Fraction: the fraction of species exposed to a concentration in which the toxic substance (O3) exerts stress on vegetation (Klepper et al. 1998).
long as there is a chemical transport model that represents the formation and dispersion of the photochemical smog in the region of interest, as well as regional secondary parameters.
3) Models that have CF for damage on human health:
The model of Van Zelm et al. (2008; 2013) has endpoint CF (damage on human health) to 137 elementary flows and its resolution (0.25° × 0.25°) represents the formation and dispersion of smog in Europe. It is part of the LCIA method ReCiPe 2008, which has recognition by the scientific community. The model description presents transparency and accessibility of the equations, variables and chemical transport model (Lotos-Euro). According to these reasons, the scope and scientific robustness criteria have high compliance, and the national CF criterion was not applicable.
The model of Van Zelm et al. (2016) has endpoint CF (damage on human health) on a global scale to 167 elementary flows. The model resolution (1° × 1°) may underestimate the formation of the phenomenon in some regions, according to Van Zelm et al. (2016). The model, used by the LCIA method ReCiPe 2016, presents transparency and accessibility of equations, variables and the chemical transport model (TM5-FASST). However, all data to the effect factor of this model was based on the population ≥30 years old in 2005 (taken from United Nations (2011)), assuming no effect on younger people. The model of Van Zelm et al. (2016) presents CF for Brazil, but only for two elementary flows: NOx and NMVOC. It considers a low resolution (1°
× 1°) and a single CF for Brazil as a whole. Due to this information, the scope criterion has moderate compliance, the scientific robustness criterion has high compliance, and the national CF criterion has moderate/low.
The model of Krewitt et al. (2001) has endpoint CF (damage on human health and damage to crops) for two elementary flows: NOx and NMVOC, in Europe. It makes use of chemical transport
models to set up the formation of the photochemical smog, which have an adequate resolution (0.5° × 0.5°). The model, used by the LCIA method EcoSense, has a reliable scientific basis, but with limitations, i.e., has no transparency and accessibility of equations and variables. With this, the model shows high compliance to scope criterion, moderate/low to scientific robustness and it is not applicable to national CF.
3.2.1.1 Final score of comparative criteria analysis
From the results of Table 2 and the comparative analysis of the models, we obtained the final score considering the evaluation of the criteria for each characterization model (Table 5).
Table 5. Final score of the evaluated characterization models.
Characterization models Criteria Score
1 2 3
Van Zelm et al. (2008; 2013) – OFP 3 3 0 6
Derwent et al. (1998), Jenkin and Hayman (1999) – POCP 3 2 0 5
Van Zelm et al. (2016) – EOFP and HOFP 2 3 1.5 6.5
Van Zelm et al. (2016) – damage to ecosystems 2 3 1.5 6.5
Van Goethem et al. (2013) – damage to ecosystems 3 3 0 6 Van Zelm et al. (2008, 2013) – damage on human health 3 3 0 6 Van Zelm et al. (2016) – damage on human health 2 3 1.5 6.5
Krewitt et al. (2011) – damage on human health 3 1.5 0 4.5
The results in Table 5 suggest the characterization model of Van Zelm et al. (2016) - Global3,
for all categories - damages on human health, damages to ecosystems, EOFP and HOFP, as a good option to be used in studies of LCA in Brazil, since the model resulted in the highest score regarding the criteria. Moreover, among the models present in this study, it is the only one that presents CF (midpoint and endpoint) at a global level (167 elementary flows) and CF for Brazil (two elementary flows).
However, the results do not rule out the need for regionalization studies aimed at the Brazilian reality, in order to develop a LCIA characterization model to the photochemical smog impact category. Among the reasons, there is the fact that the model of Van Zelm et al. (2016) have some disadvantages, as: it considers only one CF for Brazil; the resolution of the model (1° × 1°) may underestimate the photochemical smog formation; the model assumes that only people aged ≥30 years suffer negative influences of ozone action; the chemical transport model used (TM5-FASST) does not take into account the differences between the archetypes (urban, rural or remote areas) in the calculation of the Intake Factor; and features CF only for NOx and
NMVOC. In contrast, the model considered the national parameters: mortality rate; pollutant background concentration; population number; and years of life lost value per case.
3.2.2 Factors influencing CF calculations
LCA practitioners can choose different LCIA characterization models, for different impact categories; however, there are large differences between the models found in the literature (Renou et al., 2008). The characterization models to the photochemical smog impact category present in this study show differences between them, which relates to several factors that influence the final CF calculation, such as:
3 The model presents CF for different categories in cause-effect chain of photochemical smog formation. In this study, the model was divided into three CF, according to the comparison groups: one at midpoint (HOFP and EOFP) and two at endpoint (Damage on human health and Damage to ecosystem).
1. Model input parameters:
a) Calculation parameters: impact assessment period/time used in calculations, i.e. maximum ozone concentration of 8h or 24h daily, etc.;
b) Impact areas considered in the calculations: including or excluding emissions and/or impacts from external grids to the region considered by the model, etc.;
c) Input data used in the CF calculations: pollutant background concentration, meteorological data, population number, etc., which may vary according to the scale used by the model (regional, continental or global);
d) Chemical transport model: different models have different resolutions and are calibrated to specific regions;
e) Archetypes: considered or not by the chemical transport model (urban, rural or remote areas);
f) Sources of emissions and their respective heights: differentiation between emissions of precursors from industrial and vehicular sources.
2. Model output parameters:
a) Scale used by the model: regional, continental or global;
b) Elementary flows (quantity and variety): several elementary flows contribute to the photochemical smog formation.
3. Parameters related to LCA:
a) Environmental impact category: considered within the cause-effect chain (midpoint, more or less specific and/or endpoint);
b) Metric: units used to calculate the CF (DALY, year.kton-1, etc.).
3.3 Application of the models: a case study
From the models studied, it was possible to obtain results for 14 categories related to the photochemical smog impact category. Table 6 shows the relative impact of each route, for each characterization model. We observed in Table 6 that the models showed differences in the results, to the same case study. According to Renou et al. (2008), this happens because the models found in the literature are different from each other.
The model of Van Zelm et al. (2016) shows four categories in midpoint level and four categories in endpoint level, to Global and Brazil scales. All impact categories of this model showed that the railroad has, on average, a smog formation potential 2.6% higher than the road. The elementary flows, on Global scale, which contributed mostly to the damages to ecosystems and to EOFP, were: NOx (95.8%), NMVOC (3.9%), Pentane (0.1%) e Butane (0.03%). With regard to damage
on human health and HOFP, were: NOx (97.3%), NMVOC (2.4%), Pentane (0.04%) e Butane
(0.02%). To Brazil scale, the model presents CF for two elementary flows, of which NOx had a
NMVOC contributed from 0.6% to 1.1% on impact to all impact categories (midpoint and endpoint).
Table 6. Results of the routs by characterization model.
Model Scale Impact assessment level Road Railroad Unit
Van Zelm et al. (2016) Global HOFP – midpoint 97.6% 100.0% kg NOx-eq.
EOFP – midpoint 98.1% 100.0% kg NOx-eq.
Damage to ecosystem 98.1% 100.0% specie.year Damage on human health 97.6% 100.0% Year Van Zelm et al. (2016) Brazil HOFP – midpoint 96.8% 100.0% kg NOx-eq.
EOFP – midpoint 96.9% 100.0% kg NOx-eq.
Damage to ecosystem 96.8% 100.0% km².year Damage on human health 96.8% 100.0% Year
Van Zelm et al. (2008, 2013) Europe OFP – midpoint 100.0% 98.9% kg NMVOC-eq. Damage on human health 100.0% 98.9% DALY
Derwent et al. (1998), Jenkin and Hayman (1999)
Europe POCP – midpoint 100.0% 88.4% kg C2H4-eq.
Van Goethem et al. (2013) Europe Damage to ecosystem 98.0% 100.0% m².year Krewitt et al. (2001) Europe Damage on human health 100.0% 74.1% YOLL
Damage to crops 100.0% 96.4% EURO
The model of Van Zelm et al. (2008, 2013) has two impact categories (midpoint and endpoint), both presenting road route with a smog formation potential 1.1% higher than the railroad. The four elementary flows that contributed most to both impact categories were: NOx (84.49%),
NMVOC, (11.92%), fossil carbon monoxide (1.37%) and sulfur dioxide (1.30%).
To the model of Derwent et al. (1998), Jenkin and Hayman (1999), the road had a photochemical oxidation potential of 11.6% greater than the railroad. The four elemental flows that contributed most to smog formation in the road route were: fossil carbon monoxide (29.46%), sulfur dioxide (38.85%), pentane (5.11%) and formaldehyde (5.0%). For the railroad route, were: fossil carbon monoxide (48.09%), sulfur dioxide (33.69%), fossil methane (2.96%) and pentane (2.77%). In this model, different from the others, the elementary flows contribute differently to the routes. This method also does not present CF for NOx and NMVOC in its inventory, which are
elementary flows that have great contribution to the photochemical smog formation, as observed by Van Zelm et al. (2008, 2013; 2016).
The model of Van Goethem et al. (2013) showed that the railroad had a potential for damage to ecosystems 2% higher than the road, where the NOx elemental flow contributed with 95.89% of
Krewitt et al. (2001) model demonstrated that the road route caused 25.9% more damage on human health and 3.6% more damage to crops than railroad. For damage to crops, NOx
contributed on average 81.49% of the impact, and NMVOC around 18.51% in both routes. For damage on human health, the NOx elemental flow is negative, however, Krewitt et al. (2001)
suggests in case of negative damage factors, it might be defendable to set characterization factors to zero, thus indicating that the potential for environmental damage is low in a specific context. This way, the NMVOC elemental flow presented 100% of the photochemical smog formation potential.
The analysis showed that the difference in the phenomenon formation potential, between the modes of transport, is not significant. The models with the highest difference in smog formation potential were: Krewitt et al. (2001) (damage on human health) and Derwent et al. (1998), Jenkin and Hayman (1999), for which the railroad route showed to be 25.9% and 11.6% (consecutively) less impacting than road. Aside from these models, the others present an average difference of 2.4% of smog formation potential between the two routes. Small differences in results can be related to the type of fuel and the elementary flows considered in the transport database present in the ecoinvent, and the unit processes that contribute to the impact, within each model. Both routes consider diesel as fuel, and both databases have emissions to air of the main elementary flows that are precursors of photochemical smog: NOx, NMVOC, carbon
monoxide, carbon dioxide, etc. (Preiss 2015; Orlando et al. 2010).
The unit processes that contributed to the impact of each transport were similar between the transport modes and characterization models, however, they have different weights in each characterization model. For railroad transport, the three unit processes that contributed the most, by the models of Van Zelm et al. (2008, 2013; 2016), were: the transport by railroad (85.9%); the construction of the railroad (6.1%); and the diesel used by the train in transportation (4.9%). By the model of Derwent et al. (1998), Jenkin and Hayman (1999), the three unitary processes that contributed the most were: the transport by railroad (36.6%); the diesel used by the train in transportation (24.6%); and the construction of the railroad (22.4%). For road transport, the three unit processes that contributed the most, by the models of Van Zelm et al. (2008, 2013; 2016), were: the transportation by truck (69.4%); the road construction (19.2%); and the diesel used by the truck in transportation (9.4%). By the model of Derwent et al. (1998), Jenkin and Hayman (1999), were: the diesel used by the truck in transportation (41.3%); the transportation by truck (24.9%); and the road construction (24.4%).
Regarding the results of the considered case study, the impact potentials to the photochemical smog category were similar to railroad and road transport. However, to other impact categories this difference can be significant, for example to particulate matter formation, land occupation,
etc. This way, in order to assess the potential impact of transport modes (road and railroad), it is necessary to consider other impact categories.
4. CONCLUSION
This research provides subsidies to Brazilian Program of Life Cycle Assessment (in Portuguese “Programa Brasileiro de Avaliação do Ciclo de Vida – PBACV”), taking into account the objectives of its second strategic theme: to identify existing LCIA methods and characterization models for the photochemical smog impact category as well as to collect and make available information about these models.
Individual LCA practitioners can choose different LCIA characterization models, for photochemical smog category. However, there are large differences between the models found in the literature. These differences influence the CF calculations, and to pick one or other model leads to different results and conclusions to the same LCA study. Therefore, it needs to be careful in choosing these models, taking into account the scope of the study and aiming a better LCA. Based in the analysis of the characterization models and the case study presented in this research, we may conclude that the elementary flows that most contribute to the smog phenomenon formation are NOx, NMVOC, carbon monoxide and sulfur dioxide. Therefore, the presence of CF
of these elementary flows in a characterization model inventory to the smog impact category becomes a relevant factor on choosing the most appropriate model.
Through the description and analysis of the characterization models, it is possible to observe that each model presents a way of calculating the level of environmental impact, whether it is through formulas, chemical transport models, experiments in photochemical smog cameras, etc. Another noticed difference is regarding the model’s developing scale, where there are models developed for different regions of the world and models developed on a global scale. To Brazil, only the model of Van Zelm et al. (2016) has CF, even though it has some disadvantages, such as: CF only for two elementary flows, it considers the country as a whole, and there is a lack of national secondary database. For this reason, in LCA studies carried out in Brazil until now, individual LCA practitioners used characterization models elaborated to other regions.
The comparison between considered models suggests the model of Van Zelm et al. (2016) - Global (for all categories: damages on human health, damages to ecosystems, EOFP and HOFP), as a good option to be interim used in LCA studies in Brazil to the photochemical smog category, as it was the model with the highest grade referring to the criteria table. However, the survey results demonstrate the need for studies focused on the regionalization of characterization models to the photochemical smog impact category, aimed to the Brazilian reality.
The survey results also demonstrate that studies could focus in the magnification and adjustment of Van Zelm et al. (2016) – Brazil’s model. Since this model needs some adjustments, as national and/or global secondary parameters to CF calculations as well as studies about the Photochemical Oxidant Creation Potential (POCP) of photochemical smog precursors in Brazil, in order to enable the calculation of CF for individual NMVOCs. In particular, a chemical transport model is required to calculate the Intake Factor that represents the formation and dispersion of the phenomenon in Brazil. The chemical transport model should allow the relationship between the emission of a precursor pollutant and inhalation by a population, as well as to differentiate the Brazilian archetypes.
The model of Van Zelm et al. (2016) - Brazil considers some national secondary parameters, such as: mortality rate, precursor background concentration in the country, number of inhabitants aged ≥ 30 years, and the years of life lost value per case. However, this model considers a single value to the country as a whole, and uses a global chemical transportation model (TM5-FASST), which may underestimate the photochemical smog formation in Brazil.
Thus, future research aiming to adjust the model of Van Zelm et al. (2016) - Brazil, should direct research to obtain national secondary parameters, POCPs of individual NMVOCs and look for a national chemical transport model, adjusted to the reality of the different regions of Brazil. Such advances could provide more reliable and accurate results in LCA studies carried out in Brazil. REFERENCES
ASSOCIAÇÃO BRASILEIRA DE NORMAS TÉCNICAS, 2014. ABNT NBR ISO 14040: 2009 Versão Corrigida: 2014: Gestão Ambiental: Avaliação do ciclo de vida: Princípios e Estrutura. Brasil. Rio de Janeiro, RJ: ABNT.
BAIRD, Colin and CANN, Michael, 2011. Química ambiental. Porto Alegre, RS: Bookman. ISBN 978-85-7780-851-9. BARE, Jane C., 2010. Life cycle impact assessment research developments and needs. Clean Technologies and Environmental Policy. August 2010. Vol. 12, no. 4, p. 341–351. DOI 10.1007/s10098-009-0265-9.
BARTHOLOMÉ, E. and BELWARD, A. S., 2005. GLC2000: a new approach to global land cover mapping from Earth observation data. International Journal of Remote Sensing. May 2005. Vol. 26, no. 9, p. 1959–1977. DOI
10.1080/01431160412331291297.
COMPANHIA AMBIENTAL DO ESTADO DE SÃO PAULO, 2015. Qualidade do ar no estado de São Paulo 2015 [online]. São Paulo, SP: CETESB. [Accessed 25 April 2020]. Available from: https://cetesb.sp.gov.br/ar/wp-content/uploads/sites/28/2013/12/RQAR-2015.pdf
DERWENT, Richard G., JENKIN, Michael E., SAUNDERS, Sandra M. and PILLING, Michael J., 1998. Photochemical ozone creation potentials for organic compounds in northwest Europe calculated with a master chemical mechanism. Atmospheric Environment. August 1998. Vol. 32, no. 14–15, p. 2429–2441. DOI 10.1016/S1352-2310(98)00053-3.
FINNVEDEN, Göran, HAUSCHILD, Michael Z., EKVALL, Tomas, GUINÉE, Jeroen, HEIJUNGS, Reinout, HELLWEG, Stefanie, KOEHLER, Annette, PENNINGTON, David and SUH, Sangwon, 2009. Recent developments in Life Cycle Assessment. Journal of Environmental Management. October 2009. Vol. 91, no. 1, p. 1–21. DOI
HAUSCHILD, Michael, GOEDKOOP, Mark, GUINEE, Jerome, HEIJUNGS, Reinout, HUIJBREGTS, Mark, JOLLIET, Olivier, MARGNI, Manuele and DE SCHRYVER, An, 2011. Recommendations for Life Cycle Impact Assessment in the European context: based on existing environmental impact assessment models and factors (International Reference Life Cycle Data System - ILCD handbook) [online]. Luxembourg: Publications Office of the European Union. [Accessed 26 April 2020]. Available from: https://ec.europa.eu/jrc/en/publication/eur-scientific-and- technical-research-reports/recommendations-life-cycle-impact-assessment-european-context-based-existing-environmental
HUIJBREGTS, Mark A. J., STEINMANN, Zoran J. N., ELSHOUT, Pieter M. F., STAM, Gea, VERONES, Francesca, VIEIRA, Marisa, ZIJP, Michiel, HOLLANDER, Anne and VAN ZELM, Rosalie, 2017. ReCiPe2016: a harmonised life cycle impact assessment method at midpoint and endpoint level. The International Journal of Life Cycle Assessment. February 2017. Vol. 22, no. 2, p. 138–147. DOI 10.1007/s11367-016-1246-y.
IRCEL CELINE, 2017. AOT40 vegetation. Belgian Interregional Environment Agency [online]. 6 September 2017. [Accessed 31 May 2017]. Available from:
http://www.irceline.be/en/air-quality/measurements/ozone/history/trends/aot40-vegetation
JENKIN, Michael E and HAYMAN, Garry D, 1999. Photochemical ozone creation potentials for oxygenated volatile organic compounds: sensitivity to variations in kinetic and mechanistic parameters. Atmospheric Environment. April 1999. Vol. 33, no. 8, p. 1275–1293. DOI 10.1016/S1352-2310(98)00261-1.
KLEPPER, Olivier, BAKKER, Joost, TRAAS, Theo P. and VAN DE MEENT, Dik, 1998. Mapping the potentially affected fraction (PAF) of species as a basis for comparison of ecotoxicological risks between substances and regions. Journal of Hazardous Materials. August 1998. Vol. 61, no. 1–3, p. 337–344. DOI 10.1016/S0304-3894(98)00141-1.
KREWITT, Wolfram, TRUKENMÜLLER, Alfred, BACHMANN, Till M. and HECK, Thomas, 2001. Country-specific damage factors for air pollutants: A step towards site dependent Life Cycle Impact assessment. The International Journal of Life Cycle Assessment. July 2001. Vol. 6, no. 4, p. 199–210. DOI 10.1007/BF02979375.
MINISTÉRIO DO DESENVOLVIMENTO, INDÚSTRIA E COMÉRCIO EXTERIOR [BRASIL], 2010. Resolução no 04, de 15 de dezembro de 2010. Dispõe sobre a aprovação do programa brasileiro de avaliação do ciclo de vida e dá outras providências [online]. 15 December 2010. [Accessed 6 June 2016]. Available from:
http://www.ctpconsultoria.com.br/pdf/Resolucao-04-de-15-12-2010.pdf
ORLANDO, João Paulo, ALVIM, Débora Souza, YAMAZAKI, Amélia, CORRÊA, Sergio Machado and GATTI, Luciana Vanni, 2010. Ozone precursors for the São Paulo Metropolitan Area. Science of The Total Environment. March 2010. Vol. 408, no. 7, p. 1612–1620. DOI 10.1016/j.scitotenv.2009.11.060.
POTTING, José, HERTEL, Ole, SCHÖPP, Wolfgang and BASTRUP-BIRK, Annemarie, 2006. Spatial Differentiation in the Characterisation of Photochemical Ozone Formation: The EDIP2003 Methodology. The International Journal of Life Cycle Assessment. January 2006. Vol. 11, no. S1, p. 72–80. DOI 10.1065/lca2006.04.014.
PRÉ, 2016. SimaPro Database Manual: Methods library [online]. 2.9. Netherlands: PRé. [Accessed 18 February 2020]. Available from: https://simapro.com/wp-content/uploads/2019/02/DatabaseManualMethods.pdf PREISS, Philipp, 2015. Photochemical Ozone Formation. In: Life Cycle Impact Assessment [online]. Dordrecht: Springer Netherlands. p. 115–138. LCA Compendium – The Complete World of Life Cycle Assessment.
[Accessed 25 April 2020]. ISBN 978-94-017-9743-6. Available from: http://link.springer.com/10.1007/978-94-017-9744-3_7
RENOU, S., THOMAS, J.S., AOUSTIN, E. and PONS, M.N., 2008. Influence of impact assessment methods in wastewater treatment LCA. Journal of Cleaner Production. July 2008. Vol. 16, no. 10, p. 1098–1105. DOI 10.1016/j.jclepro.2007.06.003.
SANTOS, Luciano Miguel Moreira dos, 2006. Avaliação ambiental de processos industriais. 2. São Paulo, SP: Signus.
UGAYA, C. M. L., ALVARENGA, R., PAVAN., A. L. R, OMETTO, A. R., LIMA, E. G., OLIVEIRA, J. M., ALMEIDA NETO, J. A., PEGORARO, L. A., BARRANTES, L. S., MENDES, N. C., TADANO, Y. and FIGUEIREDO, M. C., 2016. Rede de Pesquisa em Avaliação de Impacto do Ciclo de Vida: critérios para recomendação de métodos e modelos de
caracterização para o Brasil. In: Anais do V Congresso Brasileiro em Gestão do Ciclo de Vida. Fortaleza, CE: Embrapa; ABCV; UTFPR. 2016.
UGAYA, Cássia Maria Lie, ALMEIDA NETO, José Adolfo de and FIGUEIREDO, Maria Cléa Brito de (eds.), 2019. Recomendação de modelos de Avaliação de Impacto do Ciclo de Vida para o Contexto Brasileiro [online]. Brasília, DF: Ibict. [Accessed 25 April 2020]. Available from:
http://acv.ibict.br/wp- content/uploads/2019/07/Relat%C3%B3rio-de-Recomenda%C3%A7%C3%B5es-de-Modelos-de-Avalia%C3%A7%C3%A3o-de-Impacto-para-o-Contexto-Brasileiro.pdf
UNITED NATIONS, 2011. World Population Prospect: the 2010 Revision, CD-rom Edition. – File 1: Total population (Both sexes combined) by Five-year Age Group, Major Area, Region and Country, 1950-2100, Variant “Estimates.” New York, NY: Department of Economic and Social Affairs, Population Division.
VAN GOETHEM, Thomas M.W. J., PREISS, Philipp, AZEVEDO, Ligia. B., ROOS, Joachim, FRIEDRICH, Rainer, HUIJBREGTS, Mark. A.J. and VAN ZELM, Rosalie, 2013. European characterization factors for damage to natural vegetation by ozone in life cycle impact assessment. Atmospheric Environment. October 2013. Vol. 77, p. 318– 324. DOI 10.1016/j.atmosenv.2013.05.009.
VAN ZELM, Rosalie, HUIJBREGTS, Mark A.J., DEN HOLLANDE, Henri A., VAN JAARSVELD, Hans A., SAUTER, Ferd J., STRUIJS, Jaap, VAN WIJNEN, Harm J. and VAN DE MEENT, Dik, 2013. Human health damage due to pm10 and ozone20. In: ReCiPe 2008 A life cycle impact assessment method which comprises harmonised category indicators at the midpoint and the endpoint level [online]. Bilthoven, Netherland: RIVM. p. 133. [Accessed 25 April 2020]. Available from:
https://www.rivm.nl/sites/default/files/2018-11/ReCiPe%202008_A%20lcia%20method%20which%20comprises%20harmonised%20category%20indicators%2 0at%20the%20midpoint%20and%20the%20endpoint%20level_First%20edition%20Characterisation.pdf
VAN ZELM, Rosalie, HUIJBREGTS, Mark A.J., DEN HOLLANDER, Henri A., VAN JAARSVELD, Hans A., SAUTER, Ferd J., STRUIJS, Jaap, VAN WIJNEN, Harm J. and VAN DE MEENT, Dik, 2008. European characterization factors for human health damage of PM10 and ozone in life cycle impact assessment. Atmospheric Environment. January 2008. Vol. 42, no. 3, p. 441–453. DOI 10.1016/j.atmosenv.2007.09.072.
VAN ZELM, Rosalie, PREISS, Philipp, VAN GOETHEM, Thomas, VAN DINGENEN, Rita and HUIJBREGTS, Mark, 2016. Regionalized life cycle impact assessment of air pollution on the global scale: Damage to human health and vegetation. Atmospheric Environment. June 2016. Vol. 134, p. 129–137. DOI
10.1016/j.atmosenv.2016.03.044.
WORLD HEALTH ORGANIZATION [WHO], 2014. Metrics: Disability-Adjusted Life Year (DALY). WHO [online]. 11 March 2014. [Accessed 26 April 2020]. Available from: