STEFAN ABREU FERNANDES
EVOLUTION OF IMMUNE GENES IN
ANTARCTIC FISH
UNIVERSIDADE DO ALGARVE
Faculdade de Ciências e Tecnologia
STEFAN ABREU FERNANDES
EVOLUTION OF IMMUNE GENES IN
ANTARCTIC FISH
Mestrado em Biologia Marinha
Trabalho efetuado sob a orientação de:
Professor Doutor Adelino V.M. Canário (UAlg/CCMAR)
Professor Doutor LiangBiao Chen (Shanghai Ocean University)
UNIVERSIDADE DO ALGARVE
Faculdade de Ciências e Tecnologia
EVOLUTION OF IMMUNE GENES IN ANTARCTIC FISH
Declaração de autoria de trabalho
Declaro ser o autor deste trabalho, que é original e inédito. Autores e trabalhos consultados estão devidamente citados no texto e constam da listagem de referências incluída.
_________________________________________ (Stefan Abreu Fernandes)
A Universidade do Algarve reserva para si o direito, em conformidade com o disposto no Código do Direito de Autor e dos Direitos Conexos, de arquivar, reproduzir e publicar a obra, independentemente do meio utilizado, bem como de a divulgar através de repositórios científicos e de admitir a sua cópia e distribuição para fins meramente educacionais ou de investigação e não comerciais, conquanto seja dado o devido crédito ao autor e editor respetivos.
Agradecimentos
I would like to thank my supervisors, Professor Adelino V.M. Canário and Professor LiangBiao Chen, for their guidance and without whom I wouldn’t have had the oportunity to do part of my thesis at the Shanghai Ocean University.
Obrigado, à professora Teresa Modesto pela sua disponibilidade e pelo seu apoio ao longo do meu mestrado, à professora Rita Castilho pela motivação e orientação que me permitiram finalizar a minha tese e à Doutora Regina Cunha pela a ajuda na elaboração dos meus resultados.
Obrigado, aos investigadores e técnicos do grupo de encdocrinologia comparativa e biologia integrativa do CCMAR que me acolheram num ambiente produtivo e com quem aprendi muito ao longo do meu percurso.
Um grande obrigado aos meus amigos, ao João pela sua honestidade e apoio que me permitiram melhorar a minha tese, à Ana que sempre que preciso está disposta a ajudar-me mesmo que isto signifique ficar horas ao telefone, à Raquel que com as palavras certas torna tudo mais fácil de concretizar, e ao Daniel sem quem a minha estadia em Xangai não teria sido tão aventurosa. Vocês foram os meus exemplos de insipiração e determinação que me ajudaram a concretizar a minha tese.
Aos meus pais, irmãos, cunhados e sobrinhos, obrigado por toda a força, amor, carinho e coragem que me deram mesmo a milhares de quilômetros de distância e por sempre me terem apoiado nas minhas escolhas que me permitiram alcançar este objetivo, por tudo isso e muito mais, obrigado.
ii
Resumo
A superordem dos Notothenioidei inclui o maior número de representantes the peixes ósseos na plataforma continental da Antártida. As condicões abióticas e bióticas que dominam nesta região do mundo levaram à radiação e à especiação desta ordem. As baixas temperaturas que se deram durante o período do Eoceno Tardio levaram à flutuação da superfície ocupada pela calota glaciar no Oceano Antártico o que levou a uma redução do habitat disponível na plataforma continental. Por sua vez, a falta de habitat foi seguida por um declínio nas espécies de peixes ósseos e a uma alteração na relação predador-presa o que permitiu dispersão e diversificação das espécies que se adaptaram ao novo meio ambiente. Há 25 milhões de anos as condições ambientais tornaram-se mais estáveis criando um ambiente dominado por águas frias, ricas em oxygénio e nutrientes o que promoveu a adaptação radiativa dos Notothenoids. Os novos nichos ecológicos associados a condições ambientais estáveis providenciaram aos Notothenoids os requisitos para se tornarem a ordem de peixes ósseos domiante na plataforma continental da Antártida. Um dos pontos de interesse por esta ordem de peixes ósseos deve-se ao facto de ainda não se perceber qual será o impacto do aquecimento global nestas espécies. As diversas adaptações presentes nas várias espécies desta ordem também representam um fator de peso no que leva ao seu interesse científico. Estas vão desde elevada densidade de mitocôndrias e maior dimensão do miocárdio, à perda de resposta das proteínas de choque térmico, perda de hemoglobina, à evolução de proteínas anticongelantes - as adaptações observadas indicam quão bem se deu a adpatação desta ordem a um ambiente extremo. Entretanto, já foram desenvolvidos trabalhos que evidenciam que o sistema imune destas espécies também foi sujeito a adaptações promovidas pelo meio ambiente da Antártida. De modo geral, o sistema imune permite aos organismos superar perturbações que vão ao encontro da sua homeostase. O estudo do sistema imune em vertebrados, como os peixes, pode revelar aspetos importantes para o entendimento da evolução do sistema imune em vertebrados mais complexos. O objetivo deste trabalho é de estudar a evolução de genes que se enquadram no sistema imune de três espécies de peixes ósseos da região Antártida, Eleginops maclovinus que reside na região sub-polar da Antártida e duas espécies cuja a distribuição é limitada ao oceano da Antártida pela corrente circumpolar, Notothenia coriiceps e Dissostichus mawsoni. Para tal, foram escolhidas cinco famílias de genes que se relacionam com o sistema imune, estas foram os toll-like receptors (TLR), immunoglobulin superfamily (IgSf), phosphoinositide-3-kinase (PIK3), AKT/protein kinase B (AKT3) e as semaphorins (Sema). Os genomas e transcriptomas de 8 espécies de peixes foram obtidos de bases de dados de livre acesso enquanto os genomas e transcriptomas das espécies da Antártida foram proporcionados pelo laboratório do Professor
LiangBiao Chen da Shanghai Ocean University. Depois de identificadas as sequências proteícas destas famílias no peixe modelo Danio rerio, procedeu-se a uma pesquisa de similaridade por BLAST entre estas últimas e os transcriptomas das restantes espécies de forma a identificar as sequências potencialmente homólogas. Estas sequências por sua vez foram filtradas de modo a somente reter, para cada família, as sequências que apresentavam um rácio de identidade desejado. Após um alinhamento múltiplo de sequências (MSA), foram escolhidos para cada uma das famílias o melhor modelo evolutivo. Com os MSA de amino ácidos foi possível construir para cada família uma árvore filogenética na qual foi possível identificar genes ortólogos. Com os genes ortólogos foi possível construir uma árvore filogenética de espécies. De seguida, os MSA de amino ácidos foram convertidos para alinhamentos de codões para permitir a estimação da taxa de substituição de nucleótidos nas árvores filogenéticas das espécies, que é dada por v= dN/dS onde dN equivale à taxa de substituição não-sinónima e dS a taxa de substituição sinónima. Com o valor de dS foi então possível resolver a equação T=Ks/2r, em que T representa o tempo de divergência a ser calculado, Ks é taxa de substituição sinónima e r é a taxa de substituição estimada obtida da bibliografia. Os resultados relativos ao número de sequências e a análise filogenética permitiram identificar variabilidade no número de genes encontrados em cada espécie tal como também foi possível observar que, quando presentes, os ortólogos das 11 espécies formavam uma árvore filogenética distincta. Estas observações levaram a estipular, tanto para os Notothenoids como para os restantes taxa analisados, que estas famílias de genes se enquadram num processo evolutivo denomiado de processo de nascimento e morte. As estimações dos tempos de divergência, obtidos nos nós para cada família de genes que representada num maior número de espécies resultaram em tempos de divergência similares ou superiores às estimativas dadas pelos registos fósseis. Por sua vez, os nós que apresentavam um menor número de epécies, indicaram tempos de divergência mais recentes do que os registos fósseis. As cinco famílias de genes nos Nototheniidae indicaram tempos de divergência recentes desde 7.1 milhões de anos (m.y.a) para Sema, 6.2 m.y.a para AKT3, 4.3 m.y.a para IgSf, 4 m.y.a para PIK3 e 2.5 m.y.a para TLR. As diferenças obtidas entre os tempos de divergência das cinco famílias de genes revelam uma possível relevância perante a adaptação dos Nototheniidae ao ambiente antártico, pois as famílias de genes que apresentam funções mais diversas também apresentam tempos de divergência mais antigos (Sema, AKT3, PIK3, IgSf) do que as famílias de genes com funções somente immunologicas (TLR). Finalmente, foi possível observar que estes tempos de divergência incluem-se dentro das estimativas cronológicas dadas para um fenómeno climatérico conhecido como transição climatérica do mioceno médio (MMCT) que
iv ocurreu entre os 25-5 m.y.a. Esta correlação levou a considerar que as adaptações do sistema imune dos nototheniidae sejam subsequentes ao MMCT.
Palavras-chave: Peixes da Antártida, adaptação, genes da imunidade, famílias de genes,
Abstract
The Notothenioidei suborder has the largest representation of teleost fish in the Antarctic continental shelf. Their speciation and adaptive radiation was the result of particular abiotic and biotic conditions in the Southern Ocean. During the Late Eocene the cooler temperatures enlarged the ice cover leading to the loss of shelf habitat. This loss of natural environment resulted in a decline of fish diversity followed by the radiation and diversification of those who could adapt to the new conditions. Since then, the stable environment that has governed the Southern Ocean for the last 25 million years promoted the adaption of Notothenoids to cold, oxygen rich waters, allowing them to become the main teleost suborder in the Antarctic shelf habitats. Furthermore, previous work has shown that in Notothenoids immune related genes have undergone adaptations due to their exposure to the environmental conditions of the Antarctic Ocean. Their immune related adaptations give us the opportunity to study the phylogenetic diversification among Notothenioids and other teleosts that adapted to different environments. We studied the evolution of five immune related gene families in eight non-Antarctic vertebrates and three notothenoids, Eleginops maclovinus, Notothenia coriiceps and
Dissostichus mawsoni, through phylogenetic analysis and divergence times estimation using
nucleic and protein sequences. Genes for five different gene families were obtained from the genome and transcriptome of the investigated species. A possible birth-and-death process may have been identified for the five immune gene families. Furthermore, the divergence times estimated for the nototheniidae indicate that after the Middle Miocene climatic transition, those species relied on the gene families that presented a broader range of functions for their adaption to the Antarctic environment.
vi
Table of contents
Agradecimentos ... i Resumo ... ii Abstract ... v Table of contents ... viIndex of figures ... viii
Index of tables ... x
List of abbreviations ... xi
1. Introduction ... 1
1.1 The Antarctic Ocean ... 1
1.2 Fish Immunology ... 2
1.3 The immune system of Antarctic fish ... 4
1.4 Fish genome evolution ... 5
1.5 Gene families ... 6
1.5.1 Toll-Like Receptors ... 7
1.5.2 The Immunoglobulin superfamily ... 7
1.5.3 Semaphorins ... 8
1.5.4 PIK3-AKT3 ... 9
1.6 Homology ... 10
1.7 Sequence alignment and model selection ... 12
1.8 Phylogenetic trees ... 13
1.9 Nucleotide substitution and Divergence Time ... 14
2. Objectives ... 16
3. Material and Methods ... 17
3.2 Sequence retrieval ... 17
3.3 Homology ... 18
3.4 Sequence alignment and model selection ... 18
3.5 Phylogenetic analysis ... 19
3.5.1 Gene Trees ... 19
3.5.2 Species Trees ... 19
3.6 Nucleotide substitution rate (v = dN/dS) ... 20
3.7 Divergence time ... 20
3.8 Fossil and biogeographic node ages estimates ... 21
4. Results ... 23
4.1 Sequence retrieval ... 23
4.2 Phylogenetic analysis ... 24
4.2.1 Gene family Trees ... 24
4.2.2 Species Trees ... 31
4.3 Divergence time estimate ... 37
5. Discussion ... 39
5.1 Sequence retrieval & Phylogenetic analysis ... 39
5.2 Divergence time analysis ... 43
6 References ... 47
viii
Index of figures
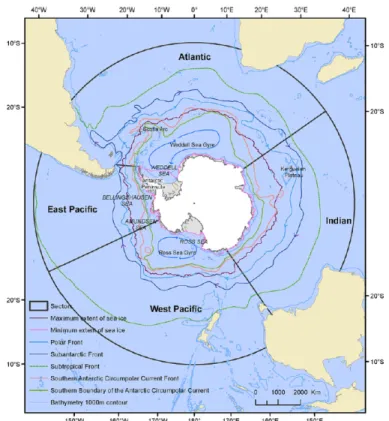
Figure 1.1: Representation of the Southern Ocean with minimum and maximum extent of sea
ice and the Southern Boundary of the Antarctic Circumpolar Current, and the 1000 m countour.(Adapted from Constable et al., (2014).
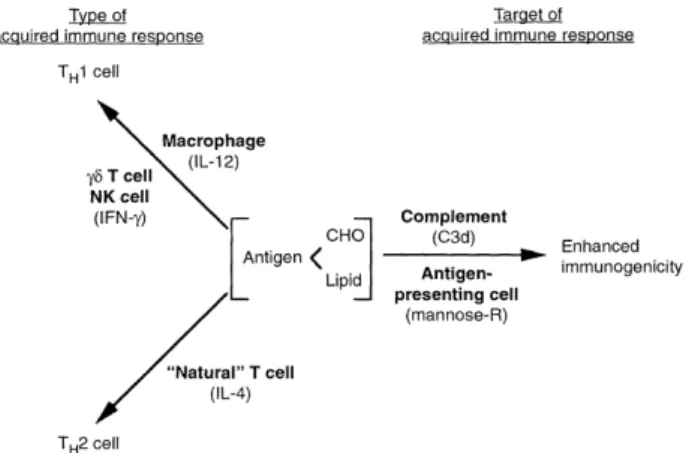
Figure 1.2: Representation of the two components of the immune system with the innate
immunity represented in boldface. The innate system recognizes the pathogens and indicates to the adaptive system which are the complementary antigens (Adapted from Fearon & Locksley (1996))
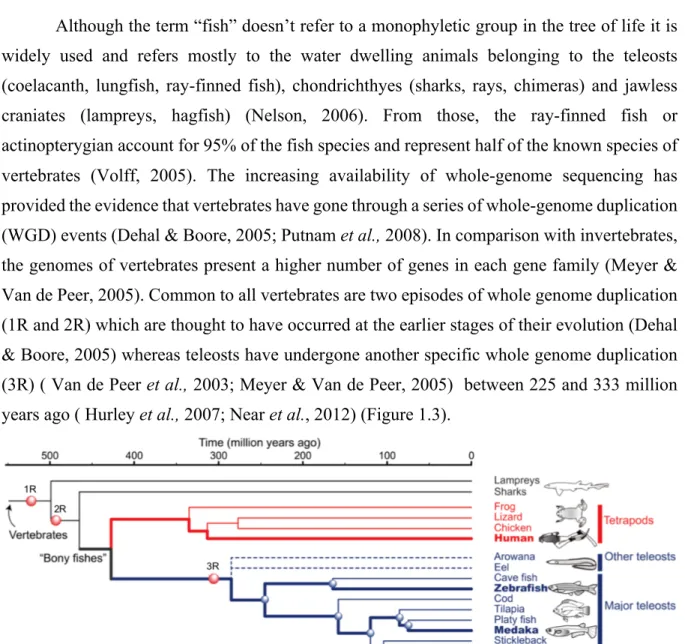
Figure 1.3: Species tree showing major vertebrate groups and their evolutionary relationship
with the 3 rounds of whole genome duplication. 1R and 2R corresponds to the two whole genome replications in the vertebrate stem. 3R corresponds to the whole genome replication specific to teleost fish. Adapted from (OIST).
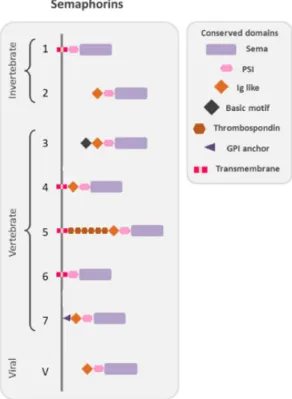
Figure 1.4: Schematic representation of the protein structure of semaphorin. Semaphorins are
represented in their classification into eighth classes. Their conserved domains are drawn in different shapes and colors as indicated in the figure. Class 1 and 2 are found in invertebrates whereas class 3 to 7 are found in vertebrates and class V in viruses. Domains abbreviations: PSI (plexin semaphorin integrin); Ig-like (immunoglobulin like); GPI, (glycosylphosphatidylinositol) anchor. Adapted from Messina & Giacobini (2013).
Figure 1.5: Representations of the PIK3-ATK-signaling pathway. The orange circles indicate
the reviewed immune related genes. Adapted from Kanehisa et al., (2016).
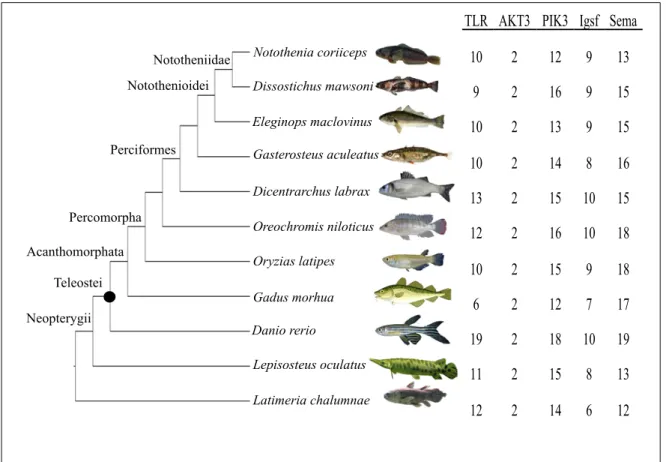
Figure 4.1: Cladogram of species with the number of genes retrieved in each gene family
(TLR, AKT3, PIK3, IgSf, Sema). The black dot (l) indicates the teleost whole genome duplication. The number of duplicates is not included. The accession numbers of each gene is given in Table SI.3. The source of the species images may be found by their names in the References section.
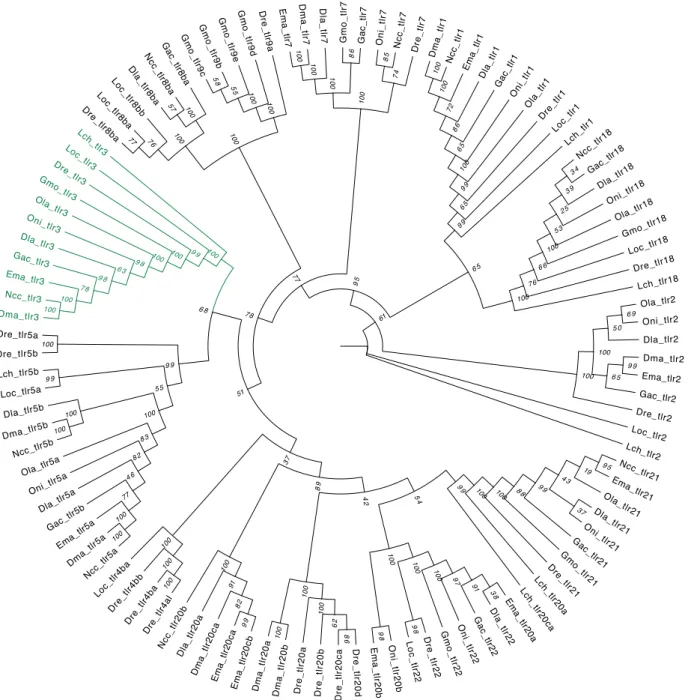
Figure 4.2: Phylogenetic Maximum-Likelihood gene tree for toll-like receptor family of Notothenia coriiceps (Ncc), Eleginops maclovinus (Ema), Dissostichus mawsoni (Dma), Dicentrarchus labrax (Dla), Danio rerio (Dre), Lepisosteus oculatus (Loc), Oreochromis niloticus (Oni), Oryzias latipes (Ola), Gadus morhua (Gmo), Gasterosteus aculeatus (Gac) and Latimeria chalumnae (Lch). The tree was generated by RaxML (v0.5.1 Beta) with 1000
bootstrap estimates and a VT+G+F substitution model. The bootstrap values are given in italic next to the nodes. The green highlighted tlr3 subtree represents the only subtree composed by all the orthologs.
Figure 4.3: Phylogenetic Maximum-Likelihood gene tree for AKT serine/threonine kinase 3 family of Notothenia coriiceps (Ncc), Eleginops maclovinus (Ema), Dissostichus mawsoni (Dma), Dicentrarchus labrax (Dla), Danio rerio (Dre), Lepisosteus oculatus (Loc), Oreochromis niloticus (Oni), Oryzias latipes (Ola), Gadus morhua (Gmo), Gasterosteus aculeatus (Gac) and Latimeria chalumnae (Lch). The tree was generated by RaxML (v0.5.1 Beta) with 1000 bootstrap estimates and a JTT+G substitution model. The bootstrap values are given in italic next to the nodes.
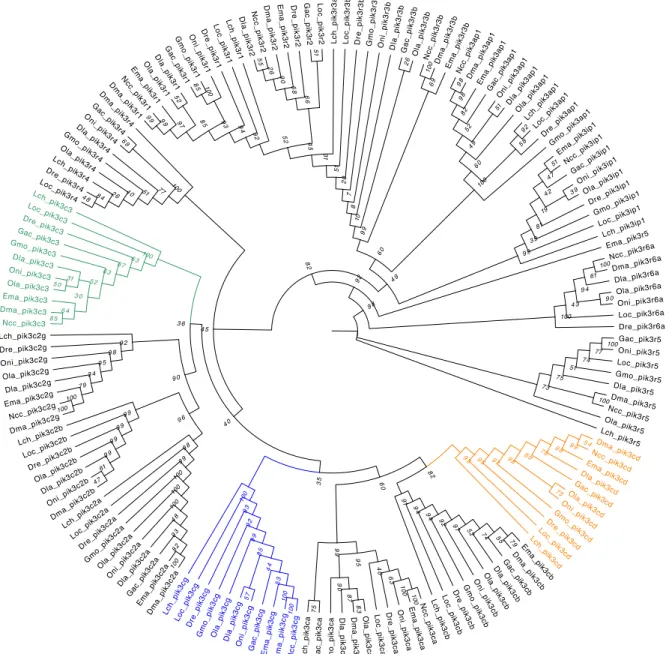
Figure 4.4: Phylogenetic Maximum-Likelihood gene tree for phosphatidylinositol 3-kinase of Notothenia coriiceps (Ncc), Eleginops maclovinus (Ema), Dissostichus mawsoni (Dma), Dicentrarchus labrax (Dla), Danio rerio (Dre), Lepisosteus oculatus (Loc), Oreochromis niloticus (Oni), Oryzias latipes (Ola), Gadus morhua (Gmo), Gasterosteus aculeatus (Gac) and Latimeria chalumnae (Lch). The tree was generated by RaxML (v0.5.1 Beta) with 1000 bootstrap estimates and a VT+G+F substitution model. The bootstrap values are given in italic next to the nodes. The subfamilies containing the eleven orthologs pik3c3, pik3cd and pik3cg are highlighted in respectively green, orange and blue.
Figure 4.5: Phylogenetic Maximum-Likelihood gene tree for immunoglobulin superfamily between Notothenia coriiceps (Ncc), Eleginops maclovinus (Ema), Dissostichus mawsoni (Dma), Dicentrarchus labrax (Dla), Danio rerio (Dre), Lepisosteus oculatus (Loc), Oreochromis niloticus (Oni), Oryzias latipes (Ola), Gadus morhua (Gmo), Gasterosteus aculeatus (Gac) and Latimeria chalumnae (Lch). The tree was generated by RaxML (v0.5.1 Beta) with 1000 bootstrap estimates and a VT+G+F substitution model. The bootstrap values are given in italic next to the nodes. The subfamilies containing the eleven orthologs IgSf3 and IgSf8 are highlighted in orange and blue respectively.
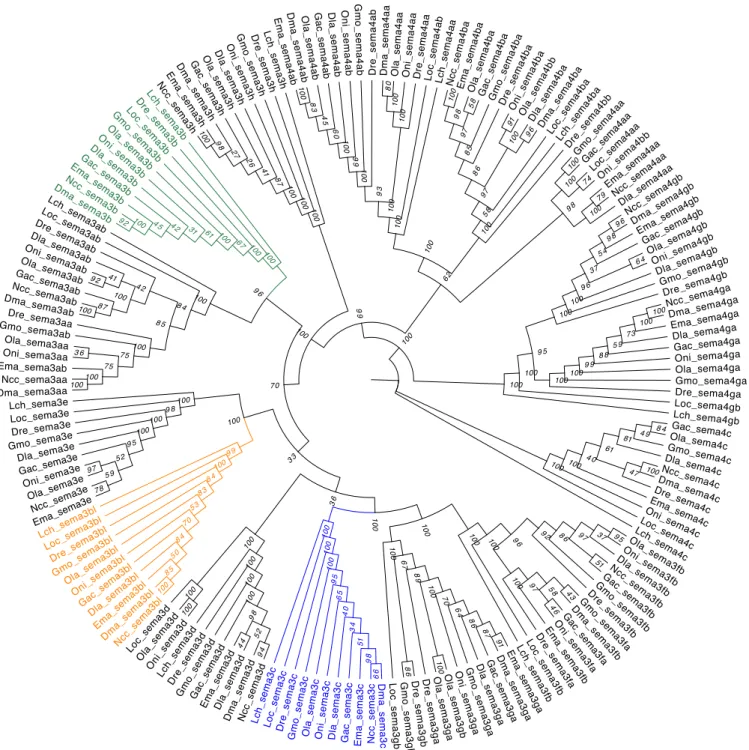
Figure 4.6: Phylogenetic Maximum-Likelihood gene tree for semaphorin family of Notothenia coriiceps (Ncc), Eleginops maclovinus (Ema), Dissostichus mawsoni (Dma), Dicentrarchus labrax (Dla), Danio rerio (Dre), Lepisosteus oculatus (Loc), Oreochromis niloticus (Oni), Oryzias latipes (Ola), Gadus morhua (Gmo), Gasterosteus aculeatus (Gac) and Latimeria chalumnae (Lch). The tree was generated by RaxML (v0.5.1 Beta) with 1000
bootstrap estimates and a JTT+I+G+F substitution model. The bootstrap values are given in italic next to the nodes. The subfamilies containing the eleven orthologs sema3b, sema3bl and sema3c are highlighted in respectively green, orange and blue.
Figure 4.7: Phylogenetic Maximum-Likelihood tree for toll-like receptor based on 11 1:1 orthologous protein sequences from eleven fish, showing the relationships between Notothenioidei (N. coriiceps, E. maclovinus, D. mawsoni) and other fish species. The tree
was generated by RaxML (v0.5.1 Beta) with an VT+G+F substitution model. The actinopterygian L. chalumnae was used as outgroup. The bootstrap values are given in italic next to the nodes.
Figure 4.8: Phylogenetic Maximum-Likelihood tree for AKT serine/threonine kinase 3 based on 11 1:1 orthologous protein sequences from eleven fish, showing the relationships between Notothenioidei (N. coriiceps, E. maclovinus, D. mawsoni) and other fish species.
The tree was generated by RaxML (v0.5.1 Beta) with an VT+G+F substitution model. The actinopterygian L. chalumnae was set as outgroup. The bootstrap values are given in italic next to the nodes.
Figure 4.9: Phylogenetic Maximum-Likelihood tree for phosphatidylinositol 3-kinase based on 33 1:1 orthologous protein sequences from eleven fish, showing the relationships between Notothenioidei (N. coriiceps, E. maclovinus, D. mawsoni) and other fish species.
The tree was generated by RaxML (v0.5.1 Beta) with an VT+G+F substitution model. The actinopterygian L. chalumnae was used as outgroup. The Bootstrap values are given in italic next to the nodes.
x
Figure 4.10: Phylogenetic Maximum-Likelihood tree for immunoglobulin superfamily based on 33 1:1 orthologous protein sequences from eleven fish, showing the relationships between Notothenioidei (N. coriiceps, E. maclovinus, D. mawsoni) and other fish species.
The tree was generated by RaxML (v0.5.1 Beta) with an VT+G+F substitution model. The actinopterygian L. chalumnae was used as outgroup. The bootstrap values are given in italic next to the nodes
Figure 4.11: Phylogenetic Maximum-Likelihood tree for semaphorin based on 33 1:1 orthologous protein sequences from eleven fish, showing the relationships between Notothenioidei (N. coriiceps, E. maclovinus, D. mawsoni) and other fish species. The tree
was generated by RaxML (v0.5.1 Beta) with an VT+G+F substitution model. The actinopterygian L. chalumnae was used as outgroup. The bootstrap values are given in italic next to the nodes
Figure 4.12: Divergence time estimates in millions of years for seven nodes, calculated with the synonymous substitution rate obtained for the five gene families, toll-like receptor (pink), AKT serine/threonine kinase 3 (red), phosphatidylinositol 3-kinase (green), immunoglobulin superfamily (olive) and semaphorins (blue) and fossil representation of the studied fish phylogeny. The circles represent the mean estimated
divergence times and the whiskers mark the upper and lower limit of the 95% confidence interval for the age estimates. The gray boxes represent age estimate for the appearance of the node which were assigned with the fossil information retrieved from the literature (Materials and Methods). The mean values with their confidence intervals may be found in Table SI.5.
Index of tables
Table 2.1: Number of sequences retrieved for the five gene families. The model with the
highest score was selected for the construction of the ML-Gene trees.
Table 2.2: Number of sequences retrieved for 3 concatenated supergenes PIK3, IgSf, Sema
and for 2 single gene orthologous sequence TLR and AKT3. The model with the highest score was selected for the construction of the ML-Species trees.
Table 3.1: Pairwise synonymous substitution value (dS-value) and the calculated divergence
time (million years ago) from one-to-one concatenated genes between, N. coriiceps (Ncc), D.
mawsoni (Dma), E. maclovinus (Ema) and G. aculeatus (Gac), using the estimated substitution
List of abbreviations
ACC - Antarctic circumpolar current AFGP - antifreeze glycoprotein AKT3 - AKT/ protein kinase B dN - Non-synonymous (dN)
dS - Synonymous substitutions (dS) IgSf - Immunoglobulin superfamily MHC - Major histocompatibility complex MRCA - Most recent common ancestor MSA - Multiple sequence alignments m.y.a - Million years ago
PIK3 - Phosphoinositide-3 kinase SI - Supplementary information SI Sema - Semaphorin
TLR - Toll-like receptor
TSWGD - Teleost-specific Whole Genome Duplication WGD - Whole genome duplication
1
1. Introduction
1.1 The Antarctic Ocean
The Antarctic or Southern Ocean has been a cold and stable environment for the last 20 million years (Dayton et al., 1994) when the land bridges between East Antarctica and Australia (Tasmanian gateway) around 35.5 m.y.a (Stickley et al., 2004) and between South America and the Antarctic Peninsula (Drake Passage) were interrupted allowing the circulation of a circumpolar current, the Antarctic circumpolar current (ACC) ( Lyle et al., 2007; Pfuhl & McCave, 2005).These events were caused by the displacement of tectonic plates, isolating the Antarctic continent and altering the atmospheric circulation leading to a cooling of this region (Cristini et al., 2012) . The currently extended ice-sheet cover that expands over the Southern Ocean is believed to have started during the Eocene-Oligocene transition period when the low pCO2 and the cooling of Antarctic sea water gave rise to a global “Ice-house” state (Sijp et al.,
2014) (Fig.1.1). Not only did this global cooling and expanding ice-sheet shaped the landscape of the southern pole, it has also changed the subaquatic landscape by occupying a great extent of the continental shelf (Clarke et al., 2004). During the last glacial maxima the ice sheet extension reached as far as the continental shelf (MacKintosh et al., 2011).
The ACC is the major current of the Antarctic Ocean and the largest of the earth (Mintenbeck, 2017) with current speeds of 173 Sv (1 Sv equals 106m3 s−1) (Donohue et al.,
2016) flowing from west to east connecting the various ocean basins while distributing heat and nutrients (Hassold et al., 2009), acting as a boundary between the adjacent oceans and the Antarctic Ocean (Orsi et al., 1995). The Antarctic ocean is characterized by oxygen rich waters (Lu et al., 2016) with high nutrient concentrations (Dayton et al., 1994). The water temperature around the Antarctic continent is permanently low varying between +2°C and -2°C (Mintenbeck, 2017). During the polar summer when the poles have a continuous solar exposure the increasing temperature of sea surface stratifies the water column reduces the mixed layer depth and stimulates the phytoplankton bloom (Llort et al., 2015) which is one of the main starting points of the food web of this region (Constable et al., 2014).
Figure 1.1: Representation of the Southern Ocean with minimum and maximum extent of sea
ice and the Southern Boundary of the Antarctic Circumpolar Current, and the 1000 m countour. Adapted from Constable et al., (2014).
The ongoing increase in greenhouse gases due to anthropic activity is causing a global warming that is threatening the south pole by increasing the sea water temperature, melting the ice cover, and increasing stratification (Gupta et al., 2009). As a result, the ACC could start to slow down enhancing the mixing of the warmer waters of the adjacent oceans and increasing even more the sea water temperature of the Antarctic Ocean (Rusell et al., 2006). When looking at the future of the Antarctic continent under the scope of global warming one is compelled to think about the ecosystem that was established under unchanging stable conditions for the last 20 million years which included the endemic Notothenoid teleosts.
1.2 Fish Immunology
The first evidence of an early immune system is attributed to the phagocytic activity of unicellular amebae comparable to the phagocytic activity of macrophages in higher organisms (Desjardins et al., 2005). Nevertheless, a necessary ability to eliminate intruders or pathogens is the recognition of the self and non-self (Cooper, 2010). The non-specific innate immune system developed receptors (e.g toll-like receptors) that could identify features that were preserved on microbial pathogens like glycolipids of the cell-membrane and nucleic acids (Iwasaki & Medzhitov, 2015; Janeway, 1989; Takeda et al., 2003). To these toll-like receptors
3 has also been attributed an important role in acquired immune defences since they activate antigen specific T cells (Fearon & Locksley, 1996Schnare et al., 2001). It is to note that the bases of modern immunology reside in the phagocytosis theory presented by Metchnikoff who did his findings on starfish larvae (Tauber, 1992). Fish are considered an essential link to the study of the evolution of the vertebrate immune system because of their basal position and because they have the greatest number of species (Ahn et al., 2016). The innate immune system is essential for fishes since they are exposed to the aquatic environment from early developmental stages (Rombout et al., 2005). Besides, fish represent a significant contribution for the spread of the adaptive immunity in vertebrates since the adaptive immune system has its origin in primitive jawless fish (Litman et al.,2010).
The immune system allows animals to cope with everyday disturbances like injuries due to predation or infections by pathogens so as to maintain their homeostasis (Buchmann, 2014). Basically, when infected, the animal’s immune system acts as a feedback mechanism to the non-self pathogen by producing defenses that will eliminate the intruder. As to better conceptualize the immune system and understand what are the processes involved in the different immune responses, the immune system was artificially divided into two components the innate and the adaptive immunity (Schultz & Grieder, 1987) (Fig.1.2).
Figure 1.2: Representation of the two components of the immune system with the innate
immunity represented in boldface. The innate system recognizes the pathogens and indicates to the adaptive system which are the complementary anitgens (From Fearon & Locksley (1996)).
They differ in their origin and function where the innate immunity relies on non-specific germ line encoded receptor proteins and the adaptive immunity relies on gene recombinations (V(D)J recombination) that produce specific antigen-receptors on the surface of B and T cells that allows them to recognize a large number of antigens (Thompson, 1995). Phylogenetically the innate immune system predates the adaptive immunity since it can be found in all multicellular
organisms whereas the adaptive immunity is only found in vertebrates (Janeway & Medzhitov, 2002). Furthermore, the study of teleost immunity can provide interesting knowledge about the possibilities that immune related genes could be responsible for the diversification of species (Eizaguirre et al., 2009). For example, the cold adapted Atlantic cod (Gadus morhua) presents an interesting case study where immune related genes are thought to have brought forth speciation. Interestingly this species has lost the major histocompatibility complex (MHC) which is a key feature of the adaptive immune system (Star et al., 2011). The loss of MHC II genes triggered the compensatory expansion of MHC I gene complex but authors did not clarify which one arose first and if they were related. More recently, Malmstrøm et al., (2016) tried to unravel the relationship and order in which these events occurred so as to understand the role of immune related genes on speciation. As it turns out, the MHC II gene loss predates the MHC I gene expansion which could have triggered the gene expansion of MHC I genes, highlighting the role of MHC genes in teleost diversification.
1.3 The immune system of Antarctic fish
The Notothenoids are the most abundant and diverse teleost group in Antarctic waters and are a good example of a specific adaptive radiation known as species flock (Eastman & McCune, 2000). Notothenoids are mostly benthic fish specifically due to their lack of swim bladder but some species like D. mawsoni have developed a nearly pelagic lifestyle by reducing the density of their skeleton and by enhancing fat deposits (Eastman & Devries, (1981), Eastman, (2000)). Other adaptations that have contributed for their success in the extreme cold environment range from higher mitochondria density (O’Brien & Mueller, 2010), loss of the heat shock proteins response (Hofmann et al., 2000), increased myocardium (Johnston et al., 1983), loss of haemoglobin (Ruud, 1954) and evolution of anti-freeze proteins (Deng et al., 2010). The evolution of anti-freeze proteins was a fundamental part of their success in the southern Ocean (Montgomery & Clements, 2000). In Notothenoids two kinds of antifreeze molecules can be found, the antifreeze glycoproteins and the antifreeze proteins (Evans & DeVries, 2017). Chen et al., (1997) found that an antifreeze glycoprotein gene evolved from a pancreatic enzyme gene. In addition, Deng et al. (2010) also hinted that the origin of antifreeze proteins is linked to the neofunctionalization of an old sialic acid synthase gene. The work of Chen et al., (2008) that focused on the transcriptomic and genomic evolution of the Notothenoid fish revealed an up-regulation of innate immunity related genes that are suggested to be responsible for the prevention of oxidative stress due to high oxygen exposure in these fish. Similarly, Bilyk & Cheng (2013) also pointed to the enhanced over expression of genes related to innate immune response in the Notothenoid P.borchgrevinki. Additionally, when
5 exposed to a different pathogen agonist, bacterial or viral, N.coriiceps presented different immune responses (Ahn et al., 2016). While when exposed to bacterial pathogen, the immune response was based on antigen presentation, during a viral contamination the immune response induced the tumor necrosis factor (TNF) pathway. Ota et al.,( 2003) showed in two Notothenoid species that an immunoglobulin gene (IgM) had undergone adaptive selection to prevent protein disfunction due to the cold environment or degradation by coevolving parasites. All these specific adaptations of the immune system in Notothenoids allow us to study and finally understand their diversification in a such extreme environment.
1.4 Fish genome evolution
Although the term “fish” doesn’t refer to a monophyletic group in the tree of life it is widely used and refers mostly to the water dwelling animals belonging to the teleosts (coelacanth, lungfish, ray-finned fish), chondrichthyes (sharks, rays, chimeras) and jawless craniates (lampreys, hagfish) (Nelson, 2006). From those, the ray-finned fish or actinopterygian account for 95% of the fish species and represent half of the known species of vertebrates (Volff, 2005). The increasing availability of whole-genome sequencing has provided the evidence that vertebrates have gone through a series of whole-genome duplication (WGD) events (Dehal & Boore, 2005; Putnam et al., 2008). In comparison with invertebrates, the genomes of vertebrates present a higher number of genes in each gene family (Meyer & Van de Peer, 2005). Common to all vertebrates are two episodes of whole genome duplication (1R and 2R) which are thought to have occurred at the earlier stages of their evolution (Dehal & Boore, 2005) whereas teleosts have undergone another specific whole genome duplication (3R) ( Van de Peer et al., 2003; Meyer & Van de Peer, 2005) between 225 and 333 million years ago ( Hurley et al., 2007; Near et al., 2012) (Figure 1.3).
Figure 1.3: Species tree showing major vertebrate groups and their evolutionary relationship
with the 3 rounds of whole genome duplication. 1R and 2R corresponds to the two whole genome replications in the vertebrate stem. 3R corresponds to the whole genome replication specific to teleost fish. Adapted from (OIST).
After genome duplication the resulting pairs of genes (paralogs) can have different fates. Immediately after duplication the daughter genes present similar functions, lessening the selective constrains to keep both of the duplicates resulting in the loss of one duplicate (non-functionalization), the gain of a new function by one of the paralogs (neo-(non-functionalization), or each of the duplicated genes keeps a different subfunction of the ancestral gene that is complementary to the other duplicate and together work as one (subfunctionalization) and dosage selection where the duplicated changes are both kept presenting only few changes (Glasauer & Neuhauss, 2014). Although the teleost specific WGD cannot be considered as wholly responsible for the great diversity of fish (Hurley et al., 2007; Santini et al., 2009), authors have concluded that once a WGD has occurred it laid the foundations for posterior diversification (Berthelot et al., 2014; Glasauer & Neuhauss, 2014).
1.5 Gene families
One of the first authors to classify genes into families was Tomoko Ohta, defined as “a group of genes or nucleotide sequences with the following characteristics: multiplicity, close linkage, sequence homology, and related or overlapping functions” (Ohta, 1980). In 2008, Ohta (Ohta, 2008) additionally differentiated the gene families in multigene families, which are groups of genes with sequence homology and related overlapping functions, and the superfamilies, which are groups of proteins or genes of common origin with nonoverlapping functions. Gene families are seen as a valuable characteristic to the organization of the genome presenting varying degrees of complexity and number of genes (Ohta, 2008). The organization of genes into gene families has been useful for the creation of databases that order the nucleotide or amino acid sequences into gene families such as Pfam (Finn et al., 2018), Uniprot (Chen et al., 2017) and InteproScan (Mitchell et al., 2018).
Several sequence-based methods, that can be grouped into three categories, have been developed to identify members of a gene family (Frech & Chen, 2010). The first method groups genes into gene families by searching for similarities in sequence domains and motifs and is useful to identify gene function (Frech & Chen, 2010) as seen in the Pfam database (Finn et
al., 2018). The second method groups gene families by pairwise comparison of protein
sequences using clustering techniques (Bernardes et al, 2015). The third method is the construction of a phylogenetic tree which is implemented when the scope of the research is focused on the evolutionary history of a gene family (Song et al., 2017).
As presented by Hood et al., (1975), evolution is thought to act in concert through whole gene families not only in individual genes. By studying whole gene families, researchers were
7 able to identify their role in diversification of several species. Ramasamy et al., (2016) hypothesized that a change in the chemical-ecological environment caused the duplication of an olfactory gene family that led to the adaptation of Drosophila suzukii to the new conditions. Cortesi et al., (2015) proposed that gene loss, pseudogenization, and gene duplication in the opsin gene family led to adaptation of percomorph fish to the diverse light conditions at which they are found today. These authors pointed out to the relevance that comparative studies of gene family to unravel their evolution, could finally lead to a better conception of speciation.
1.5.1 Toll-Like Receptors
The toll-like receptors (TLRs) comprise the largest family of the pattern recognition receptors (PRRs) which recognize pathogen associated molecular patterns (PAMPs) (Takeuchi & Akira, 2010). Their contribution to the immune system is significant since their correct recognition of the PAMP’s initiates an adequate immune response (Kawai & Akira, 2010). TLRs are transmembrane proteins with the an extracellular domain composed of leucine-rich repeats (LRR) responsible for the recognition of the PAMPs, the transmembrane helical structure and the intracellular part known as the toll-interleukin receptor which mediates the signal transition for the immune response (Gay & Gangloff, 2007). TLRs play a pivotal role between innate and adaptive immune system (Werling et al., 2009). As part of the PRRs they are an integral part of the innate immune response (Kawai & Akira, 2010) and they are also responsible for the activation of adaptive immune responses by triggering the release of T-cell stimulators (Schnare et al., 2001).
In general, the number of genes belonging to the TLR gene family may vary, with mammals counting with 10-13 functional TLRs (Kawai & Akira, 2010) comprising TLR1-13 (Solbakken et al., 2016) and bony fish with up to 17 (Rebl et al., 2010) which may additionally include TLR14-26 (Solbakken et al., 2016). From the fish species where TLRs have been identified, zebrafish has 17 (Meijer et al., 2004), pufferfish 11 (Oshiumi et al., 2003) and cod 9 (Solbakken et al., 2016). All the TLR genes are regrouped into six bigger families, TLR1,
TLR3, TLR4, TLR5, TLR7 and TLR11 that are usually represented in different species by at
least one ortholog (Roach et al., 2005).
1.5.2 The Immunoglobulin superfamily
Genes encoding at least one immunoglobulin (Ig) domain are classified into the immunoglobulin superfamily and their proteins are relevant for the identification and elimination of exogenous entities (Garver et al., 2008). The structure of the Ig domain with its
stable structure but high variability in amino acid sequence is essential for the function of those proteins giving them a high degree of diversity (Halaby & Mornon, 1998).
Their diversity and their occurrence in a high number of taxa have made these proteins one of the largest families (Natarajan et al., 2015). The members of the immunoglobulin superfamily (IgSf) considered to be relevant to the immune response are identified by shared structural features that can be differentiated by function and size into two categories, a variable-domain (V-variable-domain) and a constant-variable-domain (C-variable-domain) (Natarajan et al., 2015). The different members of the IgSf present a broad variety of functions such as muscle proteins, surface antigen receptors, co-receptors of the immune system and cell ligand molecules (Natarajan et
al., 2015). Two of the most prominent IgSf-subfamilies are the T-cell receptors that act as
antigen receptors and the antigen presenting molecules such as the MHC, Class I and II (Lefranc, 2014).
1.5.3 Semaphorins
The semaphorin family has more than 30 representatives divided into eight subfamilies and can be found in invertebrates (Classes 1 and 2), vertebrates (Classes 3 to 7) as well as in viruses (Class V) (Fig. 1.4). (Goodman et al., 1999). They can be secreted or membrane-bound and are differentiated through sequence similarity and structural variation (Kikutani et al., 2007), having in common a sema domain relevant for the binding of specific receptors, a PSI domain (plexins, semaphorins, and integrins) and a terminal domain C (Janssen et al., 2010; Liu et al., 2010; Nogi et al., 2010).
Figure 1.4: Schematic representation of the
protein structure of semaphorin. Semaphorins are represented in their classification into eighth classes. Their conserved domains are drawn in different shapes and colors as indicated in the figure. Class 1 and 2 are found in invertebrates whereas class 3 to 7 are found in vertebrates and class V in viruses. Domains abbreviations: PSI (plexin semaphorin integrin); Ig-like (immunoglobulin like); GPI, (glycosylphosphatidylinositol) anchor. Adapted from Messina & Giacobini (2013).
9 Members of the semaphorin family (Sema) are involved in several biological processes such as immune, vascular development, endocrine system, cell migration, nervous system (Gu & Giraudo, 2013; Messina & Giacobini, 2013; Sun et al., 2017). Several classes of the semaphorin family have been found to play a role in the immune regulation of some organisms. In class 4, Sema4D is highly expressed in resting T-cells of lymphoid organs such as lymph nodes, spleen and thymus (Kumanogoh & Kikutani, 2003) and is coupled to the regulation of B-cells (Kumanogoh et al., 2000) whereas Sema4A is expressed in spleen, bone-marrow, dendritic cells and B cells and is involved in T-cell activation and proliferation (Kumanogoh
et al., 2002; Ito & Kumanogoh, 2016). In class 3, Sema3A and Sema3E have been associated
with the regulation of immune cell trafficking (Choi et al., 2008; Takamatsu et al., 2010). Of further interest is Sema7A which is expressed in CD4+, CD8+ thymocytes and on activated T-cells (Mine et al., 2000) and has been found to be involved in inflammatory immune response through stimulation of the production of macrophages and of cytokines in those macrophages and monocytes (Suzuki et al., 2007; Kang et al., 2014).
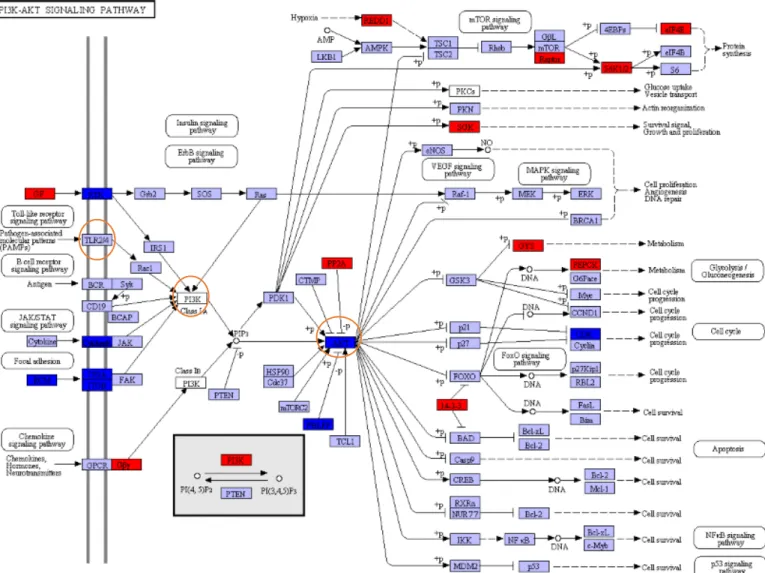
1.5.4 PIK3-AKT3
Phosphoinositide-3 kinase (PI3K or PIK3) are a family of lipid kinases present in all cells, producing phosphoinositides responsible for signalling pathways in several metabolic processes (Okkenhaug, 2013), including immune genes, as shown in the KEGG (Kyoto Encyclopedia of Genes and Genomes) annotated pathway (Fig.1.5). As mentioned in the extensive reviews of Koyasu (2003) and Okkenhaug & Vanhaesebroeck (2003) they are responsible for the regulation of TLRs, in lymphocyte development and in B- and T-cell regulation. Therefore, the PI3K-AKT-signaling pathway play an important role in the function of immune cells (Okkenhaug & Vanhaesebroeck, 2003). The TLR2 and TLR4 are a type of germline-encoded PRR important for transmembrane signalling pathways with a significant contribution to the immune system, since they enable the latter to recognize pathogenic particles initiating an adequate immune response (Kawai & Akira, 2010). Specifically, TLR4 are specialized in bacterial lipopolysaccharide recognition (Kawasaki & Kawai, 2014) whereas
TLR2 recognize a large array of microbial components including of parasitical, viral, fungal
and bacterial origins (Akira, et al., 2006). Troutman et al., (2012) supported that the interaction of TLR in the PI3K-AKT-signaling pathway is essential for the correct course of an immune-response. Moreover, as illustrated in Fig.1.5, AKT or protein kinase B is a key mediator in the PI3K-AKT-signaling pathway ensuring the proceeding of many of the metabolic steps (Lawlor & Alessi, 2001). The activity of the AKT protein is enhanced by its phosphorylation through the binding with a phosphoinositide (Li et al., 2002). This phosphorylation is the beginning of
a cascade of phosphorylation of other proteins to regulate several metabolic ways in the cell (Lin et al., 2009).
Figure 1.5: Representations of the PIK3-ATK-Signaling Pathway. The orange circles indicate
the reviewed immune related genes. Adapted from Kanehisa et al., (2016).
1.6 Homology
Richard Owen coined in 1843 for the first time the term homology as “the same organ
in different animals under every variety of form and function” (Owen, 1848). At that time Owen
didn’t consider the source of this similarity and referred to it manly in relation to structures that were located in the same position in different organisms (Hall, 2013). It was only after the publication by Charles Darwin’s of the Origin of Species (1859) and the postulation of the Theory of Evolution, which stated that all organisms descend from one common ancestor, that Ray Lankester (Lankester, 1870) introduced the notion that the similarity between structures was due to their shared ancestry.
Homology can be referred to as the similarity between two characters sharing a common ancestor and can be applied to different contexts such as structural, like the homology between tetrapod limbs (Amaral & Schneider, 2018), developmental as in the similarities between the processes that gave origin to a feature (Hall, 2013) and genetical as is the case between nucleotide sequences in DNA or amino acid sequences in proteins (Pearson, 2013).
It was Fitch (1970), based on the similarity concept of Owen, that applied the term homology to define homologous sequences as two or more sequences that present a high degree of similarity between them indicating a recent common ancestor. He also provided more specification by differentiating these homologous sequences as being orthologous or paralogous. As defined by Fitch (1970), when homologs originate due to a speciation event that occurred to the last common ancestor, they are called orthologs, whereas if two homologous sequences originate due to gene duplication then they are called paralogs. In most cases orthologues share similar functions and paralogs tend to diversify and specialize hence acquiring new functions (Koonin, 2005). Paralogs can subsequently be divided into two other subcategories based on the time of the duplication event. Paralogous sequences that arise from a lineage-specific duplication after a speciation event are termed as in-paralogs whereas if the duplication precedes the speciation event they are called out-paralogs (Koonin, 2005). The above mentioned distinctions have to be kept in mind for the downstream analysis of the phylogenetic trees, since it provides the means to understand if the relationships in the phylogenetic tree are due to speciation or duplication events (Salemi & Vandamme, 2003). As presented in (Pearson, 2013) the most used methodology to find homologous sequences is by applying a similarity search algorithm such as BLAST (Altschul et al. , 1990) that allows a rapid sequence similarity comparison between a reference species and a target species. A valuable strength of a sequence similarity search tools, are the statistics that are given for each match providing a mean to find the matches that are significantly similar, thus more likely to be homologous (Pearson, 2013). The Expect value (E) estimates the number of BLAST hits, presenting a similar score, which could occur by chance (Korf et al., 2003). A small E-value tells us that the possibility of a BLAST hit resulting from chance are low, thus we can deduce that this match is probably due to a high degree of similarity between the two sequences. By applying a threshold based on the E-value it is easier to define which are the best alignments that should be kept for a specific investigation. Depending on the research one has to pay attention to the nature of the sequences that have to be aligned. To detect homology on a closer time range a DNA:DNA alignment might be satisfactory since the evolutionary look-back that the DNA provides doesn’t extent further than 400 million years (Pearson, 2013). On the other hand, protein:protein alignments provide a more distant evolutionary look-back that can date to a last common ancestor shared 2.5 billion years ago (Pearson, 2013). Due to this difference,
the threshold E-value set between DNA:DNA alignments and protein:protein alignments has to differ (Pearson, 2013). A threshold of <0.001 is generally enough to assume that protein:protein alignments are homologous whereas for DNA:DNA alignments the value has to go as far as <10^-10 to assume homology (Pearson, 2013). Another way to look for possible homology between matched sequences is to check the percentage of shared identity (Pearson, 2013). This value represents the percentage of identical residues that are located in same position between two given sequences (amino acid or nucleotides) (Pearson, 2013; Fassler & Cooper, 2011). A minimum threshold of 30% identity can be considered sufficient to look for homologous sequences, when coupled with an appropriate E-value.
1.7 Sequence alignment and model selection
Multiple sequence alignments (MSA) are relevant in genomic and evolutionary studies, as they compare several protein or nucleotide sequences and identify their shared identical regions or homologous regions (Nuin et al., 2006). A MSA is built on a sequential pairwise alignment where the order of the sequences is given by a phylogenetic tree (Edgar & Batzoglou, 2006). A MSA organizes the sequences in a matrix where each row represents a sequence and each column indicates homologous sites where insertions or deletions are denoted by gaps (Elias, 2006). With the identification of such homologous regions it is possible to deduce the function, the structure and the phylogeny between a set of sequences (Elias, 2006) .
A phylogenetic analysis has to go through statistical inferences to be validated (Posada & Buckley, 2004; Kelchner & Thomas, 2007), hence the need for a model that best fits the replacement rate of the amino acids or the substitution rate of nucleic acids (Posada & Crandall, 2001). These models provide a mean to estimate the probabilities of the different changes that could occur to a nucleotide or amino acid along the phylogeny (Posada & Crandall, 2001). These changes can be modelled with different methods ranging from distance methods to maximum likelihood, or maximum parsimony with each one presenting their own set of parameters and differing in their degree of complexity (Posada & Crandall, 2001).To assess the reliability and choose the best fitting model a statistical test can to be carried out that will compare all the available models that are given for a data set by means of the Akaike information criterion (AIC) (Akaike, 1974) and Bayesian information criterion (BIC) (Schwarz, 1978; Posada & Crandall, 2001).
1.8 Phylogenetic trees
In a phylogenetic analysis, a phylogenetic tree provides a mean to identify the evolutionary relationship between organisms (Vandamme, 2003). Such a tree is composed of nodes and branches where each node represents a unit (species or sequence) and each node is connected to another by only one branch where the pattern obtained by the branching is called the topology (Vandamme, 2003). The specific case of the terminal nodes or branch tips are termed as OTU (operational terminal units) which are the units for the construction of the tree (Vandamme, 2003). A phylogenetic tree may be unrooted, where a common ancestor isn’t specified or rooted where one of the OTU is set as an outgroup to the other units of the tree, who then build the ingroup, resulting in an root node that represents the common ancestor to the ingroup and the outgroup (Vandamme, 2003; Horner & Pesole, 2004). Several methods, each presenting its sets of algorithms and assumptions, have been implemented to depict phylogenetic trees. These different types of approaches can be divided into two categories based on the method used to construct the tree, character-based or the distance based methods (Horner & Pesole, 2004). The distance based methods such as Neighbour-Joining or UPGMA rely on a matrix that compares the pairwise distances between the sequences and groups, or clusters the sequences by their level of similarity (Baldauf, 2003; Horner & Pesole, 2004). The character based methods such as Maximum-Likelihood, Maximum-Parsimony and Bayesian method compare the aligned sequences by looking for character substitution, where each position of the alignment is considered a character and the amino acid or nucleotide at this position is the state, to find the tree that best fits a given model of substitution (Vandamme, 2003; Horner & Pesole, 2004). Both kinds of methods have advantages and disadvantages; the distance based are faster to construct yielding only tree topology whereas the character-based can retrace the evolution of a specific site which in turn requires longer computational times (Baldauf, 2003). The choice of which method to use depends on the focus of the study but authors may consider comparing the trees obtained with different methods to confirm the phylogeny (Baldauf, 2003). Once a phylogenetic tree is built it is necessary to measure how accurate the dataset supports the tree (Baldauf, 2003; Horner & Pesole, 2004). Nowadays multiple methods can be used to estimate the reliability of a tree such as likelihood-based test, internal branch lengths, and bootstrapping (Z. Yang, 2014). The most commonly used is the bootstrap method where trees are randomly rebuild based on different subsamples of the original dataset and where the number of times a specific tree is built in each one of those subsamples is calculated (Baldauf, 2003; Horner & Pesole, 2004).
1.9 Nucleotide substitution and Divergence Time
A widespread method to analyse the evolutionary pressure exerted on protein-coding genes is the estimation of the ratio of non-synonymous (dN) to synonymous substitutions (dS) ω=dN/dS between a given set of sequences in a phylogeny (Mugal et al., 2014). By calculating this ratio one can infer the type and the strength of selective pressure, where ω>1 indicates positive selection, ω=1 indicates neutral evolution and ω<1 indicates purifying selection (Gharib & Robinson-Rechavi, 2013). The differences between the sequences are due to changes caused by mutations in the DNA (Loewe & Hill, 2010). Such a mutation can result in the insertion or deletion of nucleotides in the DNA sequence or the replacement of a nucleotide with another nucleotide called a substitution (Li & Graur, 2002). In case of a substitution there are two possible outcomes; a transversion where a pyrimidine changes to a purine or vice-versa, and a transition where a pyrimidine changes to a pyrimidine or a purine to a purine (Li & Graur, 2002). The effect of the substitution on the translation of the codon into a protein can be synonymous, there is no effect on the translation, or non-synonymous where an amino acid is translated into a different amino acid (Li & Graur, 2002). The outcome of a mutation that occurred in a single organism depends on the evolutionary processes acting on the population (natural selection and genetic drift) which may spread the mutation through all the organisms leading to the fixation of the mutation in the population or it may lead to the loss of the mutation (Jeffares et al., 2015). Depending on how it affects the fitness of an organism a mutation can either be advantageous by increasing fitness, deleterious by decreasing fitness or neutral when the effects of the mutation are so small that they don’t affect selection (Loewe & Hill, 2010). Non-synonymous substitutions are usually linked to negative changes to the structure and function of proteins consequently they are deleterious while synonymous substitutions, as they don’t change the amino acids, are neutral (Jeffares et al., 2015). Their neutral nature makes the synonymous substitutions less prone to selective pressure leading them to accumulate with a linear rate which in turn can be used as an approximation to estimate the relative divergence time between two sequences (Huerta-Cepas & Gabaldón, 2011). Common limitations to synonymous substitution rates as estimates of the divergence time are associated to the species used for the analysis since too closely related species will not provide enough differences to show any significant changes in divergence time and too distantly related species will have had time to accumulate several mutations on the same site causing what is called mutational saturation (Wilke et al., 2009). Nevertheless, the estimation of the divergence time between a set of sequences may be obtained from the number of synonymous substitutions seen between them as those are a result of the elapsed time since they separated from their last common
15 ancestor ( Wilke et al., 2009; Huerta-Cepas & Gabaldón, 2011). This approach is based on the assumptions of a molecular clock which considers that evolution takes place at a constant rate throughout lineages and that mutations are mostly neutral (Wilke et al., 2009).
2. Objectives
The evolutionary study of whole gene families may be a valuable tool to understand how a given species adapted to its environment. This may be achieved through a phylogenetic analysis of gene and species phylogenies, and estimation of the genes divergence times. This work aims to study the evolution of five immune related gene families, in one Sub-Antarctic and two Antarctic teleosts, Elegeniops maclovinus, Notothenia coriiceps and Dissostichus
mawsoni, respectively, by:
1) Identifying which was the evolutionary process that acted on the five gene families of the three target species through phylogenetic analysis.
2) Estimating the divergence time of five immune related gene families to understand if those estimations correlate to the adaptive radiation of notothenioids into the Antarctic Ocean.
17
3. Material and Methods
3.1 Fish species selection
The reference species used are one Sarcopterygian species the coelacanth (Latimeria
chalumnae) and ten Actinopterygii, zebrafish (Danio rerio), Nile tilapia (Oreochromis niloticus); sea bass (Dicentrarchus labrax); stickleback (Gasterosteus aculeatus); medaka
(Oryzias latipes); cod (Gadus morhua); bullhead notothen (Notothenia coriisceps); patagonian blenny (Eleginops macluvinus), antarctic toothfish (Dissostichus mawsoni) and spotted gar (Lepisosteus oculatus) These fish species have been chosen because a large amount of sequence data available that enable comparative studies of vertebrate evolution (Braasch et al., 2015; Xiao et al., 2015). The target species are two Antarctic species Notothenia coriiceps and
Dissostichus mawsoni and one Subantarctic specie Eleginops maclovinus.
3.2 Sequence retrieval
The genome (coding sequences) and transcriptome of the eleven species were retrieved from the National Center for Biotechnology Information (NCBI) database using BLAST that functions as a search program that allows a rapid sequence similarity comparison between a reference species and a target species (Altschul et al., 1990) or from the Ensembl genome database project. The genome (coding sequences) and transcriptome FASTA files of the majority of the species where retrieved from the ENSEMBL database (Zerbino et al., 2018) or from the Reference sequence (RefSeq) database of NCBI (O’Leary et al., 2016) using the
biomartr R package (Drost & Paszkowski, 2017) in Rstudio (Racine, 2012). The package script
provided was used without alterations except for the species name and directory specification. For further information about the retrieved genomes see Table SI.1. The genome (coding sequences) and transcriptome of Eleginops maclovinus, Notohenia coriiceps and Dissostichus
mawsoni were sequenced and assembled (unpublished data) by a team of researchers from
Shanghai Ocean University and provided by Professor Liangbiao Chen. With the help of an in-house script the query sequences of each gene family were retrieved from their respective transcriptome file.
Specifically, terms representing each family were introduced into the script that searched through the transcriptome FASTA file to retrieve the protein sequences whose headers included the terminology used. A gene family was considered a set of genes that presented an identical gene symbol or gene description, and as exemplified in the script 1 (SI Script1) each gene family was extracted based on those criteria. Once the transcript sequences
of the desired gene families were retrieved, another script (SI Script 2) was run to keep only the longest isoforms, and the resulting sequences, the candidate sequences, were kept for the downstream analysis. As presented in table 2.1 this process resulted in a varied number of sequences depending on the gene family, ranging from a minimum of 22 sequences for the AKT3 gene family to a maximum of 172 sequences for the semaphorin gene family.
3.3 Homology
The search for homologous sequences was performed using BLAST on a local server between the before mentioned candidate sequences of D. rerio and all the other reference species as well as target species based on an in-house script. The first step used BLASTP with an Expect value (e-value) threshold of 1e-5 followed by filtering so as to only keep the sequences that presented an identity ratio higher than 0.1. The final procedure comprises several sorting steps and an additional filtering of the retained sequences by applying another minimum identity ratio cut-off value of 0.3.
3.4 Sequence alignment and model selection
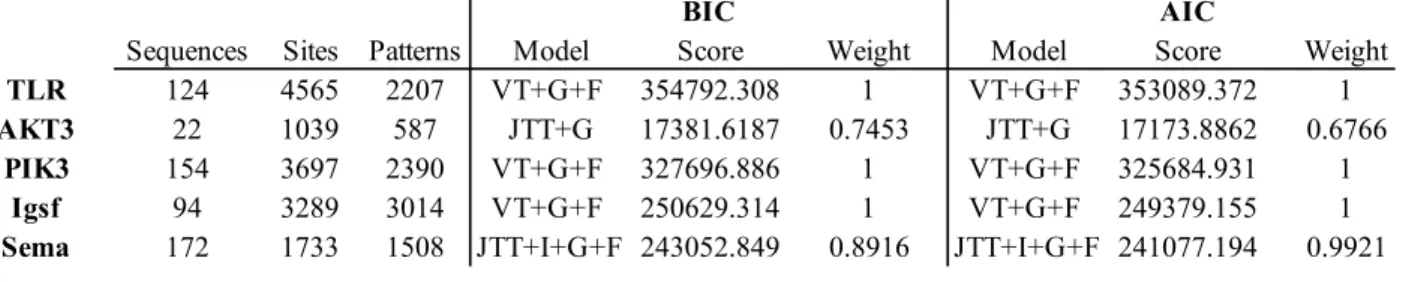
A combined file for each gene family containing the homologous sequences between the eleven species was created to proceed for a multiple sequence alignment generated using MUSCLE (v3.8.425) (Edgar, 2004). Once the homologous sequences aligned, the best amino acids replacement models were selected for each gene family with ModelTest-NG (v.0.1.0) (Posada & Crandall, 1998) based on Akaike information criteria (AIC) and Bayesian information criteria (BIC) (Table 2.1). The model selection was carried out against 114 protein replacement models. For the five gene families both AIC and BIC indicate the same model result. The amino acid alignments obtained with the above mentioned methodology were then submitted to the PAL2NAL (Suyama et al., 2006) to be converted to codon alignments for further estimation of nucleotide substitution rate and divergence time analysis.
Table 2.1 Number of sequences retrieved for the five gene families. The model with the highest
score was selected for the construction of the ML-Gene trees.
BIC AIC
Sequences Sites Patterns Model Score Weight Model Score Weight
TLR 124 4565 2207 VT+G+F 354792.308 1 VT+G+F 353089.372 1
AKT3 22 1039 587 JTT+G 17381.6187 0.7453 JTT+G 17173.8862 0.6766
PIK3 154 3697 2390 VT+G+F 327696.886 1 VT+G+F 325684.931 1
Igsf 94 3289 3014 VT+G+F 250629.314 1 VT+G+F 249379.155 1
19 The same procedure as the one mentioned above was applied to the orthologous sequences obtained for each of the gene families for the construction of the alignment of the species phylogenies. The best fitting model for each of the species phylogenies is presented in table 2.2.
Table 2.2 Number of sequences retrieved for 3 concatenated supergenes PIK3, IgSf, Sema and for 2 single gene orthologous sequence TLR and AKT3. The model with the highest score was selected for the construction of the ML-Species trees.
3.5 Phylogenetic analysis
3.5.1 Gene Trees
To understand the evolutionary history of the genes, five gene trees, one for each gene family of toll-like receptors (TLR), immunoglobulin superfamily (IgSf), phosphatidylinositol-4,5-bisphosphate 3-kinase (PIK3), AKT serine/threonine kinase 3 (AKT3), semaphorins (Sema), were constructed based on the aligned amino acid sequences of the 11 fish species
Notothenia coriiceps (Ncc), Eleginops maclovinus (Ema), Dissostichus mawsoni (Dma), Dicentrarchus labrax (Dla), Danio rerio (Dre), Lepisosteus oculatus (Loc), Oreochromis niloticus (Oni), Oryzias latipes (Ola), Gadus morhua (Gmo), Gasterosteus aculeatus (Gac) and Latimeria chalumnae (Lch). The sequence alignments and the gene family phylogenies were
inferred by the Maximum-Likelihood method using RaxML v0.5.1 Beta (Kozlov et al., 2018) selecting the corresponding model as shown in table 2.1, with a 1000 bootstrap estimates on the online CIPRES server (Miller et al., 2010).
3.5.2 Species Trees
Based on subfamily trees that presented all the eleven orthologous sequences, five ML-Tree species trees, one for each subfamily were build. The evolution of the five gene families was mapped on a species tree based on concatenated orthologous amino acid sequences of the eleven studied species. In each gene family tree, the subfamilies that presented all the eleven
BIC AIC
Sequences Sites Patterns Model Score Weight Model Score Weight
TLR 11 989 737 JTT+I+G4 25314.9991 0.9927 JTT+I+G4+F 25144.1749 0.9982
AKT3 11 510 217 JTT-DCMUT+I+G4 6448.6407 0.5191 JTT-DCMUT+I+G4 6359.718 0.5046
PIK3 11 3005 1648 JTT+I+G4+F 53708.1844 0.9911 JTT+I+G4+F 53467.8631 0.9986
Igsf 11 2800 1585 JTT+I+G4 51232.046 0.9964 JTT+I+G4+F 51025.7785 0.9683
studied species with a reliable topology were selected to proceed to the concatenation of the orthologous sequences. The concatenated sequences were then aligned using MUSCLE (v3.8.425) (Edgar, 2004). The sequence alignments and the species phylogenies were inferred by Maximum-Likelihood method in RaxML v0.5.1 Beta (Kozlov et al., 2018) selecting the corresponding model as shown in table 2.2, with 1000 bootstraps on the online available CIPRES server (Miller et al., 2010).
3.6 Nucleotide substitution rate (v = dN/dS)
The orthologous coding sequences obtained with PAL2NAL were concatenated before proceeding to the dN/dS estimation. The nucleotides substitution rate (v), the non-synonymous substitution rate (dN) and the synonymous substitution rate (dS) were then estimated using CODEML (PAML 4 package (Z. Yang, 2007)) based on a “free-model” (model= 1, runmode= -2), which performs a pairwise analysis and allows branch-specific values for v, dN and dS. A threshold to filter out the nodes presenting dS saturation was set at dS < 4.
3.7 Divergence time
Divergence time between gene families and species were calculated based on the synonymous substitution rate of the CODEML analysis. As presented by Wang et al., (2015) the equation T=Ks/2r can be applied to calculate the divergence time, where T is the divergence time to the most recent common ancestor, obtained from the Timetree database (Hedges et al., 2006), Ks is the synonymous substitution rate recovered from the CODEML analysis and r is the estimated substitution rate given as mutations per site per year which has to be calculated by a prior conversion of the equation r = (Ks/T)/2. In this study the number of genes retrieved is not enough to obtain a reliable estimated substitution rate and the value obtained by Wang
et al., (2015) was used. In their case they calculated the estimated substitution rate by using a
calibration point set at the divergence time between D. rerio (205 255 Mya), retrieved from the TimeTree database (Hedges et al., 2006), and five other species (O. latipes, G. aculteatus,
Takifugu rubripes,Tetraodon nigroviridis and G. morhua). From those six species five were
studied in this thesis. With this method the authors obtained a substitution rate of 5.7 – 6.4 × 10⁻⁹. This same substitution rate was then used here to estimate the divergence times.