FACULDADE DE CIÊNCIAS E TECNOLOGIA
SOME ASPECTS OF THE BEHAVIOUR OF PELAGIC SPECIES OFF
ANGOLA AND ITS IMPLICATION ON BIOMASS ESTIMATION
(Tese provisória para a obtenção do grau de doutor em Ciências e Tecnologias
das Pescas, especialidade de Biologia Pesqueira)
Filomena Vaz-Velho
FARO
(2011)UNIVERSIDADE DO ALGARVE
i
SOME ASPECTS OF THE BEHAVIOUR OF PELAGIC SPECIES OFF
ANGOLA AND ITS IMPliCATION ON BIOMASS ESTIMATION
(Tese provisória para a obtenção do grau de doutor em Ciências e Tecnologias
das Pescas, especialidade de Biologia Pesqueira)
Filomena Vaz-Velho
FARO
(2011)ii Este trabalho foi apoiado pela Fundação Calouste Gulbenkian (F.C.G.) através da bolsa de
doutoramento E-200542
AGRADECIMENTOS
Ao Instituto Nacional de Investigação das Pescas de Angola (INIP) por me ter dado as condições profissionais para realizar esta tese, mesmo que acumulando com o trabalho de
iii Adjunta para Área Técnica do Instituto Nacional de Investigação Pesqueira.
À Drª Victória de Barros Neto, Directora do INIP, e agora Secretária de Estado das Pescas, por ter sempre lutado por ter pessoal mais qualificado, e por ter sempre apoiado este meu projecto.
Ao Instituto de Investigação Marinha de Bergen, Noruega, e ao Programa Nansen, pelo apoio que sempre me proporcionaram no desenvolvimento do meu trabalho científico.
Ao Prof. Doutor Pedro Conte de Barros, orientador desta tese, por ter criado as condições para o desenvolvimento do meu trabalho, por acreditar sempre que eu tinha capacidade para o fazer e por não me deixar nunca desistir, mesmo quando o acumular do trabalho no INIP me fazia pensar que nunca teria tempo para acabar esta tese.
Aos meus co-autores por todos os seus ensinamentos ao longo dos anos que trabalhamos juntos.
Aos meus colegas do INIP, que sempre me acompanharam nos períodos mais difíceis, e graças aos quais dispomos hoje de uma excelente informação sobre os pequenos pelágicos de Angola.
À Fundação Calouste Gulbenkian, cujo apoio financeiro me permitiu realizar este projecto há muito adiado, e em particular à Drª Cláudia Leitão, cujo optimismo e confiança me inspirou mesmo quando o tempo precia escassear, no meio de todas as outras actividades e missões de serviço que me ocupavam o tempo do estudo
À minha família, que sempre me apoiou em todos os momentos.
ALGUNS ASPECTOS DO COMPORTAMENTO DAS ESPÉCIES PELÁGICAS EM
iv A pescaria de pelagicos contribui com 80% do total de pescado desembarcado e 75% de proteína animal da dieta alimentar da populção que vive na orla costeira de Angola. A estimação da abundância dos recursos pelágicos é efectuada, sobretudo através do método acústico que é sensível aos erros devidos ao efeito do comportamento dos peixes, particularmente os que redução à detecção dos peixes ao método acústico.
Este estudo descreve a variabibilidade interanual das principais espécies pelágicas da costa de Angola e o impacto do seu comportamento na estimação da abundância dos recursos. As duas principais espécies pelágicas, Carapau do Cunene e Sardinela spp tem dinâmica diferente. A biomassa de Sardinela nos últimos anos está estável, enquanto que a do carapau do Cunene está num nível crítico.
Relativamente ao comportamento, o carapu do Cunene tende a formar cardumes densos no fundo durante o dia. Durante a noite os cardumes dispersam-se à superfíce levando à obtenção de valores de densidade acústicos mais baixos. Em algumas condições os peixes evitam o navio verticalmente mergulhando para profundidades inferiores a 12m aquando da passagem do navio
Em geral, os resultados deste estudo vão ajudar a melhorar o conhecimento do comportamento das espécies pelágicas da costa de Angola e seu impacto na estimação da abundância e consequentemente melhorar o sistem de gestão.
Palavras-chave: Angola; Pelágicos; Acústica; Comportamento; Pesca; Estimação de
Abundância
SOME ASPECTS OF THE BEHAVIOUR OF PELAGIC SPECIES OFF ANGOLA
v Pelagic fish off Angola constitute about 80% of the total fish landed and 75% of animal protein in the diet of the coastal population. In Angola, the primary means for estimating abundance of small pelagic fish is through acoustic surveys, a method that is sensitive to errors caused by effects of fish behaviour, particularly those that may reduce the acoustic detectability offish.
This study describes the interannual variability of the fishery and stocks pelagic off Angola and their behaviour in relation to the abundance estimation. The dynamics of the two main pelagic species, Cunene horse mackerel and Sardinela spp off Angola differ. In recent years the biomass of Sardinela spp is at stable level, whereas the Cunene horse mackerel is at critical level.
It was observe that a relatively straightforward analysis of conventional acoustic survey data collected at a single- frequency combined with ancillary spatio-temporal information can provide useful indications on the identification of single- and multi species aggregations of small pelagic fish.
With regard to their behaviour, Cunene horse mackerel tend to concentrate in dense schools near the seabed, but at night they move into the pelagic zone, dispersing into widespread scattering layers. The present study found that under some conditions fish tend to avoid the vessel vertically, diving below 12 m depth as vessel was passing over the fish.
In general, the results of this study should help improve Angola improve the knowledge of the behaviour of pelagic species off Angola and the quality of the abundance estimations produced.
vi
General Introduction ... i
Hydrographic regime off Angola ... 1
Exploration of the sea in Angola ... 4
The scientific advisory process ... 7
History of acoustic abundance estimation surveys in Angola ... 8
Estimation of abundance of small pelagic fish using the acoustic method (principles and basic equations)... 9
Errors and uncertainty in acoustic abundance estimation ... 11
Rationale and structure of the thesis ... 17
Chapter II Resource and Ecosystem Variability, including regime shifts, in the Benguela current system ... 19 INTRODUCTION ... 21 RESOURCE VARIABILITY ... 24 ECOSYSTEM VARIABILITY... 47 PREDICTING VARIABILITY ... 53 Making predictions ... 57 CONCLUSIONS ... 63 REFERENCES ... 65
Chapter III Recent trends in Fishery and Abundance of pelagic species off Angola ... 80
Introduction ... 82
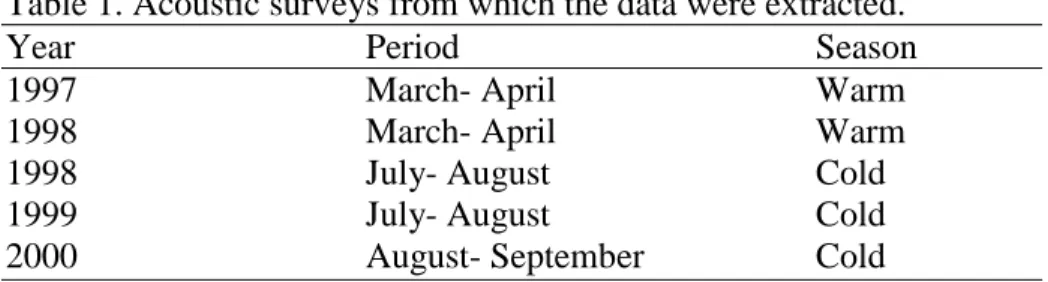
Source of data ... 83
Occurrence and stock identity ... 85
Current Status of Fishery ... 88
Changes in the Biomass of resources ... 89
Management Strategy ... 92
Ecological Interaction ... 94
Concluding remarks ... 95
References ... 97
Chapter IVIdentification of Acoustic Targets off Angola using General Discriminant Analysis. ... 100
Introduction ... 102
Material and Methods ... 104
Selection of data subsets and computation of descriptors ... 104
vii
Evaluation of descriptors ... 110
Species Separation ... 112
Discussion ... 116
References ... 121
Chapter V Day-night differences in Cunene horse mackerel (Trachurus trecae) acoustic relative densities off Angola ... 124
Introduction ... 126
Material and methods ... 127
Results ... 132
Discussion ... 134
References ... 137
Chapter VI Feeding habits of Cunene horse mackerel (Trachurus Trecae) off Angola ... 141
Introduction ... 143
Material and Methods ... 144
Biological sampling ... 144
Data analysis ... 146
Results ... 147
Feeding periodicity ... 150
Gut evacuation and daily ration ... 151
Discussion ... 152
References ... 155
Chapter VII Vessel avoidance in small pelagic fish off Angola ... 160
Introduction ... 162
Materials and methods ... 163
Results ... 166
Discussion ... 169
References ... 172
GENERAL DISCUSSION ... 176
Fishery and resource Fluctuation ... 176
Estimating the abundance of small pelagic fish from acoustic surveys ... 177
Target identification ... 177
viii
Final considerations and future research ... 183 REFERENCES ... 186
1
Chapter I General Introduction
Hydrographic regime off Angola
Angola has a coastline of 1650 km, and a continental shelf of 51000 km2 with a width varying from about 10 to 100 km, average width of about 30 km. The hydrographic regime off Angola is characterized by the cold northward-flowing Benguela current and the warm south-propagating waters of the Angola current (Figure 1).
Figure 1: The hydrographic regime off Angola .
The Angola Current forms the eastern section of a large, cyclonic gyre in the Gulf of Guinea. In the upper layer (0-100 m), it seems to be formed mainly by the southeast branch of the South Equatorial Countercurrent and the southward-turning waters from the north branch of
2 the Benguela Current. The influx of waters originating north of the equator is only moderate. However, in layers deeper than 100 m, northern waters become more important in feeding the Angola Current (Moroshkin et al. 1970).The Angola Current is fast, narrow, and stable flow that reaches 250-300 m depths and covers both the shelf regions and the continental slope. The water velocity at the surface from 9°S-16°S along the coast was found to be 50 cm s-1. At 25 m, it was greater than 70 cm s-1. Dias (1983a, 1983b). In March, at the surface, the velocity was on the order of 50 cm s-1. At 100 m, it was 70 cm s-1. These results suggest that there is temporal variability in the velocity of the current. According to Lass et al. (2000), Angola Current water usually has a temperature greater than 24°C and a salinity of more than 36.4 psu in the upper mixed layer. This water mass gradually becomes colder and less saline as it travels south (Lass et al. 2000).
The Benguela Current is the eastern boundary current of the South Atlantic subtropical gyre (Peterson and Stramma 1991, Wedepohl et al. 2000). It is one of four major eastern boundary current upwelling systems of world and although has some similar characteristics to the other eastern boundary upwelling areas, a unique feature is that it is bounded on both the equatorial and poleward extremities by warm Angola Current system in the north, and the Agulha Current in the south (Shannon and Nelson, 1996). The prevailing winds are responsible for strong Ekman transport and the resulting coastal upwelling of cool, nutrient-rich water that stimulates primary productivity (Boyer et al. 2000, Skogen 1999).
The northern boundary of Benguela ecosystem is the Angola-Benguela frontal zone. This series of fronts is a permanent feature at the surface, identifiable to a depth at least 200m and is maintained throughout the year within a relatively narrow band of latitudes, characteristically between 14°S and 17°S ( i,e close to Cape Frio an the Angola- Namibia border). The frontal zone generally west-to-east orientation and appears to be maintained by a
3 combination of factors, bathymetry, coastal orientation, stratification, windstress and opposing flows and Benguela Currents.
During the cold season (usually from May to October), the warm Angola Current water, with temperatures between 27 and 30°C, retreats to the northwest and is replaced by slightly cooler waters with temperatures between 20 and 26°C. This periodic southeast advance and northwest retreat of the Angola Current seems to be linked to the intensity of upwelling that occurs later off the Namibian coast (Meeuwis and Lutjeharms 1990, O'Toole 1980). These fluctuations in the Angola current are reflected in the movement of the position of the Angola-Benguela front, that can be displaced by more than 150 nm southwards during the warm season, relatively to its position during the cold period.
The area experiences episodic warming events similar to the seasonal El Niño cycle in the pacific off Peru (Shannon et al. 1996). These occur when extreme warming takes place in the tropical eastern Atlantic and warm water advected southwards along the Namibian coast. Benguela Niños occur on average every ten years. The last one was recorded in 1995 (Gammelsrøld et al. 1998). , and there are indications that another one is coming into being also in 2011.
Another feature that can be found near the Angola Current is the Angola Dome, a cyclonic eddy doming of the thermocline centred near 10°S and 9°E (Lass et al. 2000).. It is a cold water dome that is generated by a local maximum of Ekman suction (McClain and Firestone, 1993). The Angola Dome does not exist during the winter (Mazeika 1967), and its width and extension depend on the intensity and horizontal shear of the southeasterly trade winds (Signorini et al. 1999). The salinity of the water within the Angola dome (35.5 psu) is lower than that of the surrounding water (35.8-36 psu). According to Mazeika (1967), this may be due to vertical mixing of low-salinity Congo River water from the surface layer.
4 The hydrographical condition is believed to be important in determining the distribution and even the abundance of living marine resources off Angola. Small pelagic species exhibits seasonal, interannual and decadal- scale variability in their abundance, distribution and certain biological characteristics (Anon, 2010a). Much of this variability has been attributed to anthropogenic forcing, however, some of this variability can be also attributed to the high dynamic nature of the oceanographic condition off Angola. This affects the productivity of the region and the abundance and availability of most resources, but particularly of small pelagic fish.
Exploration of the sea in Angola
The Exclusive Economic Zone (EEZ) of Angola covers an area 330 000 km 2 accessible to marine fishing activities In the recent years Angola has become a major producer and exporter of oil in Africa, reducing considerably the fishing area in particularly in the northern area (Figure 3).
5
Figure 2: Angola cost line with main areas where the oil activity take place. 1: main fishing areas
At present the fisheries sector is the third main economic sector in Angola, following the oil and mining industries (diamonds), being the relative contribution of fishing to the GDP between 3 and 5%. The estimated rate of fish consumption in coastal areas is between 14 and 17 kg/ per habitant/year (Anon, 2003).
The small pelagic industry is the largest with respect to volumes, landing 80% of the total fish
catches and the main source of animal protein (Anon,2003), and is consumed fresh and dry.
The species are caught by the artisanal, semi-industrial and industrial fleets. The main commercial species commercial are the round sardinella (Sardinella aurita), the flat sardinella
6 (Sardinella maderensis), Cunene horse mackerel (Trachurus trecae), Cape horse mackerel (Trachurus capensis) and the South African sardine (Sardinops sagax).
Small pelagic species are distributed throughout the Angolan coast, with strong seasonal migrations associated with the seasonal relative movements of the Angola and Benguela currents. Cunene horse mackerel dominates the warmer Angola current, while Cape horse mackerel is associated with the cold Benguela current. The two species are mixed on fishing grounds in the Cunene – Benguela area and are shared with Namibia. The occurrence and abundance of the Cape horse mackerel in Angola waters follow the seasonal displacement of the Angola- Benguela front. There is also depth segregation between the two species off southern Angola, where they occur simultaneously. The Cunene horse mackerel dominates in the inner part of the shelf, while most of the Cape horse mackerel is found more offshore (Duarte, 2001). The two species of sardinela are distributed along the coast and probably
constitute a resource which is shared with Congo and Gabon (Luyeye, 2002) and are usually
found in the upper water layers and near the surface from shallow (10 m) inshore bays to the 200 m depth line. The flat sardinela is a more sedentary species inhabiting coastal, warm and often brackish waters while round sardinela is known to prefer upwelling areas and to migrate to avoid unfavorable environmental conditions. South African sardine and the round herring live in temperate waters from southern Angola to KwaZulu- Natal in South Africa
Small pelagic fish stocks in the Benguela ecosystem are characterized by high biomasses and productivity, but also by a very high variability in productivity and abundance, linked to the environmental instability typical of the region (Boyer and Hampton, 2001). In order to extract the most economic and social benefits from these fisheries, while safeguarding the sustainability of the fishery, a relatively close monitoring of the fishery and of the stock dynamics is necessary. This often requires a reliance on acoustic scientific surveys, as the best way to obtain short-term assessments of stock abundance and structure.
7
The scientific advisory process
In Angola it is national policy to utilize living marine resources on the sustainable basis for benefit of the nation, (Anon, 2004) aiming to optimise the economic and social benefits from the resource and to maintain the long-term biological sustainability of the stock(s) exploited. Scientific recommendations for harvesting of all major resources are presented to the Fishery Technical Advisory Council where the scientists present to the Fisheries decision-makers and senior managers their assessment of the biological status of the resources and management recommendations for each resource. After this meeting takes place the Integrated Management Council where socio-economic factors and the industry‟s perception of the state of the resources are discussed and considered in the management recommendation. The Minister of Agriculture and Fisheries and Rural Development, after consultation of senior managers within the Ministry submits the management measures to the Minister´s Council for final endorsement for publication on Presidential decree.
All catches of the major fisheries are limited by Total Allowable Catch (TAC) in conjunction with limited vessel rights.
Sound management of strongly fluctuating resources like the Angolan small pelagic fish stocks requires reliable information on population size, which for pelagic resources off Angola is estimated on hydroacoustic surveys that has been conducted annually since 1985 using the Norwegian research vessel „Dr Fridtjof Nansen‟. Because the system for collecting detailed information from landings and catches is still not functioning adequately, especially in what concerns biological information, results from most catch-based stock assessment models are considered unreliable. Besides, the short life-span of small pelagic fish and the strong inter-annual variations in oceanographic conditions mean that productivity and abundance of these stocks can fluctuate strongly from one year to the next, depending not
8 only on catch, but also on the hydrographic conditions and the strength of the incoming year-classes. Therefore, advice on the annual Total allowable Catch (TAC) depends strongly on the survey‟s results.
History of acoustic abundance estimation surveys in Angola
The early history of acoustic research in Angola can be viewed within the context of political status of the country. Assessment of the abundance of small pelagic fish stocks began in 1972, four years before the end of Portuguese colonial rule. A group from Missão de Estudos Bioceanlógicos e de Pescas de Angola conducted the first pelagic survey using Research Vessel (R/V) “GOA”, equipped with SR3 and EH2E echo sounders (Campos Rosado, 1974). The surveys covered only the area around Lobito, 12°S and the biomass was estimated at about 320 000 tones.
After independence in 1975, the first series of pelagic acoustic surveys was conducted in 1978 by a group of Soviet biologists from the former URSS research institute “Atlant-Niro” in the framework of a bilateral agreement that existed between Angola and Soviet Union. R/V “ARGUS” carried out three surveys and was equipped with an echo sounder “Paltus- M” with an IC-I integrator. R/V “EVRICA” conducted two surveys and was equipped with an “FWGT-23” echo sounder. The biomass of pelagic species were estimated at around 700 000 tones.
In 1978, a bilateral agreement between Sweden and the Angolan Government was developed (Jardim, 2008). The bilateral agreement encouraged collaboration in research and the training of Angolan specialists. The Swedish support for research began with refurbishment of R/V GOA that provided to be very important for training of Angolan scientists and as a platform for collecting data. The R/V GOA was equipped with a Simrad EK 400 echo sounder, with monochrome screen. A series of acoustic surveys were conducted, but the surveys failed to
9 estimate the biomass of the main pelagic species because the noise from the vessel increased the avoidance of the fish to fishing gear, making it almost impossible to get adequate length sample of the target species.
In 1985, the Nansen programme started in Angola and a series of surveys with R/V “Dr Fridtjof Nansen” were conducted. Up to 1991, surveys were conducted using a 38 kHz Simrad EK 400 echosounder combined with QD integrators (Sætersdal, 1993). In 1994, the new “Dr Fridtjof Nansen” research vessel was built, equipped with echo-sounder EK 500, and Bergen Echo Integration Unit for analysis and processing the acoustic data (Axelsen et al. 2007). Further details on the equipment are given in the next chapters. From 2007 the R/V “Dr Fridtjof Nansen” used a Simrad ER 60 Echo-sounder and echo post processing Large Scale Survey System (LSSS) software (Axelsen, 2007), that is able to handle the full resolution of raw acoustic data and to handle data in different files (Korneliussen, et al. 2006).
Estimation of abundance of small pelagic fish using the acoustic method (principles and basic equations)
Hydroacoustic is the principal methods for fisheries-independent estimation of abundance of schooling pelagic fish and is based on the principle that an echo sounder transmits short sound pulses in a concentrated vertical beam and receives echoes from targets in the sea (eg. MacLennan and Simmonds, 1992).
Echo integration based on a single frequency is commonly used to estimate fish stock abundance (eg. MacLennan and Simmonds, 1992). The frequency of 38 KHz often adopted is a compromise between the need for detection ranges of the order of hundreds of meters and the capacity to detect single fish and small animals (Korneliussen, 2003).The main advantage of the acoustic method is the ability to cover large sampling volume with relatively modest effort, providing high sample resolutions in the both horizontal and vertical planes (Axelsen et al. 2003). The method of fish stock abundance estimation from acoustic data combined with
10 biological sample contains a series of assumptions (eg. MacLennan and Simmonds, 1992) Figure 3 illustrate estimation of the stock and how the results are used for management of the main pelagic species.
Echo sounder
Other datasource
Echo integrator system
Database
Echogram Interpretation final decision
Stock assessment model
TAC Recomendation Trawl
Figure 3: Schematic of model to integrate acoustic and trawl data for estimation of abundance of the stock (Kornelliussen,2003)
The reliability of acoustic abundance estimates is dependent on proper survey design and statistics for estimating fish abundance (Aglen, 1989).
The number of fish in each length class is estimated from:
N t = A * S A *
P i
∑
i= 0 nσ j ρ i
(1)Where Nt is the number of fish in length group i, A the area covered by the target population (square nautical miles), SA the average area backscattering (m2 /nautical mile-2, ) ,pi the proportion of fish in length group I and σ the acoustic backscattering cross section (m2) of fish with length i.
11 Conversion from acoustic densities to absolute abundance requires knowledge of the acoustic acoustic backscattering cross section parameter. This parameter, equivalent of the target strength (TS), depends mainly on the acoustical backscattering area of swimblader, that is responsible for 90- 95%) of the acoustic of acoustic backscatter at 38 kHz due to high sound speed contrast between the seawater and the swimbladder (Foote, 1980a)
The linear domain of TS can be determined from the relationship acoustic backscattering properties (σ) of the target strength (TS e.g. MacLennan and Simmonds, 1992), that in linear domain can be determined from the relationship (Foote, 1980a, Love,1971):
dB TS 4 log 10 (2)The TS is usually species specific (MacLennan and Simmonds, 1992), proportional to the length and it is defined as
TS=20LogL+b20 (dB) (3)
The equation currently applied for pelagic species off Angola was originally derived for clupeoids (Foote et al. 1986; Foote 1987):
TS=20 LogL-72 (dB) (4)
Errors and uncertainty in acoustic abundance estimation
An important question in all the surveys is the accuracy, both as absolute measure of abundance and as relative indices of changes in the abundance. The results of all surveys are subject to random and systematic errors (MacLennan and Simmonds, 1992). Measurement errors are those that relate to the actual measurement of the fish density along the vessel path, i.e. on the areas actually observed by the vessel. Estimation errors are those associated with the process of estimating total stock abundance from the observations made along the vessel track, and are usually within the realm of statistical errors. Both errors give an overoptimistic
12 impression of survey accuracy with potentially serious consequences for management decision.
Different distribution pattern from one year to next may be associated with variation in behaviour which leads differences in the acoustic densities (Vabø, 1999). Understanding behavioural characteristics in relation to the specific ecosystem it is essential for deciding sampling strategy and/or for studying the reliability of weighting factors for global biomass estimation.
Attempts to quantify survey error for the date in the BCLME region have been conducted on the BENEFIT survey error workshop (Anon, 2000).For the pelagic surveys off Angola Target strength and target identification was identify as the major source of uncertainty in absolute estimates of the two main pelagic species.
In the Benguela Current system, In Situ measurements of Cape horse mackerel by visual scrutiny of target strength distribution were made off Namibia (Svellingen and Ona, 1999) and off South Africa (Barange and Hampton, 1994; Barange et al. 1996). All measurements were made at night, when the fish tend to disperse sufficiently for echoes from single targets to be isolated from multiple echoes. More recent (Axelsen, 2003) investigated also Cape horse mackerel target strength using a second EK 500 unit running an ES 38D ES 38 D submersible 38 kHz split-beam transducer.
The target strength/length relationship obtained from the different experiments varies considerably as can be seen from the B20 constant. The minimum and the maximum were set vary wide at -78 and -65 dB (Anon, 2000 ; Axelsen, 2003). The results leads that there is not evidences to reject the B20 (-72 dB) currently applied for pelagic species off Angola in favour of any others measured in the Benguela Current system.
13
Target Identification
In turn, acoustic techniques are generally limited by the incorrect partitioning of backscattered energy between species, particularly in multispecies environments (Misund, 1997) where schools are small, interspersed and have a low or varying catchability. Traditionally, direct net sampling near the acoustic transect has been conducted and on visual interpretation of echograms have used as identification methods for partitioning of backscattered energy between species (Rose and Legget, 1988). There are two central problems with this approach. First, net sample seldom reflect actual species or size composition due to the avoidance of the target and trawl selection (Gødo, 1994). This approach is also biased, by the differences in catachability between species (Lawson et al. 2001) and by the lower spatial or temporal resolution afford by trawl comparable in comparison to acoustic sampling (Massé and Retiére, 1995),
The visual inspection of simple-frequency echograms (typically 38 kHz) displayed with colour and code and intensity corresponding to acoustic densities, requires knowledge of the scatterings properties (Axelsen, 2007), behaviour of the target species (Olsen,1990; MacLeman and Simmonds,1992 ;Misund, 1999). The scrutiny of acoustic data is based on long- term experience (Korsbrekke and Misund, 1993) because the method is particularly sensitive to changes of personnel and thereby differences in interpretation that could lead to inconsistencies over time, representing a variable source of error that may be difficult to take fully in to account.
Numerous acoustic approaches have been taken in addressing the problem of acoustic target identification. In cases where single targets can be detected and length frequency distribution differ between species, in situ measurements of target strength distributions can often be used to identify species (Barange, et al. 1996) by analysing the shape of the frequency response of each species. In the situation, when the length frequency overlaps a common approach has
14 sought to identify species via acoustically quantifiable differences in shoal features (Lawson et al, 2001). Other recent approaches include broadband (Rose and Legett, 1988) and multiple frequency techniques (Kornuliussen and Ona, 2002). These techniques are based on using different frequencies in target strength of scatterers .Although, the multifrequency approaches facilitates the classification echo-traces according to the frequency response or the difference in volume backscattering (MacLennan et al. 2002) across a frequency range, using a model predictions (Korneliussen, 2003) application this approaches requires a technique acoustic system on the survey vessels, and in BCLME region only the Norwegian research vessel Dr Fridjof Nansen has technology available. To address this fact, Reid et al.2000 suggest that the use of ancillary school information have shown a potential tool to improve the target identification. The features of shoals extracted from acoustic data and used for identification of species have generally fallen into four categories: positional (distance to nearest neighboring shoal), morphometric (e.g. shoal height, area), energetic (e.g. mean or variance of backscattered energy), and bathymetric (e.g shoal depth) may contribute additional ability for species target identification (MacLennan and Holliday, 1996 ; Scalabrin et al. 1996).
Behaviour
Pelagic fish behaviour plays a major part in acoustic fish stock assessment surveys (e.g. Fernö and Olsen, 1994), since it conditions the availability of the fish to the echo-sounder, and also the relation between fish abundance and echo intensity, Schooling fish behaviour has been studied since the beginning of century, but most of work was related with description of fish schools in tanks or aquaria (Pitcher, 1993). Even though the study of pelagic fish behaviour in the natural environment presents many complications, field studies began in the 1970s with development of acoustic methods (MacLennan and Simmonds, 1992). The studies of behaviour are relevant to acoustic estimation (Røttingen et al. 1994) as consequence of this
15 upward/downward sink/ glide energy conservation energy strategy the fish exhibits a variety of body tilt angles which varies with depth and time of the day (Huse and Ona, 1996) who influences the acoustic target strength (TS) who is known to be a highly variable and sensitive parameter (Nakken and Olsen, 1977; Ona, 1990).
Vertical position and Vertical Migration
Vertical migrations affect the target strengths of fish (Foote, 1990; MacLennan and Simmonds, 1992) through the compression/decompression of the swimbladder (Foote, 1980a; Vabø, 1999) and changes in body posture (tilt angle) of the fish relative to the transducer (Nakken and Olsen, 1977; Foote 1987; Ona, 2001). Vertical migrations may also affect estimates indirectly through the increase of the effect of the so-called blind and dead zones (Fréon and Misund, 1999; Olsen et al. 1983a; Vabø, 1999). The hull mounted transducer operates at distance from the surface of about 5m and volume above this depth is not acoustically sample and therefore the surface blind zone is typically about 10-12m from the surface. Similarly, only part of the fish echo can be separated from the bottom echo. The separable part depends on the pulse length and the distance of the fish from the bottom (Aglen, 1994).
The interpretation of acoustic data can be further complicated by diel variation in the behaviour of fish. In daytime, pelagic fish are often found close to the bottom, thus potentially in the dead zone, or congregated in schools that have a patchy distribution, which leads to variability in the results. At night, pelagic fish usually leave the bottom and schools disaggregate (Fréon et al. 1996; Fréon and Misund, 1999). The aspect angle of individual fish day and night may be variable (e.g. Huse and Ona, 1996), and the fish assemblage in a discrete area, species, and size distributions, can change over the diel cycle (e.g. Neilson and Perry, 1990; Helfman, 1993).
16 Vertical migration appears to be a means by which pelagic organisms balance the competing objectives of growing quickly and minimizing predation risk (Michelson, et al. 1996). For many visual foragers, feeding efficiency is greatest at the higher light levels near the surface during the day (Pearre, 2003). Other visual predators, however, can also forage efficiently under such conditions the fish exhibit strong avoidance reaction affecting the shape, size and density of fish (Pitcher and Wyche, 1983).
Avoidance
Avoidance reactions are elicited by an instantaneous increase in the pressure gradients of low frequency from an approaching vessel (Olsen et al. 1983a; Fréon and Misund, 1999; Fernandes et al. 2000; Vabø et al. 2002 ). In the case of swimming bladder fish this organ transforms scalar pressure to particle motions that can be sensed by the otolith organ (Hawkins, 1986 ; Blaxter et al. 1981). This effect is more pronounced in the upper layer where the beam is most narrow and the stimuli from the vessel strongest (Aglen, 1994). There are two effects to be considered, fish moving out of path of the vessel and fish swimming downwards, but remaining in the path of the acoustic beam. Recording have been shown that not only fish concentrated layer are affected by the noise vessel, concentration of adult herring, under path of the vessel, extending from about 10m below the surface down 40m, have completely disappeared, but rapidly returned again after its passage.
Combined techniques, using both echo sounder and sonar have already been suggested for study the vessel avoidance (Misund 1993).The sonar was mainly used for school counting, being directed horizontally at 90° from the vessel route (Soria et al. 1996) Although, this method is considered an important tool for counting the school on surface, this method is not a real success for using the estimation of biomass, because the actual volume sampled was is easy to evaluate .Close to the vessel at depth less than 100 m the beam is too narrow to be give an exhaustive view of the water volume.
17 Recently the availability of multi-beam sonars has allowed scientists to study the reaction of the schools to the vessel obtaining some contradictory results. While vessel avoidance in some situations does not represent any source of error at all (Fernandes et al. 2000) attributed to the noise-reduced vessel design, significant negative bias has been broadly documented (Olsen, et al 1993 Gerlotto and Fréon, 1992; Soria et al. 1996; Vabø et al. 2002). However, Røstad et al. (2006) reported also that the approaching vessel itself could attract fish and hence cause the echo abundance to be overestimated.
Rationale and structure of the thesis
It is thus difficult to exaggerate the social importance of a good management of the small pelagic fishery for Angola, especially given the importance of small pelagic fish (sardine and horse mackerel) in the diet of the poorer segments of the Angolan population. Extracting the maximum benefits from these fisheries requires taking into account the natural fluctuations in productivity and abundance of these stocks, but also the availability of a method to estimate this abundance and productivity with a relatively short time-lag.
Acoustic surveys in Angola were designed based only on the knowledge of distribution, abundance of fish and to the topology of the shelf without considering the natural variety of behaviour pattern that are adaptations to biological and environmental conditions. It is however recognized that acoustic surveys are highly sensitive to errors caused by effects of fish behaviour, particularly those that may reduce the acoustic detectability of fish.
In the Benguela Current System, a good number of studies has been carried out for species occupying the southern part of the Benguela ecosystem (e.g. Alexen,;Barange et al. 1996 and 2005; Coetzee et al. 2001). However, to date very little information is published about the dynamics of the fisheries for small pelagic fish, and likewise, very little is known about the estimation properties of the hydroacoustic method applied to small pelagic fish species off Angola.
18 The insertion of Angola on regional programme BENEFIT and BCLME provided a new vision for marine science, particularly on methodological and technical problems related to biomass estimation. In 2000 was conduct the first survey errors workshop where for each country was identified several aspects than can bias the survey estimates (Anon, 2000) and scientists were encouraged to understand how these bias affects the biomass.
This thesis intends to contribute to bridge these gaps through an analysis of existing data will addresses the complementary aspects of the dynamics of living marine resources in the Benguela current system, which contributes to understand interannual variability of the main stocks pelagic off Angola. The best methods for estimation the abundance of these stocks are those based on hydroacoustic abundance estimation methods. However, these methods are based on assumptions that time of the survey all the stock are available to be assessed. This assumption is never completely fulfilled due to limitation on of methods and natural behaviour of the fish stocks.
This thesis will also examine the behaviour aspects in relation to the abundance estimation of pelagic species off Angola. Main distinguishing features of the echograms assigned to the main species group, and establishment of an objective algorithm to assist in the classification of the echograms obtained in Angola; Quantification of differences in acoustic density generated by the change of behaviour and vertical distribution throughout the circadian cycle and the vessel avoidance off pelagic species off Angola.
19
Chapter II Resource and Ecosystem Variability, including regime shifts, in the Benguela current system
van der Lingen. C.D. Shannon, L. J. P. Cury. A. Kreiner. Moloney. C.L Roux. J-P and Vaz-Velho. F. submitted to Benguela: Predicting a large Marine Ecosystem
20
A
BSTRACTInterannual and decadal-scale variability in abundance, distribution and biological characteristics are described for important living marine resources of the Benguela Current system including small pelagic fish, horse mackerel, hakes, snoek, rock lobster, Cape fur seals, Cape gannets and African penguins. Variability at the ecosystem level for the northern and southern subsystems is also described using trophodynamic indices that track structural changes in the ecosystem. Current understanding and analysis of observed variability in both resources and ecosystem is reviewed and the knowledge required for predicting resource and ecosystem variability and the causal factors that need to be considered are discussed. We highlight the need to improve understanding of the processes that are important in the Benguela Current ecosystem, to identify what controls those processes, and to quantify such controls (particularly those acting on lower trophic levels) and the roles of important species in the ecosystem. The kinds of predictions considered possible in the Benguela Current system are examined and the use of indicators to track ecosystem changes is assessed. A series of steps is suggested to improve understanding of ecosystem and fisheries dynamics and to monitor key aspects of the ecosystem.
21
INTRODUCTION
The Benguela Current ecosystem is one of the world‟s major upwelling systems, and, as is typical of eastern-boundary upwelling systems, is characterized by high productivity. Located off the southwest coast of Africa, the Benguela is divided into northern and southern sub-systems that are separated by the permanent upwelling cell at Lüderitz (26°S). The northern Benguela extends from the Angola-Benguela front (usually located between 14°S and 16°S; Shannon et al,1987) to the Lüderitz upwelling cell, whereas the southern Benguela extends from Lüderitz to the Agulhas Bank off South Africa‟s south coast (Fig. 1). Conventionally, the geographic border between Namibia and South Africa at the Orange River mouth in the vicinity of 29°S is adopted as the division between the northern and southern Benguela ecosystems. Detailed reviews of various aspects of the Benguela upwelling system may be found in Shannon (1985), Chapman and Shannon (1985), Shannon and Pillar (1986), and Crawford et al. (1987). More recent studies for the southern Benguela are reported in Payne and Lutjeharms (1997), and for the northern Benguela in Payne et al. (2001), and a historical overview of human activities and their impacts on marine life in the Benguela is provided by Griffiths et al. (2004). Aspects of physical and biological variability exhibited by the Benguela Current system across a wide variety of temporal scales are described by Field and Shillington (2006).
The Benguela ecosystem supports large populations of living marine resources that are of substantial economic importance to the region. Fisheries for small pelagic fish species (including anchovy Engraulis encrasicolus, redeye round herring Etrumeus whiteheadi, sardine Sardinops sagax, and the sardinellas Sardinella aurita and S. maderensis), midwater fish species (Cape horse mackerel Trachurus trachurus capensis and Cunene horse mackerel
22
paradoxus), west coast rock lobster (Jasus lalandii), and fisheries targeting other species,
have been well established in the both the northern and southern Benguela for the past 50-100 years. Bottom trawling off South Africa was initiated in early 1900s, and the demand for canned and triggered by World War II provided the impetus for purse-seine fishing. Most of the catch was taken by local vessels before 1960, but distance- water fleets (eg. From the URSS, Japan ans Spain) but targeted hake and other demersal species fish began fishing in the Benguela ecosystem thereafter. Whereas South Africa declared 200-miles exclusive fishing zone 1977, distance- water fleets continued to harvest large quantities of living marine resources from Angolan and Namibian waters until the 1980s ( Payne and Crawford 1989). Foreign fishing off Namibia for hakes and horse mackerel ceased after Namibia independence in 1990 ( Boyer and Hampton, 1991), but substantial fishing by foreign vessels still occurs off Angola. Currently, the fishing sector is important to the economies of all three countries bordering the Benguela, particularly so for Namibia where this sector contributed 6.4% to that country‟s GDP in 2001 (Molloy and Reinikainen, 2003). In Angola, the fisheries sector is the third most important economic sector, contributing between 3% and 5% to GDP and providing products for both local and export consumption. Fishing contributed 0.4% to South Africa‟s GDP in 1998. In addition to the species listed above, many other fish, bird and marine mammal species together comprise the abundant fauna of the Benguela Current ecosystem.
The aim of this paper is to provide an overview of resource and ecosystem variability in the Benguela ecosystem. For the purposes of this review we have extended the definition of the Benguela ecosystem in order to include important resources that occur or may be harvested outside the boundaries indicated above. For example, whereas only the southernmost part of Angola falls within the Benguela ecosystem, most Sardinella spp. occurs and is caught to the north of the Angola-Benguela front but catch data for this resource is not spatially explicit.
23 Similarly, the bulk of shallow water hake M. capensis occurs and is caught off South Africa‟s south coast. Descriptions are provided of interannual and decadal scale variability exhibited by the economically-valuable marine resources listed above from 1950 to 2003, a period for which a fairly substantial dataset exists. Additionally, variability exhibited by a few of the top predator species in the system is described, including Cape gannet (Morus capensis), African penguin (Spheniscus demersus), Cape fur seal (Arctocephalus pusillus pusillus), and snoek (Thyrsites atun). Descriptions of resource variability are grouped into three themes, namely variability in abundance, variability in distribution, and variability in biological characteristics, and examples are given where available. Variability exhibited at the ecosystem level by the northern and southern Benguela is described through indices that proxy ecosystem trophic structure, such as the ratio of demersal to pelagic catches and biomass, plots of catch versus trophic level of the catch, and the Fishing in Balance (FiB) index (see below). Current understanding and analysis of observed variability of resources in both the northern and southern Benguela ecosystems is reviewed, and the knowledge required for predicting resource and ecosystem variability and the causal factors that need to be considered discussed. The need to improve understanding of the processes that are important in the Benguela Current system, to identify what controls those processes, and to quantify such controls (particularly those acting on lower trophic levels) and the roles of important species in the ecosystem is highlighted. The kinds of predictions that are possible in the Benguela are examined, and examples of approaches to predict interannual variability in anchovy recruitment are briefly described. Finally, a series of steps is suggested to improve understanding of ecosystem and fisheries dynamics and to monitor key aspects of the Benguela Current system.
24
RESOURCE VARIABILITY
Variability in abundance
Catches of most of the important resources of the northern Benguela have shown substantial reductions over the past 50 years. After peaking at over 1.5 million tons in the late-1960s and sustaining levels of around 0.5 million tons between 1960 and 1980, catches of small pelagic fish species in the northern Benguela have dwindled to current levels of less than 100 000 tons (Fig. 2), most of this being Sardinella spp. Rock lobster catches in the northern Benguela have also decreased, from over 5 000 tons annually before 1970, around 2 000t annually until 1990, and to a few hundred tons since then. Catches of hake in the northern Benguela peaked in the early 1970s (Figure 1) but decreased thereafter, and whilst not as severe a decline as those for small pelagics and rock lobster, annual hake catches made during the past decade have been less than a third of peak catches made in the early-1970s. However, hake catches have shown a slight increasing trend over the past decade. The large decreased for all these species are in contrast to catches of horse mackerel, which increased during the 1970s, peaked in the 1980s and after declining again have remained relatively stable since the 1990s at around 250-300 000 tons (Figigure 1). Catches of Cunene horse mackerel are much reduced compared to the 1950s and 1960s (Figure 1).
In the southern Benguela, rock lobster catches have shown a marked decline whereas catches of the other major resources have remained relatively stable (Figure 1). A replacement of sardine by anchovy in catches of small pelagics after the mid-1960s is evident, as is a reduction in the relative contribution to horse mackerel catches by the pelagic fleet after 1970, and an increase in snoek catches in the trawl (demersal and midwater) fishery after 1975. Snoek catches are significantly higher in the southern than in the northern Benguela whereas the reverse is true for horse mackerel catches, and catches of hakes were substantially lower
25 in the southern compared to the northern Benguela but have been at similar levels for the past 15 years (Figure 1).
Catches of small pelagics, horse mackerel and hakes landed in the southern Benguela were substantially lower than peak catches of those resources landed in the northern Benguela. Currently, however, only landings of horse mackerel are higher in the northern than in the southern Benguela, and whereas catches of small pelagics are currently minimal in the northern Benguela they are at close-to-record highs in the southern Benguela.
26 Figure1: Variability in annual catch of important living marine resources in the northern (left panels) an southern (right panel) Benguela for small pelagic species (anchovy, sardine and
Sardinella spp in the northern, and anchovy, redeye, round herring, and sardine in the
southern); horse mackerel (Cunene horse mackerel and Cape horse mackerel catches are shown for the northern Benguela and catches for Cape horse mackerel in the northern and southern are further divided in those taken by pelagic (or purse-seine) and mid water trawl or demersal fleet); snoek(hand-line and trawl are shown sperately, except for northern Benguela during 2000-2003 where catches are combined); and rock lobster. Plots are updates to those presented in Griffiths et al.(2004) using data supplied by Natmirc, MCM and IIM
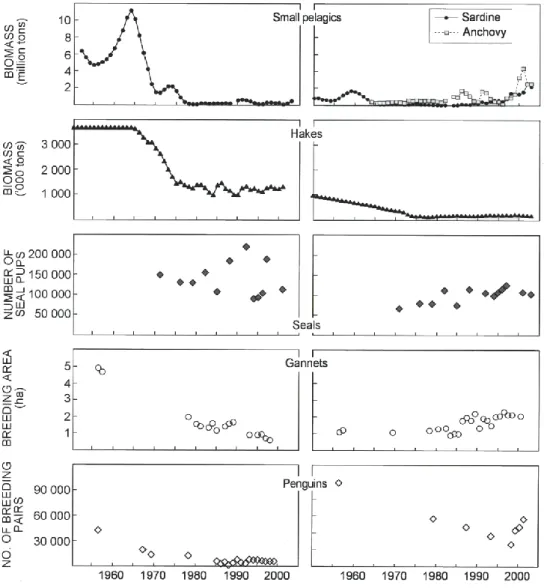
Reliable and consistent biomass time-series estimated from surveys and/or population assessment models in both systems are available for sardine, hake, seals, and birds (gannets and African penguins; Figure. 2). Long-term trends in biomass have been consistent with fluctuations in catch for sardine and hake in both the northern and southern Benguela. A
27 substantial decline in the biomass of northern Benguela sardine that occurred during the late-1960s and from which the population has not since recovered is apparent, although there were some signs of a recovery in the early 1990s (Figure 2). A decline in the 1960s of the southern Benguela sardine population, and a recovery in the late-1980s and 1990s, is also apparent, with this population currently at a size similar to that estimated before its collapse. Southern Benguela anchovy have shown moderate interannual variability in recruitment over most of the time series, with consequent inter-annual fluctuations in stock size, but strong recruitment that has lead to large population sizes has been observed since 2000 (Figure 2).
Considerable reductions in the estimated biomass of hakes in both the northern and southern Benguela are observed soon development of the industrial trawl fisheries (Figure 2). These were initiated around 1965 in the northern Benguela and had already started in 1950 in the southern Benguela, and have resulted in current population sizes of around one third and one fifth of those estimated in 1950, for the northern and southern Benguela, respectively. Whereas stock assessment models indicate that hake biomasss in the northern Benguela has remained at relatively constant levels around 1 million tons, estimates from swept area surveys (data not shown) show an increasing trend in the early 1990s, but due to adverse environmental conditions between 1993 and 1995 the biomass declined again and reached low levels in 1997 (van der Westhuizen 2001). The biomass of hake in 2003, although slightly improved from 1997, remains at low levels.
Fur seal abundance estimated from aerial census of pups increased in the northern Benguela dramatically between 1970 and 1990s at an annual rate of between 2 and 4 % as continuation of the recovery from historical overexploitation during 18th and 19th centuries.Subsequent to large interannual fluctuations (Figure 2) are linked to variably of food availability and environmental fluctuations (Roux 1998). By comparison, the seal population in the southern
28 Benguela has increased slightly since 1970 and appears to have reached relatively stable levels since 1985.
Figure 2.Variability in the abundance of important living marine resources in the northern
(left panels) and southern (right panels) Benguela, derived from direct observations and/or model estimates. For small pelagic fish (sardine in the northern Benguela) biomass estimates before the break are from virtual population analysis [Thomas, 1986] and those after the break are from estimates made using acoustic survey data (updated from Boyer et al., 2001]).For sardine and anchovy in the southern Benguela, biomass estimates before the break are from virtual population analysis (Armstrong et al., 1983) and those after the break from estimates made using acoustic survey data (updated from Barange et al., 1999). Hakes (both species combined, and both time series are from population assessment models--Geromont et al. (2000)for the northern and Rademeyer and Butterworth (2003) for the southern Benguela). Top predators including Cape fur seals are estimated from the number of seal pups observed from aerial photograph censuses. Estimates of Cape gannets are based on the breeding area occupied by gannets at Ichaboe Island in the northern Benguela, and at Malgas Island and Lamberts Bay in the southern Benguela (Crawford 2005). Estmates of African penguins are based on the number of breeding pairs (Crawford and Whittington 2005).
29 African penguins and Cape gannets are both breeding species endemic to South Africa and Namibia, and both are classified as Vulnerable (IUCN criteria). Between 1956 and 2000, Cape gannets underwent a dramatic decline in the northern Benguela, as indicated by the tenfold contraction in the area they occupied at breeding localities (Figure 2). In the southern Benguela, there has been a steady increase in gannet breeding area since the early 1980s (Figure 2). In the Benguela system overall the penguim population decreased by about 90% between 1910 and the early 1990s (Crawford,et al.2001).The total number of adult birds, estimated to have been 220 000 in 1978, declined to 179 000 in early 1990s and has increased again 201 000 in 2000 ( Crawford and Whittington,2005). In northern Benguela the penguin population declined more than 74% between mid-1950s and the late 1990s (kemper et al. 2001) and has continued to decline at about 1,8% annually since mid-1990s (J. Kemper, Avian Demography Unit, UCT, pers comm.). In the southern Benguela in contrast, the large declined experienced between the 1950s and the early 1980s was followed by a steady increase during the late 1990s.
The substantial historic reduction in catches and biomass observed for important resources in Benguela Current system have been attributed primarily to overfishing, including collapse of sardine and rock lobster populations, and the substantial decline in hake population in both the northern and southern Benguela (Figures 1 and 2 Griffiths et al. 2004). Many resources are currently at population size substantially smaller than observed 50 years ago, although this is not the case for small pelagics in the southern Benguela. Fishing many also shorten the food thereby reducing ecosystem resilience (Hutchings, 2000). And increasing the time required for recovery of the community from perturbation such as fishing (Vasconcellos et al. 1997). Mean throphic path length in the northern Benguela food web (see Heymans et al.2004); Moloney et al. 2005) has decreased by 27% since the early 1980s, suggesting that
30 the ecosystem has a reduced capacity to recover from perturbation in the current state in which it is functioning.
Environmental impacts that contributed to resource collapse, or acted to retard the recovery of a population, have been hypothesized. Boyer et al.(2001) concluded that unfavourable environmental conditions (e.g the Benguela Niño that occurred in 1995; see below) were important factors in the decline of northern Benguela sardine stock observed during the 1990s, although this must have been exacerbated by heavy fishing pressure during 1994 and 1995 (Boyer et al .2001).However, reduced fishing pressure since 2000 ( TACs) varying between 0t and 25 000t between 2000 and 2003) has not resulted in a recovery of the stock (see section below on Ecosystem Variability). Trophic modelling studies have suggested that the observed changes in pelagic fish stocks in the southern Benguela were also environmentally driven, with effects propagated up the foodweb via the availability of mesozooplankton prey to anchovy and sardine (Shannon et al. 2004c). Fitting a dynamic model to available catch and biomass data series for the southern Benguela from 1978-2002,Shannon et al.(2004b) estimated that fishing patterns (a from of top-down control) explained only 2-3% of the variability observed in the time-series examined, whereas an environmental forcing function (bottom-up control) applied to phytoplankton production explained 4-12% of variability. For small pelagic fish in the southern Benguela, fishing mortality has been maintained at relatively low levels; since the mid- 1980s, anchovy and sardine fishing mortality ranged between 0.04 and 0.30 y-¹. (Cunningham and Butterworth 2004a, b), with the small values occurring when biomass was high in the 2000s. In contrast to most ecosystems in the world, the southern Benguela ecosystem has been managed at moderate levels of fishing. Thus it is not surprising that trophic interactions rather than fishing are believed to be responsible for the observed changes in the southern Benguela ecosystem in the 1980s-2000s. In particular the vulnerability of prey to predators could explain about 40%
31 of the observed variability in the time series examined (Shannon et al. 2004b; trophic interactions and the processes controlling trophic flow are discussed in more detail in the section on Predicting variability).Trophic interactions would be expected to be a dominant feature in upwelling ecosystems, because these systems are typically “wasp-waist” controlled (Cury et al.2000).
Some populations have recovered under conservative management strategies. For example the southern Benguela sardine has shown a remarkable recovery following implementation in the mid-1980s of a conservative fishing policy to rebuild the stock (De Oliveira 2002). However, the decadal-scale changes in abundance observed for sardine in the southern Benguela are characteristic of small pelagic species ( Schwartzlose et al. 1999; Lehodey et al; in press),with cycles of alternate dominance of anchovy and sardine. Sardine in the California Current system show a 50-60 year time scale of population expansion and contraction (Baumgartener et al. 1996) a period somewhat longer than that observed for southern Benguela sardine (40 years). Decadal-scale changes in abundance of small pelagic fish and a variety of marine resources from a variety of systems have been linked to long-term changes in environmental forcing, and many studies have demonstrated ”that climate-related variability of fish populations is the rule rather than the exception” (Lehodey et al.in press).The current situation of large population sizes of both anchovy and sardine in the southern Benguela seems contrary to the hypothesis of alternating periods of species dominance (Schwartozlose et al. 1999), since both are currently at record high levels. However, data for anchovy exist only from the mid-1960s and we do not know historical combined stock sizes.
The southern Benguela has been characterised by large interannual variability in small pelagic fish biomass, and exceptionally high anchovy recruitment in 2000 and subsequent years (figure 2). The strong anchovy recruitment in 2000 was linked to within-season variability in local forcing (SE wind), which minimized advective loss during the critical period for
32 successful transport of eggs and larvae from the Agulhas Bank spawning grounds to the west coast nursery grounds, and then maximized their food environment there through sustained upwelling in late summer (Roy et.2001), However, those particular environmental conditions have not since been repeated, yet subsequent anchovy recruitment and hence population size has remained high(figure 2).This suggests that processes other than environmental control egg and larval survival may have become important determinants of recruitment success (Roy et al. 2002), such as the increased egg production arising from a substantially larger spawner stock or changes in spawner distribution. The continued high anchovy recruitment since 2000 is no believed to be sustainable as density-dependent factors are likely to come into play, and evidence of reduced body lipid levels of anchovy recruits from 2000 and 2001 compared to previous years has been documented (van der Lingen and Hutchings 2005).
Adverse environmental events that occur at interanual or shorter times scales also impact on the resource abundance. Benguela Niños which occur about once every ten year are observed as instructions of warm water, saline surface waters onto the northern Benguela shelf, have been associated with widespread mortalities of sardine horse mackerel and Kob (Argyrodomus inordorus) off coasts of Angola and northern Namibia (Gammelsrød et al. 1998). Depletion of oxygen levels in near-shore environment of the southern Benguela have caused rock lobster “walkouts” and have results in significant local mortality (Cockcroft 2001)
Variability in distribution
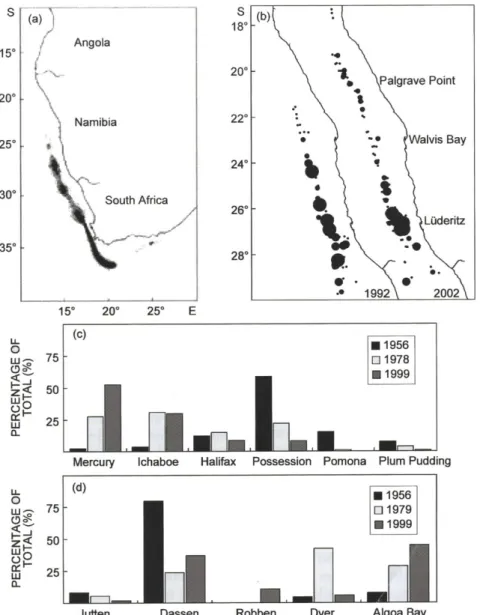
Small pelagic fish in the Benguela ecosystem have shown extensive variability in terms of the spatial extent of their populations, with a positive relationship between biomass and distributional area reported for southern Benguela anchovy, which expands its distribution at large stock sizes (Barange et al.1999). Those authors found no such relationship for sardine, possibly arising from the relatively low sardine biomass levels observed during the period of
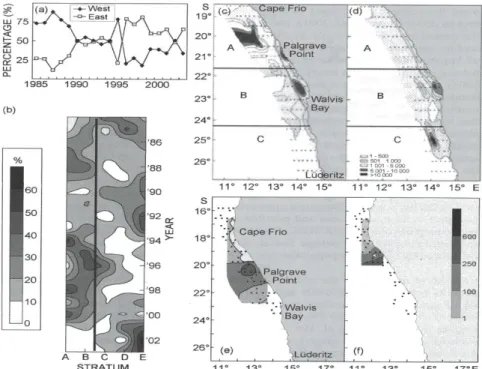
33 their study. Further analysis that includes high sardine biomass levels has indicated that sardine also expand their spatial distribution at large stock size (J.C. Coetzee, MCM, pers. comm.). The distribution of sardine in the northern Benguela, has become very patchy following the decline of the stock (Hampton 2003); historically, the stock was distributed more or less continuously between 25ºS and 16º30‟S, but during the past decade the stock has been distributed in few small patches along the northern part of the Namibian coast.
Both seasonal and decadal-scale variability in the distribution of Sardinella spp. off the Angolan coast have been reported. Seasonally, adult S. maderensis move northwards at the beginning of the cold season (winter; June to October) and southwards at the beginning of the warm season (summer; February to May; FAO 2000). On a longer time-scale, the core of the
S. aurita population was located off Angola and this species dominated landings during the
1970s, whereas from the mid-1980s Angolan landings were dominated by S. maderensis (Binet et al. 2001).
Interannual variability in the distribution of the major spawning areas of Benguela small pelagics is evident. In the southern Benguela the western Agulhas Bank was the major anchovy spawning area between the mid-1980s and 1995, but an eastward shift in the distribution of anchovy spawners over the Agulhas Bank has been observed during annual surveys since 1996 (Figure. 3a), with the bulk of the population observed over the offshore regions of the central and eastern Agulhas Bank (van der Lingen et al., 2002)). The spawning location of southern Benguela sardine has shown even larger-scale variability, with both the South African south and the west coasts comprising the major spawning grounds during different periods. Crawford (1981) noted that in the early 1960s, sardine spawned along the west coast as well as on the south coast of South Africa, whereas sardine spawning was restricted to the south coast in 1965-1967, coinciding with decline in sardine abundance. In 1987 and 1988, and from 1994-2000, sardine spawning in early summer occurred principally
34 off the west coast, whereas the central and eastern Agulhas Bank were the principal spawning sites from 1989-1993 and since 2001 (Figure 3b; van der Lingen et al. 2001). Given that the distance between these two sites of intense spawning is 600-1200km, this variability represents a substantial spatial shift. The switch from spawning off the west coast that occurred in mid 1990s was seen as consequence of increased population size, reminiscent of the situation during the 1950s and early 1960s (van der Lingen et al. 2001). The increase of abundance of sardine and anchovy, which enabled sardine to escape the “school trap” (Bakun and Curry 1999) that previously had forced them to school with the more abundant anchovy and hence adopt their strategy of spawning on the south coast (van der Lingen et al. 2001).However, the recent return to spawning by sardine principally off south coast, observed since 2001, is currently unexplained. This has occurred in tandem with what appears to be an eastward shift in the sardine population as evidenced by commercial fishing patterns( Fairweather et al., submitted) and resource surveys (Coetzee et al.2004).
In the northern Benguela, egg distributions of small pelagics are currently contracted, and eggs are observed at substantially lower concentrations than was the case when populations of these species were larger than at present. The main areas of sardine spawning in the northern Benguela were in the vicinity of Walvis Bay in spring and Palgrave Point in summer (Figure 3c; le Clus 1990b; O'Toole 1977), and the sardine stock showed some indications of a partial separation, probably of younger and older spawners, into a northern Namibian sub-stock and a central Namibian sub-stock (O'Toole 1977; King 1977; Thompson and Mostert 1974). The production of eggs in the Walvis Bay region declined substantially following the collapse of the sardine stock and a reduction in the age structure of the population in the early 1970s, although spawning still occurred in the waters off Palgrave Point (Crawford et al., 1987). Ichthyoplankton surveys conducted in recent years have indicated that sardine egg and larval abundance in the vicinity of Walvis Bay is indeed very low, much lower than around Palgrave