Published in:
Gamito, S., Patricio, J., Neto, J.M., Teixeira, H. and Marques, J.C. 2012. Feeding diversity index as complementary information in the assessment of ecological quality status. Ecological Indicators 19: 73–78.
Feeding diversity index as complementary information in the assessment of ecological quality status
Sofia Gamito1*, Joana Patrício2, João M. Neto2, Heliana Teixeira2 and João Carlos Marques2
1
IMAR-CMA, CTA - Department of Biology and Biotechnology, Faculty of Sciences and Technology, University of the Algarve, Campus de Gambelas, 8005-139 Faro, Portugal 2
IMAR-CMA, Department of Life Sciences, Faculty of Sciences and Technology, University of Coimbra, Largo Marquês de Pombal, 3004-517 Coimbra, Portugal.
* Corresponding author: [email protected]
ABSTRACT
The feeding diversity of macroinvertebrates from the estuary of Mondego was estimated with Shannon–Wiener complementary evenness following the methodology presented in Gamito and Furtado (2009. Ecological Indicators, 9: 1009-1019). Results were compared with those from BAT (Benthic Assessment Tool; Teixeira et al., 2009. Marine Pollution Bulletin, 58: 1477-1786) applied to the same data set, obtained from sampling carried out in 14 estuarine subtidal stations in Spring of 1990, 1992, 1998, 2000 and 2002. The BAT is a multimetric methodology based on three indices, the Shannon-Wiener and Margalef diversity indices, applied in conjunction with AMBI (Marine Biotic Index). To determinate the feeding diversity, each invertebrate was assigned to a feeding group. Six trophic groups were considered: surface deposit feeders, subsurface deposit feeders, herbivores or grazers, suspension feeders and suspension/deposit feeders. The carnivorous, omnivorous and scavengers were all grouped together, forming the sixth group.
The results obtained with both tools pointed out, in general, to the same tendencies. However, in few occasions the feeding diversity pointed out to a high or a bad ecological quality condition whereas the BAT indicated a moderate condition. Occasionally, in stations with average species richness, all individuals were assigned to only one to three
feeding groups, and the feeding diversity was low. Even if these taxa were included in the first two or three AMBI sensitive groups, with their presence indicating a possible good ecological condition, they all perform the same ecological function, for example, they are all omnivorous. In these cases the trophic functioning of the system is reduced and the lower trophic levels are missing, such as the suspension-feeders and the decomposers or deposit-feeders. On the contrary, a highly diverse trophic assemblage might be found, but composed of taxa assigned to AMBI ecological groups of species indifferent or tolerant to organic enrichment, and of second-order opportunistic species, indicating a moderate ecological condition, while the feeding diversity will be high. The feeding diversity is, therefore, useful as a complementary information index, measuring other aspects of the community organization, which are not required for ecological quality assessment by the WFD, and so not included in metrics such as BAT.
Keywords: Water Framework Directive (WFD); Ecological quality status; benthic
invertebrates; trophic groups; functional ecology; Benthic Assessment Tool (BAT)
1. Introduction and aims
Under the scope of the Water Framework Directive (WFD), several biotic indices have been proposed for the ecological status classification of transitional waters. Specifically for macroinvertebrates, different European countries are adopting multimetric approaches, which try to include different aspects of macroinvertebrate community structure, compliant with the WFD, such as species richness, diversity and taxa composition (see Pinto et al., 2009, for a revision). Recently, however, the scientific community is becoming increasingly aware that for benthic quality assessment in transitional waters, it would be necessary to assess not only the structural attributes of the community, but also its functional attributes (Bremner et al., 2006; Elliott and Quintino, 2007; Mouillot et al., 2006). Functional features refer to the overall performance of ecosystems and are directly related with ecosystem processes (properties, goods and services) and to the individual components involved (Bremner et al., 2006).
Functioning of benthic communities has been assessed by different approaches including trophic group analysis (e.g. Bremner et al., 2006, Lavesque et al., 2009; Nickell et al., 2003; Roth and Wilson, 1998). Invertebrate trophic groups have been included in
multimetric indexes (e.g. Fano et al., 2003; Lavesque et al., 2009) or multivariate analysis (e.g. Bremner et al., 2003) and ecological modelling (e.g., Rybarczyk and
Elkaïm
, 2003). Word (1978) developed the Infaunal Trophic Index (ITI) to assess the trophic condition of benthic communities based in the relative proportions of four trophic groups: suspension feeders, carrion feeders, surface deposit feeders and subsurface deposit feeders. The ITI was developed for ecologists surveying the benthos on large areas of the continental shelves (Word, 1978). ITI has also been used in aquaculture environmental impact modelling (Aguado-Giménez et al., 2007), by way of the modelling tool DEPOMOD (Cromey et al., 2002). Some attempts have been made to adapt ITI to ecological quality assessment of transitional waters (Dauvin et al., 2007; Gamito and Furtado, 2009; Patrício et al., 2009). However, ITI appears not to be an appropriate index to infer the ecological quality of transitional waters, since it attains its maximal value (100%) when the entire community is composed by suspension feeders (Gamito and Furtado, 2009), a situation seldom observed in transitional waters. When the benthic trophic diversity is maximal, the ITI is equal to 50 %, indicating a changed environment, although this may be considered a healthy community for those systems (Gamito and Furtado, 2009).In fact, Pearson and Rosenberg (1978) pointed out that the relative proportions of five broad trophic groups in marine environments (deposit feeders, suspension feeders, carnivores, scavengers and herbivores) change according to several environmental factors such as sediment type, depth, salinity and organic load. In a comprehensive sampling program carried out in all estuaries of the northern Gulf of Mexico, Gaston et al. (1998) concluded that trophic diversity (determined with the Shannon-Wiener diversity index) increased in areas free of contaminants, and also in areas with higher salinity and higher dissolved oxygen levels. The surface deposit-feeders, together with the subsurface deposit-feeders and the suspension-feeders, dominated numerically by nearly equal proportions the trophic groups of these American estuaries. However, if biomass was considered, the suspension-feeders was the dominant group. In the Tagus estuary, the dominant group in abundance was the surface deposit feeders; when biomass was considered, the dominant groups were the feeders and the suspension-feeders/ detritivores (Gaudêncio and Cabral, 2007). According to the authors, a more even distribution of the trophic groups was found in the higher salinity areas, the upper estuary being dominated by surface deposit feeders, and the lower estuary by suspension feeders and other trophic groups.
In organically impacted areas, a decrease in almost all trophic groups and dominance by subsurface deposit feeders has been observed (e.g. Pearson and Rosenberg, 1978, Weston, 1990). In sediments contaminated by metals, by polynuclear aromatic hydrocarbons and / or pesticides, the invertebrates were also dominated by subsurface deposit-feeders (Gaston et al., 1998).
Assuming the presence of five or six trophic groups in healthy sediments with no clear dominance of a single group, Gamito and Furtado (2009) proposed the use of the Shannon-Wiener complementary evenness as an approach to estimate the feeding diversity of benthic invertebrates, and tested the index with historical data from subtidal samples of Ria Formosa coastal lagoon.
Although any index developed for evaluating the trophic organization of macroinvertebrate fauna is not compliant with the WFD, the feeding diversity is a useful and simple index to evaluate a functional aspect of the community, which could be used as a complement (even if not WFD compliant) to a multimetric index such as BAT (Benthic Assessment Tool; Teixeira et al., 2009). BAT was adopted by Portugal to assess the ecological quality of coastal waters using macroinvertebrate communities (Carletti and Heiskanen, 2009). In this work, we evaluate the applicability and complementarity of this feeding diversity index by comparing the results it yields with those derived from BAT when applied to the same data set. The variations of each of the three indices that compose BAT were also compared with the feeding diversity, together with species richness.
2. Methods
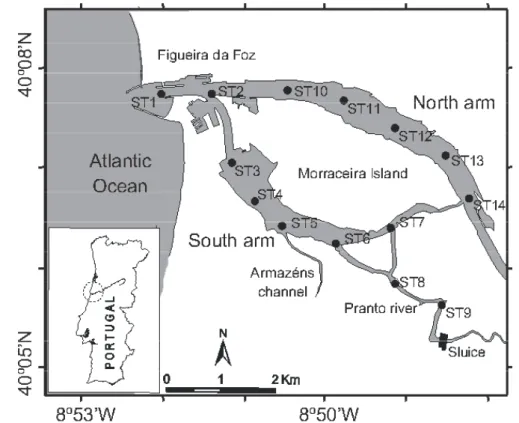
The data set was gathered from an extensive monitoring programme carried out in the Mondego estuary. Fourteen estuarine subtidal stations were sampled for macroinvertebrates in the Spring of 1990, 1992, 1998, 2000 and 2002, in the Mondego estuary (Fig. 1). At each station, three to five sediment replicates were randomly collected using a van Veen grab model LMG of 0.05-0.08 m2 sampling surface; the 1 mm fraction was analysed and benthic invertebrates identified and quantified (for sampling and laboratory procedures, see Teixeira et al. 2009). Following the Venice classification System for salinity, sampling stations can be classified as euhaline estuarine and polyhaline (Teixeira et al. 2008). Almost all stations showed sandy sediments with very low organic content (0.5 to 2
%)
except the inner stations of the south arm (stations 6 to 9)composed of muddy sands with higher organic matter content, varying between 3 and 8 %.
Fig. 1. Location of sampling stations in the Mondego estuary, Portugal.
To determine feeding diversity, each invertebrate species was assigned to a feeding group (Annex). Feeding information was based on Gamito (2008) compilation, and on MARBEF available information (http://www.marbef.org/data/erms.php). Six trophic groups were considered: surface deposit feeders, subsurface deposit feeders, herbivores or grazers, suspension feeders and suspension / deposit feeders. The carnivorous, omnivorous and scavengers were all grouped together, forming the sixth group. The Shannon-Wiener complementary evenness index (jFD) was then applied, following the methodology presented in Gamito and Furtado (2009):
n H j FD FD 2 ' log =
Where n is equal to the number of trophic groups considered, in this case, 6 trophic groups. This number will be always 6, independently of the number of trophic groups found in each station. It is assumed that in a healthy environment almost all trophic groups will be present, by opposition to a degraded environment dominated by few trophic groups (Gamito and Furtado, 2009). Identical ecological quality ratio intervals and correspondent ecological quality status (EQS) were adopted, namely: evenness values above 0.8
correspond to a High EQS; values between 0.8 and 0.6 indicate Good EQS; 0.4-0.6 values show a Moderate EQS: 0.2-0.4 values point out to Poor EQS; evenness values below or equal to 0.2 signals a Bad EQS.
The feeding diversity results were compared with species richness variation, Margalef (1958) and Shannon-Wiener (Shannon and Weaver, 1961) diversity indices, AMBI (Borja et al., 2000) and BAT (Teixeira et al., 2009), applied to the same data set. BAT is a multimetric methodology based on three indices, the Shannon-Wiener and Margalef diversity indices, applied in conjunction with AMBI. AMBI (AZTI Marine Biotic Index; available on: http://www.azti.es) considers five ecological groups ranging from sensitive species (GI) to first-order opportunistic species (GV) (Borja et al., 2000). The correlation among the different indices used was estimated with the Spearman rank correlation coefficient, with SigmaPlot (version 11) software.
3. Results
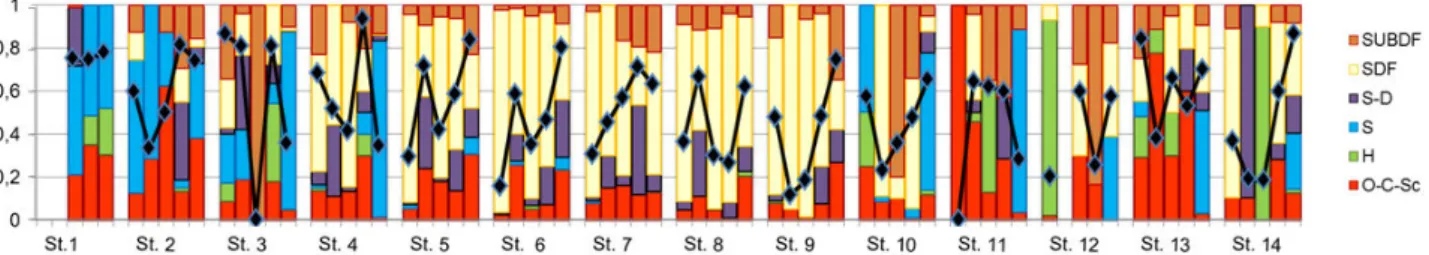
The stations near the head of the estuary, and in general the north arm stations presented a high variety of feeding habits, while the south arm stations (stations 5-9) had a constant dominance of surface and subsurface deposit feeders (Fig. 2).
Fig. 2. Variation of the feeding diversity (solid line) and of the six feeding groups relative abundance over the 14 stations, throughout the six sampling occasions considered. SSDF, subsurface deposit feeders; SDF, surface deposit feeders; S–D, suspension/deposit feeders; S, suspension feeders; H, herbivorous; O-C-Sc, omnivorous – carnivorous - scavengers group.
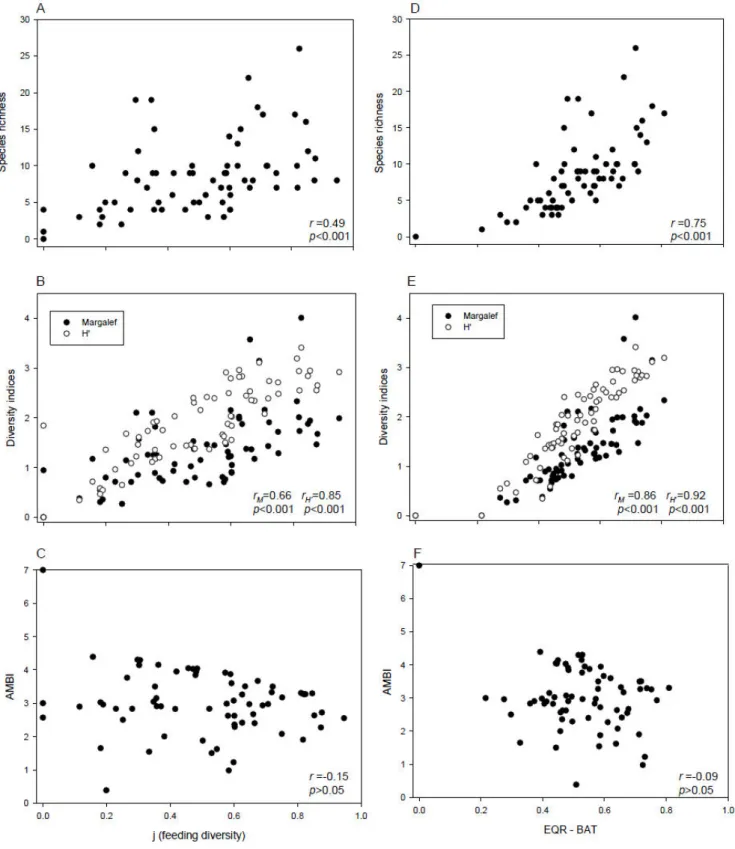
Positive Spearman rank correlations were found between BAT and the species richness, as well as with Shannon-Wiener and Margalef diversity indices (Fig. 3). No correlation was found between BAT and AMBI. Similar results were obtained with feeding diversity and species diversity indices, although with weaker r values. Between AMBI and feeding diversity a negative correlation was found, although not significant.
Fig. 3. Scatter (XY) plots between feeding diversity and (A) species richness, (B) diversity indices and (C) AMBI. Scatter (XY) plots of Ecological Quality Ratio (EQR-BAT) and the same indicators (D to F). Spearman correlations (r) and p values are indicated for each relation.
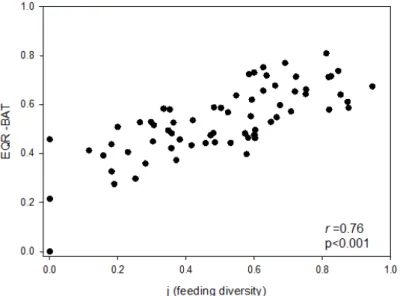
The results obtained with both tools, BAT and feeding diversity index, indicated, in general, the same tendencies, with a high correlation (Spearman rank correlation r=0.76, p<0.001) (Fig. 4 and Table 1). The number of Good and High cases on one hand, and
Bad to Moderate cases on the other hand, was exactly the same in both indices, but the number of coincident High or Good classifications was lower, varying usually between 60 and 89 %, and having presented 33 % only once. Although the number of Good and High cases were exactly the same, the BAT methodology classified more samples as being in Moderate state, whereas the feeding diversity classified more samples as being in Bad or Poor state.
Fig. 4. Scatter (XY) plot between feeding diversity and Ecological Quality Ratio (EQR-BAT). Spearman correlations (r) and p values are indicated.
In few occasions the feeding diversity pointed out to a High or a Bad ecological quality condition whereas the BAT indicated a Moderate condition (Tables 1 and 2). For example, in station 2, in Spring 1992, BAT pointed out to a Good status but the feeding diversity indicated a Bad status (Tables 1 and 2). Although the species richness was not very high (only seven taxa), these belonged to groups I to III of AMBI index, and consequently BAT indicated a Moderate status. However, the majority of those taxa were composed of omnivores-scavengers, and, consequently, several levels of the trophic food web were missing.
In station 3, in Spring 2000, BAT showed a Moderate status whereas feeding diversity indicated a High status. The species richness was not very high and most of the species belonged to groups III and IV of AMBI index, indicating a degraded situation. However, the seven species there observed were distributed among the five feeding groups, denoting a well structured food web. In Spring 1990, in Stations 11 and 12, although BAT pointed out to a Moderate status, the feeding diversity was very low, with
Table 1.
Ecological quality status of Mondego stations (1-14), based on BAT or feeding diversity. The occasions where a larger difference between methods was found are marked in bold. The second part of the table indicate the number of occurrences of “Good” and “High” status, compared with the number of occurrences of “Moderate” to “Bad” status, and the number of occurrences of “Bad” and “Poor”. The third part of this table indicates the number of occurrences of coincident High or Good classifications between the two indices, in percentage.
BAT Feeding diversity
1990 1992 1998 2000 2002 1990 1992 1998 2000 2002 Station 1 G G G M M M Station 2 M G G G G G B M H G Station 3 G G B M M H H B H P Station 4 G M P G M G M M H P Station 5 M G M G G P G M M H Station 6 P M M M H B M P M H Station 7 M M M G G P M M G G Station 8 M G M M G P G P P G Station 9 G P P M G M B B M G Station 10 M P P M G M P P M G Station 11 M M G M P B G G G P Station 12 M B M P P B B G P M Station 13 G M M M M H P G M G Station 14 P P P M G P B B M H G and H 4 4 3 5 9 4 4 3 5 9 B, P and M 9 9 11 9 5 9 9 11 9 5 B,P 2 4 5 1 2 7 6 6 2 3
Comparison between BAT and feeding diversity: 1990 1992 1998 2000 2002
(coincident H or G)/(H+G) % 75 75 33 60 89
Table 2.
Specific situations where BAT and feeding diversity classifications differ considerably. Details on number of species, number of feeding groups and relative proportions of the several feeding groups.
Station 2 3 11 12
Sampling occasion 1992 2000 1990 1990
BAT Good Moderate Moderate Moderate
Feeding diversity Bad High Bad Bad
Number of species 7 7 4 5
Number of feeding groups 2 5 1 3
Omnivores, carnivores and scavengers 0.29 0.18 1.00 0.02
Suspension feeders 0.71 0.09 - -
Grazers and herbivores - 0.36 - 0.91
Suspension / deposit feeders - 0.09 - -
Surface deposit feeders - 0.27 - 0.07
4. Discussion
The southern estuarine arm, an area with low water circulation and fine sediments, was dominated by surface and subsurface deposit feeders, while in the northern arm a large variety of feeding groups was found. The pattern of high density of deposit-feeders benthic invertebrates in areas of lower water circulation is in accordance with what is observed all over the word (e.g. Levinton, 2001).
The feeding diversity presented high correlations with species richness and species diversity indices. This is an expected result since, in a healthy environment, a station with a high number of species is likely to show these taxa distributed among different trophic groups, increasing the feeding diversity. In Mondego estuary the species richness was occasionally very low, with only a few species per station, consequently reducing the feeding diversity values.
The feeding diversity is not correlated with AMBI. This is an interesting result since it indicates that the feeding diversity can be used as a complementary index in benthic ecological quality assessment. The use of single univariate indicators to assess ecological quality is a too reductionist perspective of the environmental complexity (van Hoey et al., 2010). On the contrary, it is advisable to combine several indicators providing they do not yield conflicting information nor do they produce the same redundant information (e.g. Borja et al., 2007; Lavesque et al., 2009; van Hoey et al., 2010). Consequently, European countries have adopted multimetric indices that combine different aspects of benthic abundance and composition (Carletti and Heiskanen, 2009). The feeding diversity is not compliant with the WFD because it is not based on these two parameters, the abundance and the composition of benthic invertebrates, but it can be used as a complement to WFD indices to measure in an expedite way some aspects of the ecosystem functioning, such as trophic diversity.
One of the problems of AMBI, is that it cannot clearly characterize locals with high trophic diversity but composed by a relatively high percentage of detritivore species, typical of places where an accumulation of fine sediments and organic matter occur. This is the case of seagrass beds, which are usually places presenting high species richness and high trophic diversity (Gamito, 2008; Gamito and Furtado, 2009), and that are very sensitive to anthropogenic habitat degradation. However, AMBI might classify those places as being in a poor ecological condition due to the numerical dominance of opportunistic species (Blanchet et al., 2008). The feeding diversity index overcomes this problem as it is based on the assumption of a diverse trophic community characteristic of healthy soft sediments, even in muddy sediments that naturally occur in transitional waters. In
perturbed sediments, the trophic organization is affected, and only few trophic groups persist, thus decreasing the feeding diversity.
The results obtained with BAT and the feeding diversity index methodologies indicated, in general, the same tendencies regarding the ecological status of the Mondego estuary stations. However, some discrepancies were observed. Occasionally, in stations with average species richness, all individuals were assigned to only one or two feeding groups, and the feeding diversity was low. Even if these taxa were included in the first two or three AMBI ecological groups, which would indicate a possible Good ecological status (EQS), they all perform the same trophic function, for example, they are all omnivorous or herbivorous. In these cases, the trophic functioning of the system is reduced to only one or two levels, and the lower trophic levels are missing, such as the suspension-feeders and the decomposers or deposit-feeders. This was observed in station 2, in 1992, where the largest difference was found. BAT points out to a Good EQS while the feeding diversity index points out to a Bad EQS. Seven species were found, the majority carnivorous / scavengers, with a small proportion represented by a suspension feeder. Although most species were assigned to AMBI ecological groups I and II, indicating a Good ecological condition, their presence might be due to a local accumulation of carrion. Four trophic groups were missing from the food web. On the contrary, a highly diverse trophic assemblage may be found, but composed of taxa assigned to AMBI ecological groups II to IV, thus indicating a Moderate ecological condition, while the feeding diversity would indicate it to be high. This has been observed, for example, in station 3, in 2000.
Gamito and Furtado (2009 and references therein) pointed out the difficulty of assigning some species to a single trophic group, and the changes in feeding mode of some species depending on food availability, environmental conditions and developmental stage. The inclusion of generalist species in the omnivorous-carnivorous-scavenger group avoided some of these difficulties. Similarly, some bivalve species, known to be either suspension feeders or surface deposit feeders, depending on food availability, were included in the S-D (suspension/deposit feeders) group. For other species the doubt remained. Should they have been included in one group or the other or should their abundance have been divided by the different feeding groups they might belong to? And if divided, should there be with a differential weighting or would they be equally divided by the different groups? Occasionally, the inclusion of one species in a given feeding group may be a matter of expert judgement. For example, if a species is considered to be an herbivore, but also a deposit feeder, in the absence of vegetation it should be included in the deposit-feeder group.
One of the species that merits doubts about its feeding habits (see Appendix) is the small gastropod Hydrobia ulvae, a relatively abundant species in the Mondego. In our analysis, and following the works of Fenchel et al. (1975), it was classified as subsurface deposit feeder. However, these authors also refer this species as grazing on the thallus of
Ulva spp. and on other species, and as trapping surface-film bacteria with secreted mucus.
Schanz et al. (2002, and references there in) pointed out the importance of H. ulvae in removing the epiphyte layer of the intertidal seagrasses in sheltered areas of the Wadden sea. In the intertidal seagrass beds of the Mondego estuary, H. ulvae was consider to be a grazer /detritivore (Baeta et al., 2009). However, in the subtidal stations, without seagrasses or attached macrophytes, H. ulvae was classified as deposit feeder. Should it then be considered surface or subsurface deposit feeder? Changing the feeding group of
H.ulvae, in the present work, from subsurface to surface-deposit feeder, decreases the
value of the estimated feeding diversity in the majority of the estimates. Nevertheless, the general tendency and the larger differences between BAT and feeding diversity EQS classification marked in Table 2 would not change. Gamito and Furtado (2009) proposed the estimation of the feeding diversity with six or five trophic groups, the latter by agglomerating the subsurface and surface deposit feeders in a single group. That would result in lower estimated feeding diversities and a necessary rescaling of the ecological status classes.
Applying the feeding diversity methodology to a data set resulting from a 0.5 mm sieve can eventually give different results from a data set resulting from a 1 mm mesh sieve, since the smaller specimens, most of them deposit feeder polychaetes, may only be retained in the finer mesh sieve. However, the same would happen, for example, with the small carnivorous of the Syllidae family or the very small juveniles of suspension feeder bivalves and, therefore, this would balance the final result. Hence, the feeding diversity estimates would not change significantly, although this needs to be tested with new data sets.
According to Dale and Beyeler (2001), ecological indicators should capture the complexity of the ecosystem but remain simple enough to be easily monitored. None of the multimetrics adopted by the European countries, such as M-AMBI (Muxika et al., 2007), BAT (Teixeira et al., 2009) or Infaunal Quality Index (Carletti and Heiskanen, 2009) are easily determined. They comply with the exigencies of WFD by incorporating the taxonomic composition and abundance of macroinvertebrates. However, they imply a very time-consuming routine of sampling, sorting out and identifying all taxa. Still, after all this routine work is completed, the feeding diversity can then easily be calculated. In spite of
this simplicity, some difficulties may arise, already discussed above and in Gamito and Furtado (2009).
The feeding diversity is, therefore, useful as a complementary information index, measuring other aspects of the community organization, which are not contemplated in multimetrics developed in conformity with WFD, such as BAT (Teixeira et al., 2009), M-AMBI (Muxika et al., 2007) or Infaunal Quality Index (Carletti and Heiskanen, 2009).
Acknowledgments
The present study was carried out using means provided by the research projects RECONNECT (PTDC/MAR/64627/2006), WISER (FP7-ENV-2008-226273) and 3M-RECITAL (LTER/BIA-BEC/0019/2009). It was also supported by the European Social Fund and MCTES national funds, through the POPH: Human Potential Operational Programme – NSRF: National Strategic Reference Framework – 4.4. We acknowledge two anonymous referees for their valuable comments and suggestions.
References:
Aguado-Giménez, F., Marín, A., Montoya, S., Marín-Guirao, L., Piedecausa, A., García-García, B., 2007. Comparison between some procedures for monitoring offshore cage culture in western Mediterranean Sea: Sampling methods and impact indicators in soft substrata. Aquaculture 271, 357–370.
Baeta, A. Valiela, I., Rossi, F. Pinto, R., Richard, P., Niquil, N., Marques, J.C., 2009. Eutrophication and trophic structure in response to the presence of the eelgrass Zostera noltii. Mar. Biol. 156, 2107–2120. Blanchet, H., Lavesque, N., Ruellet, T., Dauvin, J.-C., Sauriau, P. G., Desroy, N., Desclaux, C., Leconte, M.,
Bachelet, G., Janson, A.-L., Bessineton, C., Duhamel, S., Jourde, J., Mayot, S., Simon, S., Montaudouin, X., 2008. Use of biotic indices in semi-enclosed coastal ecosystems and transitional waters habitats: Implications for the implementation of the European Water Framework Directive. Ecol. Indicators 8, 360–372.
Borja, A., Franco, F., Pérez, V., 2000. A marine biotic index to establish the ecological quality of soft-bottom benthos within European estuarine and coastal environments. Mar. Pollut. Bull. 40, 1100–1114.
Borja, A., Josefson, A.B., Miles, A., Muxika, I., Olsgard, F., Phillips, G., Rodriguez, J.G., Rygg, B., 2007. An approach to the intercalibration of benthic ecological status assessment in the North Atlantic ecoregion, according to the European Water Framework Directive. Mar. Pollut. Bull. 55, 42–52.
Bremner, J., S. L. Rogers, Frid, C.L.J., 2003. Assessing functional diversity in marine benthic ecosystems: a comaprison of approaches. Mar. Ecol.- Prog. Ser. 254, 11-25.
Bremner, J., S. L. Rogers, Frid, C.L.J., 2006. Methods for describing ecological functioning of marine benthic assemblages using biological traits analysis (BTA). Ecol. Indicators 6, 609–622
Carletti, A., Heiskanen, A.S., 2009. Water Framework Directive intercalibration technical report. Part 3: Coastal and Transitional waters, Rep. No. EUR 23838 EN/3. European Commission.
Cromey, C.J., Nickell, T.D., Black, K.D., 2002. DEPOMOD - modelling the deposition and biological effects of waste solids from marine cages. Aquaculture 214, 211-239.
Dale, V.H., Beyeler, S.C., 2001. Challenges in the development and use of ecological indicators. Ecol. Indicators 1, 3-10.
Dauvin, J.C., Ruellet, T., Desroy, N., Janson, A.-L., 2007. The ecological quality status of the Bay of Seine and Seine estuary: use of biotic indices. Mar. Pollut. Bull. 55, 241-257.
Elliott, M., Quintino, V., 2007. The estuarine quality paradox, environmental homeostasis and the difficulty of detecting anthropogenic stress in naturally stressed areas. Mar. Pollut. Bull. 54, 640-645.
Fano, E.A., Mistri, M., Rossi, R., 2003. The ecofunctional quality index (EQI): a new tool for assessing lagoonal ecosystem impairment. Est. Coastal Shelf Sci. 56, 709–716.
Fenchel, T., Kofoed, L.H., Lappalainen, A. ,1975. Particle size-selection of two deposit feeders: the amphipod Corophium volutator and the prosobranch Hydrobia ulvae. Mar. Biol. 30, 119-128.
Gamito, S., 2008. Three main stressors acting on the Ria Formosa lagoonal system (Southern Portugal): Physical stress, organic matter pollution and the land-ocean gradient. Est. Coastal Shelf Sci. 77, 710-720.
Gamito, S., Furtado, R., 2009. Feeding diversity in macroinvertebrate communities: A contribution to estimate the ecological status in shallow waters. Ecol. Indicators 9, 1009-1019.
Gaston, G.R., Rakocinski, C.F., Brown, S.S., Cleveland, C.M., 1998. Trophic function in estuaries: response of macrobenthos to natural and contaminant gradients. Mar. Freshwater Res. 49, 833-846.
Gaudêncio, M.J., Cabral, H.N., 2007. Trophic structure of macrobenthos in the Tagus estuary and adjacent coastal shelf. Hybrobiologia 587, 241-251.
Lavesque, N., Blanchet, H., de Montaudouin, X., 2009. Development of a multimetric approach to assess perturbation of benthic macrofauna in Zostera noltii beds. J. Exp. Mar. Biol. Ecol. 368, 101–112. Levinton, J.S., 2001. Marine Biology. Function, Biodiversity, Ecology, 2nd ed. Oxford University Press, New
York.
Margalef, R., 1958. Information theory in ecology. Gen. Syst. 3, 36–71.
Mouillot, D., Spatharis, S., Reizopoulou, S., Laugler, T., Sabetta, L., Basset, A., Chi, T. Do., 2006. Alternatives to taxonomic-based approaches to assess changes in transitional water communities. Aquatic conservation – Mar. Freshwater Ecosyst.16, 469-482.
Muxika, I., Borja, A., Bald, J., 2007. Using historical data, expert judgement and multivariate analysis in assessing reference conditions and benthic ecological status, according to the European Water Framework Directive. Mar. Pollut. Bull. 55, 16-29.
Nickell, L.A., Black, K.D., Hughes, D.J., Overnell, J., Brand, T.,Nickell, T.D., Breuer, E., Harvey, S.M., 2003. Bioturbation, sediment fluxes and benthic community structure around a a salmon cage farm in Loch Creran, Scotland. J. Exp. Mar. Biol. Ecol. 285–286, 221–233.
Patrício, J., Neto, J. M., Teixeira, H., Salas, F., Marques, J.C., 2009. The robustness of ecological indicators to detect long-term changes in the macrobenthos of estuarine systems. Mar. Environ. Res. 68, 25-36. Pearson, T.H., Rosenberg, R., 1978. Macrobenthic succession in relation to organic enrichment and
pollution of the marine environment. Oceanogr. Oceanogr. Mar. Biol. Ann. Rev. 16, 229-311.
Pinto, R., Patrício, J., Baeta, A., Fath, B., Neto, J. M., Marques, J.C., 2009. Review and evaluation of estuarine biotic indices to assess benthic condition. Ecol. Indicators 9, 1-25.
Roth, S., Wilson, J.G., 1998. Functional analysis by trophic guilds of macrobenthic community structure in Dublin Bay, Ireland. J. Exp. Mar. Biol. Ecol. 222, 195–217.
Rybarczyk, H., Elkaim, B., 2003. An analysis of the trophic network of a macrotidal estuary: the Seine estuary (Eastern Channel, Normandy, France). Est. Coastal Shelf Sci. 58, 775–791.
Schanz, A., Polte, P., Asmus, H., 2002. Cascading effects of hydrodynamics on an epiphyte–grazer system in intertidal seagrass beds of the Wadden Sea. Mar. Biol. 141, 287–297.
Shannon, C.E., Weaver, W., 1963. The Mathematical Theory of Communication. The University of Illinois Press, Illinois.
Teixeira, H., Salas, F., Borja, A., Neto, J.M., Marques, J.C. 2008. A benthic perspective in assessing the ecological status of estuaries: The case of the Mondego estuary (Portugal). Ecol. Indicators 8, 404-416. Teixeira, H., Neto, J.M., Patrício, J., Veríssimo, H., Pinto, R., Salas, F., Marques, J.C., 2009. Quality
assessment of benthic macroinvertebrates under the scope of WFD using BAT, the Benthic Assessment Tool. Mar. Pollut. Bull. 58, 1477–1486.
Van Hoey, G., Borja, A., Birchenough, S., Buhl-Mortensen, L., Degraer, S., Fleischer, D., Kerckhof, F., Magni, P., Muxika, I., Reiss, H., Schröder, A., Zettler, M.L., 2010. The use of benthic indicators in Europe: from the Water Framework Directive to the Marine Strategy Framework Directive. Mar. Pollut. Bull. 60, 2187-2196.
Weston, D.P., 1990. Qualitative examination of macrobenthic community changes along an organic enrichment gradient. Mar. Ecol. Prog. Ser. 61, 233-244.
Word, J., 1978. The Infaunal Trophic Index. In: Bascom, W. (Ed.), Southern California Coastal Water Research Project, pp. 19–39.