Mesothelioma Mortality Rate in Brazil, 1980 to 2010
Mortalidade por Mesotelioma no Brasil, 1980 a 2010
Mortalidad por Mesotelioma en Brasil, 1980 a 2010
Francisco Pedra1; Patricia de Oliveira da Silva2; Ines E. Mattos3; Hermano A. Castro4
Abstract
Introduction: Mesothelioma is a type of cancer whose incidence has been increasing worldwide, mainly as a result of asbestos exposure. Brazil is still a major producer and consumer of that fiber. Objective: The aim of this paper is to describe the distribution of mesothelioma mortality rate in Brazil during the period of 1980-2010. Method: an ecologic study was carried out with a descriptive analysis. The records used came from the national system of information on Mortality of datasus (sistema nacional de informações sobre Mortalidade do datasus). Results: Found 3,718 deaths from mesothelioma; the majority of them (2,180) occurred in the southeast of the country. There was a balance in the mortality rate between men and women showing a ratio of 1.12:1, and 80.7% of deaths occurred among individuals within the age range of 50 years old and above. The standardized mortality rates by age increased from 0.64 deaths per million population in 1980 to 1.18 deaths per million population in 2002. Conclusion: Mortality statistics for mesothelioma in Brazil are low; they don’t match the intensity of production and use of asbestos in our country; and they don’t reflect the actual magnitude of the problem.
Key words: Mesothelioma/epidemology; asbestos/poisoning; neoplasms, environmental Health surveillance, Brazil
national school of Public Health. oswaldo cruz Foundation. rio de Janeiro (rJ), Brazil.
1 Medical doctor, Phd., research center for Worker Health and Human ecology, national school of Public Health, oswaldo cruz Foundation. rio de
Janeiro (rJ), Brazil. E-mail: fpedra@ensp.fiocruz.br.
2 nutritionist, Graduate student in the epidemiology Master’s program at the national school of Public Health, oswaldo cruz Foundation. rio de
Janeiro (rJ), Brazil. E-mail: patricia.oliveira.silva@hotmail.com.
3 Medical doctor, senior researcher, Ph.d., department of epidemiology and Quantitative Methods in Health, national school of Public Health,
oswaldo cruz Foundation, rio de Janeiro (rJ), Brazil. E-mail: imattos@ensp.fiocruz.br.
4 Medical doctor, senior researcher, Ph.d., research center for Worker Health and Human ecology, national school of Public Health, oswaldo cruz
Foundation. rio de Janeiro (rJ), Brazil. E-mail: hermanocastro10@gmail.com.
Corresponding author: Francisco Pedra. e-mail: fpedra@ensp.fiocruz.br.
os dados mostrados neste artigo serão apresentados oralmente no 2º simpósio Brasileiro de saúde & ambiente, a se realizar de 19 a 22 de outubro de 2014, em Belo Horizonte (MG), Brasil.
INTRODUCTION
Mesothelioma is a type of cancer that used to be considered rare, but now has been gaining global visibility due to its increasing incidence worldwide1. it reaches especially the pleura (the main causal agent of over 80% of the cases is the exposure to asbestos fibers2).
This disease is considered an occupational cancer because approximately 80-85% of the cases are attributable to the exposure to fibers in the workplace2, but also to environmental exposure, which occurs mainly in areas close to mining activity, industries, buildings and products that release the fiber by its natural wear, and also due to domestic exposure through clothing or objects brought home by workers who handle the material3,4.
Mesothelioma has a long latency period that may range between 15 and 60 years5 and its diagnosis is difficult to determine, being necessary to collect histological, immunohistochemical and cytogenetic information for the differential diagnosis with other tumors, including adenocarcinomas and sarcomas1,6-8. The survival period after diagnosis corresponds to about 12 months9.
asbestos have been used intermittently for thousands of years due to its physical properties that confer commercial importance and participation in an increasingly wide range of industrial products, like tiles, water tanks, joints and automotive brake pads2. The world consumption of this fiber has greatly increased from the 1920s, reached its peak in 1980 and declined by the end of 1990, stabilizing at about 2 million metric tons per year, approximately half of which accounts for the peak consumption in the 1980s10,11.
due to its recognized carcinogenic potential at any dose inhaled2, from the end of the 80s, about 58 countries – including all european community – have begun to prohibit the chrysotile fiber type, whereas the amphibole fiber type is already banned worldwide12. For such countries, the incidence and mortality rates in the future are expected to stabilize. at the same time, the production and consumption of the fiber has shifted to less industrialized countries of peripheral economy, where data on the disease are scarce, the exposure is generally high, and mortality rates can reach peak into the future13. Brazil is the 3rd largest producer, consumer and exporter of asbestos; but, despite this, the scarce incidence and mortality statistics show values much lower than expected14.
The aim of this paper is to describe the distribution of mesothelioma mortality rate in Brazil during the period of 1980-2010.
MeThOD
Mortality data was obtained from the Mortality information system (siM, in Portuguese), provided by datasus in the website www.datasus.gov.br. From
1980 to 1995, deaths were selected primarily because they corresponded to code 163 (Malignant neoplasm of pleura) of the 9th revision of the international classification of diseases (icd- 9). during the period of 1996-2010, selected deaths had underlying cause codes corresponding to the 10th revision of the international classification of diseases (icd - 10): c45.0 (malignant pleural mesothelioma); c45.1 (malignant mesothelioma of the peritoneum); c45.2 (malignant mesothelioma of the pericardium); c45.7 (malignant mesothelioma from other locations); c45.9 (mesothelioma unspecified) and c38.4 (cancer of the pleura, excluding mesothelioma). it was assumed that all deaths linked to the cancer of pleura corresponded to mesotheliomas15. There was also collected information on the following variables: date of death, date of birth, age at death, place of residence and gender. The corresponding population data for the denominators was also obtained in datasus and was based on censuses (1980, 1991, 2000 and 2010), count (1996) and intercensal projections (other years), according to age, gender and household situation, elaborated by the Brazilian institute of Geography and statistics (iBGe, in Portuguese).
For descriptive analysis, the absolute and relative frequencies (percentages) of deaths were calculated on the selected code and place of residence in macro-regional Federation units and capitals levels of aggregation. Then, the top 12 were selected in each group according the average rate and their attributes of gender, age and year of death. The average rates were obtained by a sum of the deaths during the determined time period in relation to the sum of the territory's population during the same period, including deaths and populations for which the age attribute was ignored. Five-year average rates were obtained by the sum of deaths accumulated during 5 years in relation to the sum of the population equally accumulated for the periods of 80-84, 85-89, 90-94, 95-99, 00-04. For that, we used every year with available data on the siM, and the last period (05-10) was a six-year period, and, thus, used a calculation with the accumulation of 6 years, including deaths and populations for which the age group attribute was ignored. Gross annual rates were estimated and age-standardized by the world population provided by the World Health organization (WHo), reported by 106 people. For this calculation, we didn’t considered deaths and population for which the ignored age group was assigned. tabulations and calculations were performed using the tabwin 3.4® and excel 2013®.
ResUlTs
From 1980 to 2010, 3,718 mesothelioma deaths occurred in Brazil, being 1,961 (52.74%) among men. Three deaths had no information about gender. The
Figure 1. Distribution of deaths from mesothelioma by gender and age group, Brazil. 1980 to 2010
source: Prepared by the author with data from the Mortality information system (siM), MinistrY oF HealtH Brazil, datasus.
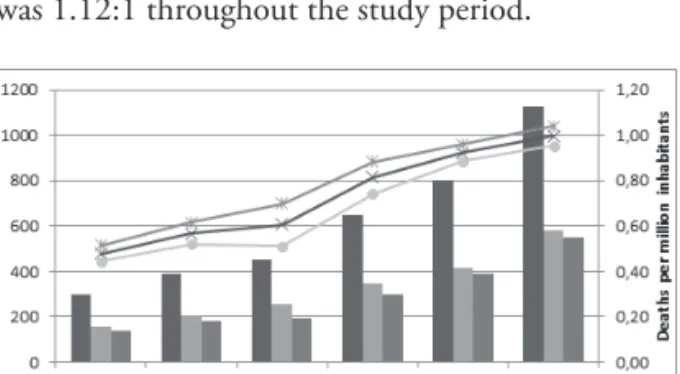
Figure 2. Distribution of deaths and five-year average mortality rates by gender for mesothelioma (per million inhabitants), Brazil, from 1980 to 2010
source: Prepared by the author with data from the Mortality information system (siM), MinistrY oF HealtH Brazil, datasus.
majority of deaths were concentrated in individuals within the age range of 50 years old or above (80.7%), especially between 60 and 69 years old (24%) and 70 and 79 years old (25%) (Figure 1).
in Brazil and its regions, states, and selected capitals, in descending order, beginning from the average mortality rate. it was seen that the annual standardized mortality rate by age in Brazil showed the minimum value of 0.64 deaths per million population in 1980 and 1985 and the maximum value of 1.18 per million population in 2002. By analyzing the distribution of deaths according to the Brazilian regions, one can observe that 58% (2,180) of these occurred in the southeastern region, followed by the southern region with 17.5%, the northeastern region with 16.6%, the Midwestern region with 4.4%, and the north of the country with 2.8%. The average mortality rates in the southeast (1.05) and south (0.89) of the country were higher than the national average rate of 0.77 deaths per million population. These regions had also the highest annual mortality rates.
The deaths occurred in the states of são Paulo, rio de Janeiro, Minas Gerais and rio Grande do sul represented, respectively, 30.7%, 15.5%, 11.2% and 10.2% of the total deaths from mesothelioma registered in the country during the study period. together, they accounted for 67.6% of the total deaths. The referred states, as well as the Federal district, had higher rates than the average rates of Brazil. in table 1, one can observe the importance of these states for the pattern of mortality rate from mesothelioma in the country.
in relation to the evaluated capitals, it’s worth noting the concentration of deaths in são Paulo, rio de Janeiro, salvador and Porto alegre, corresponding, respectively, to 27.11%, 22.9%, 6.7% and 5.8% of the total deaths. together, these capitals accounted for 62.51% of deaths from mesothelioma occurred in the study period. Porto alegre, rio de Janeiro and recife had the highest average mortality rates.
table 2 shows the distribution of deaths from mesothelioma in the study period. it is observed that 1,238 (33.3%) occurred in the period of the validity of icd-9 code and received 163 (malignant neoplasm of pleura). already during the cid 10, one can observe that 40.5% of deaths received code c38.4 (Malignant neoplasm of pleura) and 26.3% received the code c45.X (Malignant Mesothelioma). among the malignant mesotheliomas themselves (c45.X), 35.14% showed pleural location, 14.65% were located in the peritoneum, pericardium 0.72%, 6.46% in other locations, and 43.03% were classified as not specified. although the order of distribution of deaths among men and women has shown the same order of distribution, it was possible to observe some specificity. The percentage of female peritoneum cancer was about 8% higher than that presented by the set of deaths and deaths in general, and about 14% higher than in men. The percentage of unspecified mesothelioma in men, in turn, was 10% higher than among women. in Figure 2, one can observe the upward trend in
mortality from mesothelioma during the study period. during the initial period of the series, 296 deaths have occurred; and between the years of 2005-2010, 1,128 deaths have occurred ranging between 158 and 578 among men, and between 138 and 550 among women. The highest number of deaths was seen during the years of 1995-1999. The five-year mortality rates ranged between 0.48 and 1.00 deaths per million population (in general); between 0.51 and 1.04 deaths per million population among men; and between 0.44 and 0.96 deaths per million population among women, respectively during the first and the last period analyzed. The man: woman rate was 1.12:1 throughout the study period.
table 1 shows the distribution of the absolute number of deaths, the average rates (ar) and annual age-standardized mesothelioma mortality rate by age,
Deaths AR 1980 1981 1982 1983 1984 1985 1986 1987 1988 1989 1990 1991 1992 1993 1994 1995 1996 1997 1998 1999 2000 2001 2002 2003 2004 2005 2006 2007 2008 2009 2010 Brasil 3718 0.77 0.64 0.76 0.68 0.86 0.65 0.64 0.85 0.81 0.87 0.81 0.82 0.78 0.78 0.90 0.82 0.92 0.95 1.18 1.16 1.05 0.92 0.95 1.18 1.15 1.15 1.17 1.17 1.12 1.07 0.82 0.94 Regions Sudeste 2180 1.05 0.84 0.98 0.88 1.41 0.93 0.84 1.08 1.15 0.95 0.87 1.21 1.01 1.07 1.18 1.19 1.03 1.17 1.15 1.58 1.43 1.09 1.17 1.50 1.41 1.36 1.63 1.55 1.38 1.35 1.08 1.07 Sul 650 0.89 0.74 1.07 0.86 0.75 0.27 0.98 1.29 0.70 0.97 1.46 0.68 1.32 0.70 1.12 0.55 1.57 0.82 1.76 1.09 1.37 1.14 0.76 1.44 1.13 1.39 1.21 1.39 1.15 1.12 0.51 1.02 Centro -oeste 165 0.51 0.00 0.22 0.77 0.71 0.75 0.11 0.61 0.37 1.08 0.74 0.33 0.17 0.33 0.43 0.61 1.15 1.54 1.40 1.41 0.86 0.47 0.98 1.02 0.46 0.98 0.85 0.87 0.89 1.02 0.36 0.77 Nordeste 619 0.45 0.41 0.33 0.33 0.11 0.47 0.28 0.36 0.36 0.67 0.38 0.48 0.28 0.48 0.40 0.50 0.34 0.62 0.93 0.49 0.48 0.70 0.76 0.65 0.93 0.82 0.58 0.61 0.80 0.74 0.73 0.77 Norte 104 0.30 0.45 0.51 0.00 0.58 0.32 0.24 0.56 1.11 0.85 1.01 0.00 0.42 0.80 0.89 0.34 0.85 0.57 0.74 0.64 0.14 0.36 0.44 0.46 0.94 0.56 0.45 0.36 0.42 0.11 0.59 0.54
States Rio de Janeiro
575 1.37 1.37 1.48 0.65 1.48 0.94 0.89 2.13 1.52 1.12 1.15 1.66 1.57 1.59 1.74 1.80 1.78 1.03 1.79 1.83 2.42 1.25 0.93 1.67 1.90 1.55 1.59 1.28 1.23 1.08 1.03 0.98
Rio Grande do Sul
378 1.28 0.71 1.51 1.47 1.09 0.41 0.83 1.51 0.72 1.01 2.13 0.89 2.01 0.70 0.99 0.91 2.23 0.91 2.74 1.68 1.63 1.21 0.82 2.09 1.37 1.81 1.08 1.45 1.44 1.31 0.69 1.52 Distrito Federal 62 1.10 0.00 0.67 2.66 2.49 0.00 0.00 0.00 0.57 3.19 0.00 0.00 0.00 1.48 0.00 1.45 1.53 3.94 1.26 8.59 2.40 0.53 3.33 4.99 1.37 2.78 1.95 1.74 1.20 1.93 0.86 1.72 São P aulo 1142 1.09 0.81 0.97 1.17 1.48 0.99 0.99 1.05 1.19 0.99 0.82 1.25 0.80 0.91 0.92 1.03 0.69 1.37 0.97 1.71 1.37 1.21 1.36 1.39 1.38 1.59 1.84 1.89 1.60 1.78 1.29 1.13 Minas Gerais 412 0.80 0.47 0.41 0.66 1.32 0.72 0.61 0.26 0.78 0.77 0.79 0.60 1.04 1.03 1.19 1.06 1.17 1.05 1.02 1.15 0.69 0.78 0.99 1.68 1.11 0.76 1.30 1.25 1.05 0.87 0.76 0.92 Santa Catarina 114 0.75 0.40 0.92 0.99 0.93 0.00 0.85 1.24 0.35 0.41 0.36 1.04 0.00 0.98 1.29 0.64 1.88 0.76 0.55 1.13 1.99 1.58 1.12 0.64 0.59 1.74 1.90 2.23 0.72 0.77 0.41 0.79 Sergipe 31 0.62 0.00 0.00 0.00 1.40 1.46 1.33 0.00 0.85 0.00 0.00 0.95 0.00 1.25 0.00 0.00 0.93 2.00 3.35 1.12 1.72 2.42 0.00 0.00 0.68 0.00 0.00 0.67 1.56 0.77 0.39 1.50 Pernambuco 141 0.61 1.32 1.28 0.45 0.00 0.25 0.25 0.16 0.71 0.85 0.38 0.12 0.36 0.35 1.09 0.58 0.37 1.82 1.29 1.19 0.72 0.61 0.69 1.27 1.16 1.72 1.02 0.80 0.90 0.82 0.36 0.42 Espírito Santo 51 0.59 0.00 1.38 0.00 0.65 1.53 0.00 0.00 0.75 0.66 0.00 1.80 0.00 0.00 1.22 0.30 0.00 0.00 0.41 0.90 1.02 0.33 1.35 0.78 1.10 0.97 1.20 0.58 1.56 0.39 0.56 1.95 Paraná 158 0.57 0.98 0.53 0.00 0.19 0.23 1.30 1.04 0.83 1.23 1.08 0.19 1.06 0.54 1.22 0.00 0.44 0.70 1.07 0.31 0.67 0.80 0.45 1.05 1.11 0.61 0.97 0.82 1.04 1.09 0.36 0.51 Bahia 188 0.49 0.49 0.20 0.73 0.00 0.83 0.73 0.65 0.38 1.36 0.10 0.83 0.31 0.88 0.33 0.43 0.22 0.10 0.82 0.32 0.44 0.85 1.27 0.85 0.74 1.21 0.49 0.91 0.89 0.77 0.74 0.47
Mato Grosso do Sul
29 0.49 0.00 0.00 2.13 0.00 2.43 0.00 0.00 0.00 0.00 0.00 1.13 0.00 0.00 0.00 0.81 2.73 1.41 1.68 0.00 0.86 0.00 1.36 0.00 0.00 1.31 0.60 2.11 0.40 1.17 0.00 1.25
Capitals Porto Alegre
86 2.14 2.64 3.35 0.93 0.00 0.00 0.00 1.99 2.78 0.99 4.22 0.93 3.16 2.74 2.38 0.00 4.11 0.60 3.60 0.78 1.36 0.57 1.72 6.79 0.55 2.23 1.25 2.51 1.82 2.56 0.31 3.08 Rio de Janeiro 338 1.93 1.84 2.38 0.64 1.78 1.02 1.00 2.50 2.07 1.04 1.14 1.63 2.32 2.01 2.68 1.96 2.52 1.31 2.72 1.97 3.75 1.20 1.05 1.85 2.19 1.71 1.80 1.70 1.08 0.80 1.12 1.06 Recife 68 1.61 2.98 2.93 1.22 0.00 1.34 1.30 0.72 2.46 3.12 2.04 0.73 0.99 1.73 4.82 3.07 0.00 5.69 3.54 4.32 0.72 2.36 0.81 1.51 2.81 4.13 3.78 0.00 1.96 0.00 0.78 0.00 Salvador 99 1.44 3.11 0.00 2.06 0.00 4.35 2.51 2.34 0.00 3.74 0.85 4.86 2.48 4.04 1.31 1.70 0.93 0.77 4.64 1.41 2.06 3.82 3.46 3.49 0.98 3.91 0.68 0.54 1.99 1.18 1.95 0.66 Florianópolis 13 1.43 0.00 0.00 0.00 0.00 0.00 0.00 6.66 0.00 0.00 0.00 5.21 0.00 5.36 4.75 0.00 0.00 0.00 0.00 4.58 4.53 0.00 3.24 0.00 2.61 3.03 2.22 2.81 0.00 0.00 0.00 5.05 São P aulo 400 1.30 0.93 1.04 1.53 1.78 0.97 1.82 0.75 0.97 1.64 1.48 0.99 0.85 1.16 1.33 0.98 0.37 1.45 1.26 1.99 1.75 1.07 1.53 1.48 2.21 2.40 2.20 2.33 1.37 1.68 1.43 1.70 Maceió 28 1.30 0.00 0.00 0.00 0.00 0.00 0.00 0.00 0.00 0.00 1.47 0.00 0.00 3.11 2.76 2.72 6.60 3.99 5.34 4.83 2.54 4.32 1.89 3.03 4.92 0.00 1.08 1.19 0.00 3.13 1.56 1.52 Aracaju 17 1.29 0.00 0.00 0.00 0.00 6.34 5.10 0.00 4.08 0.00 0.00 0.00 0.00 5.03 0.00 0.00 3.11 3.62 8.93 4.57 3.43 0.00 0.00 0.00 2.23 0.00 0.00 0.00 3.56 0.00 1.52 1.36 Belo Horizonte 77 1.18 0.00 1.23 1.82 2.49 0.77 1.70 0.00 0.41 1.27 1.98 0.00 1.35 2.00 1.56 0.68 2.50 0.35 2.86 2.90 1.54 0.79 0.60 3.09 1.46 1.52 1.49 1.82 1.69 1.68 0.59 0.65 Brasília 62 1.10 0.00 0.67 2.66 2.49 0.00 0.00 0.00 0.57 3.19 0.00 0.00 0.00 1.48 0.00 1.45 1.53 3.94 1.26 8.59 2.40 0.53 3.33 4.99 1.37 2.78 1.95 1.74 1.20 1.93 0.86 1.72 Belém 41 1.08 1.69 0.86 0.00 3.04 0.00 1.61 1.76 4.48 1.47 1.79 0.00 1.52 3.18 1.30 0.00 2.55 2.40 4.60 3.15 1.05 0.00 3.01 2.43 4.00 1.06 1.02 0.76 0.68 0.00 0.74 1.26 Campo Grande 19 1.07 0.00 0.00 9.04 0.00 0.00 0.00 0.00 0.00 0.00 0.00 0.00 0.00 0.00 0.00 0.00 5.80 2.72 5.60 0.00 0.00 0.00 2.42 0.00 0.00 1.75 1.88 6.28 1.15 3.64 0.00 2.22 sour ce: P repar ed b
y the author with data fr
om the M or tality information system ( si M), M inistr Y o F H eal t H B razil, d ata sus . ar : age-standar diz
ed ( per million inhabitants). geographic r
egions and selected states and capitals.
Table 1.
sour
ce: P
repar
ed b
y the author with data fr
om the M or tality information system ( si M), M inistr Y o F H eal t H B razil, d ata sus . 163 - M
alignant neoplasm of pleura (163.0 - The parietal pleura; 163.1 - The visceral pleura; 163.8 -
o
ther; 163.9 - The pleura);
c
38.4 P
leura;
c
45.0 M
esothelioma of the pleura;
c
45.1 M
esothelioma of the peritoneum;
c
45.2
M
esothelioma of the pericar
dium; c 45.7 M esothelioma of o ther locati; c 45.9 M esothelioma ne ; c
45.X- all malignant mesotheliomas.
Table 2.
Distribution of deaths from pleural cancer and mesothelioma by gender
, Brazil, 1980- 2010 Diagnosis 1980 1981 1982 1983 1984 1985 1986 1987 1988 1989 1990 1991 1992 1993 1994 1995 1996 1997 1998 1999 2000 2001 2002 2003 2004 2005 2006 2007 2008 2009 2010 Total
163 - Malignant neoplasm of pleura
50 62 55 71 58 58 80 80 87 83 85 84 88 100 94 103 1.238 C38.4 Pleura 77 95 89 89 77 92 101 107 121 110 96 129 118 94 109 1.504
C45.0 Mesothelioma of the pleura
11 25 18 15 22 14 33 21 18 32 30 21 28 23 32 343
C45.1 Mesothelioma of the peritoneum
8 6 6 2 6 7 8 11 4 11 17 17 13 12 15 143
C45.2 Mesothelioma of the pericardium
0 0 0 0 1 0 0 1 1 1 0 0 2 0 1 7
C45.7 Mesothelioma of other locati
1 3 6 4 8 2 4 6 2 6 8 4 3 2 4 63 C45.9 Mesothelioma NE 24 20 24 24 20 25 30 33 30 24 31 37 35 30 33 420 C45.X 44 54 54 45 57 48 75 72 55 74 86 79 81 67 85 976 163+c45 50 62 55 71 58 80 80 87 83 85 84 88 100 94 103 44 54 54 45 57 48 75 72 55 74 86 79 81 67 85 2.156 163 + c384 50 62 55 71 58 80 80 87 83 85 84 88 100 94 103 77 95 89 89 77 92 101 107 121 110 96 129 118 94 109 2.684 163+c384+c45 50 62 55 71 58 58 80 80 87 83 85 84 88 100 94 103 121 149 143 134 134 140 176 179 176 184 182 208 199 161 194 3.718 Men
163 - Malignant neoplasm of pleura
23 38 32 33 32 30 46 45 44 43 47 53 48 54 55 52 675 C38.4 Pleura 44 47 45 42 35 42 46 54 54 56 47 57 57 43 47 716
C45.0 Mesothelioma of the pleura
4 14 14 6 16 9 23 12 10 20 19 11 21 12 18 209
C45.1 Mesothelioma of the peritoneum
3 2 2 2 1 2 3 3 1 3 5 5 8 6 5 51
C45.2 Mesothelioma of the pericardium
0 0 0 0 1 0 0 1 1 1 0 0 1 0 1 6
C45.7 Mesothelioma of other locati
1 1 5 4 2 0 2 4 1 4 5 2 2 0 3 36 C45.9 Mesothelioma NE 16 15 12 17 11 15 18 26 19 12 26 19 22 22 18 268 C45.X 24 32 33 29 31 26 46 46 32 40 55 37 54 40 45 570 163+c45 23 38 32 33 30 46 45 44 43 47 53 48 54 55 52 24 32 33 29 31 26 46 46 32 40 55 37 54 40 45 1.213 163 + c384 23 38 32 33 30 46 45 44 43 47 53 48 54 55 52 44 47 45 42 35 42 46 54 54 56 47 57 57 43 47 1.359 163+c384+c45 23 38 32 33 32 30 46 45 44 43 47 53 48 54 55 52 68 79 78 71 66 68 92 100 86 96 102 94 111 83 92 1.961 W omen
163 - Malignant neoplasm of pleura
27 24 23 38 26 28 34 35 43 40 38 31 39 46 39 50 561 C38.4 Pleura 32 48 44 47 42 50 55 53 67 54 49 72 61 51 62 787
C45.0 Mesothelioma of the pleura
7 11 4 9 6 5 10 9 8 12 11 10 7 11 14 134
C45.1 Mesothelioma of the peritoneum
5 4 4 0 5 5 5 8 3 8 12 12 5 6 10 92
C45.2 Mesothelioma of the pericardium
0 0 0 0 0 0 0 0 0 0 0 0 1 0 0 1
C45.7 Mesothelioma of other locati
0 2 1 0 6 2 2 2 1 2 3 2 1 2 1 27 C45.9 Mesothelioma NE 8 5 12 7 9 10 12 7 11 12 5 18 13 8 15 152 C45.X 20 22 21 16 26 22 29 26 23 34 31 42 27 27 40 406 163+c384+c45 27 24 23 38 28 34 35 43 40 38 31 39 46 39 50 52 70 65 63 68 72 84 79 90 88 80 114 88 78 102 1.728 163 + c384 27 24 23 38 28 34 35 43 40 38 31 39 46 39 50 32 48 44 47 42 50 55 53 67 54 49 72 61 51 62 1.322 163+c384+c45 27 24 23 38 26 28 34 35 43 40 38 31 39 46 39 50 52 70 65 63 68 72 84 79 90 88 80 114 88 78 102 1.754
DIsCUssION
Mortality rates from mesothelioma in Brazil during the study period are lower than other countries where asbestos exposure occurred. Thus, it is believed that there is a sub record of the disease in Brazil.
delgermaa et al.16 studied deaths from malignant mesothelioma related to 83 countries in the database of the WHo mortality rates between the years of 1994 and 2008, had a gross rate and a mortality rate adjusted for age of 6.2 and 4.9 deaths per million population, respectively. considering the countries analyzed separately, the authors found that the uK had the highest mortality rate adjusted per age, namely 17.8 deaths per million, followed by australia with 16.5 deaths per million, and italy with 10.3 deaths per million.
underreporting is a common problem when dealing with the case of rare diseases difficult to diagnose16. Park et al.17 globally estimate a case of mesothelioma is neglected for four to five reported cases. aguilar-Madrid et al.18 found only 7 deaths with malignant pleural mesothelioma recorded as the underlying cause of death in a total of 24 cases of the disease in a case-control study. lilienfeld et al.19, in Minnesota, between the years of 1969 and 1971, estimated an underestimation of the number of cases in 4-8 times its actual occurrence, considering the erroneous coding of the disease on death certificates. also camidge et al.20 reported the dispersion of cases of mesothelioma in a variety of other diagnostic analyzing data from scotland. Pedra et al.21 in a preliminary analysis of data from a study with 46 medical records of patients whose underlying cause of death was recorded as pleural cancer during the period of 1996 to 2006 identified an undercount of 13% of malignant mesothelioma.
Moreover, the high percentage of unspecified malignant mesotheliomas (43,03%) is suggestive of huge limitations in the country to perform the proper diagnosis of this tumor. another issue worth mentioning is the fact that malignant mesothelioma received only a specific code, namely the c45, in the 10th version of the icd-10, which was implemented in Brazil in 1996. Many countries, however, have not implemented this new classification yet, still in effect for such the 9th version of the icd, which does not include an encoding itself for malignant mesothelioma7. The use of different forms of disease classification hinders comparisons between countries.
Based on the results, it was seen that the distribution of deaths by age is consistent with the natural history of this long latency disease: the majority of deaths as well as rising rates of mortality occurred in groups of 50 years old or above. The same upward trend was verified by
lópez-abente et al.15 in a study in spain on mortality from pleural cancer, covering the period of 1976-2010, which also used the sum of codes 163 of icd-9, c38.4 (Malignant neoplasm of pleura) and c45.0 (Malignant Mesothelioma of the pleura). However, unlike our study, the author noted a downward trend in the younger age groups. The high mortality rate in people younger than 49 years old was a finding not expected in our study.
in italy, among the 15,845 cases analyzed from the national registry of Mesotheliomas occurring between 1993 and 2008, it was found that the median time elapsed between exposure and diagnosis was of 46 years5.
The southeast and southern regions were those that focused most mesothelioma mortality. in the study by luna et al.22, we saw that this same distribution applies to hospitalizations by disease and by expenses with patients because of the 4,264 hospital admissions between 1995 and 2007 - 43% and 29%, occurred in these regions, respectively. to the authors, this fact is directly related to the work process, as well as better access and encourages the health system and the health of workers in these regions, expressed by the greater presence and amount of specialized centers for the care worker health.
We notice that the Midwest region had a limited number of mesothelioma deaths in relation to the expected. This finding is probably underestimated, since the only asbestos mine in Brazil is currently functioning in Minaçu-Goiás.
Mortality from mesothelioma in women in Brazil can be considered low compared to that found in other countries. For example, the male: female ratio observed in this study corresponded to 1.12:1. delgermaa et al.16 observed the male: female of 3.6:1 in the uK and in australia and italy, this ratio was 5.7:1, 5.4:1, and 2.4:1, respectively.
Worldwide, the male: female ratio reflects occupational exposure to asbestos in men. However, in the case of Brazil, the similarity of the incidence and mortality between the genders suggests that both have environmental exposure to asbestos. it is also likely that there are many women occupationally exposed, but also that there is household exposure.
CONClUsION
Mortality statistics by mesothelioma in Brazil for the analyzed period probably does not reflect the true magnitude of the problem. accordingly, the shares of early identification of asbestos exposure, improvement of diagnostic techniques, training of professionals for the correct completion of death certificates and the surveillance of the tumor itself should be improved.
CONTRIBUTIONs
Francisco Pedra and Patricia de oliveira da silva participated in all the steps of the writing process for the paper, including data collection and consolidation. inês e. Mattos and Hermano castro were involved in literature revision and writing and in the critical appraisal of the paper.
Conflict of Interests: the Authors Declare no Conflict of Interests.
RefeReNCes
1. Robinson BWS, Musk AW, Lake RA. Malignant mesothelioma. Lancet. 2005 Jul 30;366(9483):397-408. 2. International Agency for Research on Cancer. IARC
monographs on the evaluation of Carcinogenic risks to humans [Internet]. Lyon: International Agency for Research on Cancer; 2012. [acesso em 2014 Jan 30]. Disponível em: http://monographs.iarc.fr/ENG/ Monographs/vol100C/index.php.
3. Magnani C, Agudo A, González CA, Andrion A, Calleja A, Chellini E, et al. Multicentric study on malignant pleural mesothelioma and non-occupational exposure to asbestos. Br J Cancer. 2000 Jul;83(1):104-11. 4. Ferrante D, Bertolotti M, Todesco A, Mirabelli D,
Terracini B, Magnani C. Cancer mortality and incidence of mesothelioma in a cohort of wives of asbestos workers in Casale Monferrato, Italy. Environ Health Perspect. 2007 Oct;115(10):1401–5.
5. Marinaccio A, coordenador. Il Registro Nazionale dei Mesoteliomi (ReNaM) [Internet]. Milanno: INAIL; 2012. [acesso em 2014 set 24]. Disponível em: http:// www.inail.it/internet_web/wcm/idc/groups/internet/ documents/document/ucm_085815.pdf.
6. Pinheiro GA, Antao VCS, Bang KM, Attfield MD. Malignant mesothelioma surveillance: a comparison of ICD 10 mortality data with SEER incidence data in nine areas of the United States. Int J Occup Environ Health. 2004 Sep;10(3):251–5.
7. Stayner L, Welch LS, Lemen R. The Worldwide Pandemic of Asbestos-Related Diseases. Annu Rev Public Health. 2013;34:205–16.
8. Erb CT, Johnson KM, Kim AW. Rare Pleural Tumors. Clin Chest Med. 2013 Mar;34(1):113–36.
9. Scherpereel A, Astoul P, Baas P, Berghmans T, Clayson H, de Vuyst P, et al. Guidelines of the European Respiratory Society and the European Society of Thoracic Surgeons for the management of malignant pleural mesothelioma. Eur Respir J. 2010 Mar;35(3):479–95.
10. Pereira AG. Sumário Mineral 2012: Crisotila-amianto [Internet]. Brasília,DF: Departamento Nacional de Produção Mineral; 2012. [acesso em 2014 Jan 28]. Disponível em: https://sistemas.dnpm.gov.br/publicacao/ mostra_imagem.asp?IDBancoArquivoArquivo=7383.
11. Sznelwar JJ, Scalabrin R. Produto 25: Crisotila [Internet]. [Brasília, DF]: Ministério de Minas e Energia (BR), Banco Mundial; 2009 Ago. Relatório técnico No.: 35. Contrato No.: 48000.003155/2007-17. [acesso em 13 Nov 15]. Disponível em: http://www.mme.gov.br/sgm/ galerias/arquivos/plano_duo_decenal/a_mineracao_ brasileira/P25_RT35_Perfil_da_Crisotila.pdf.
12. Kazan-Allen L. 2012. Current Asbestos Bans and Restrictions [Internet]. [London]: International Ban Asbestos Secretariat; 2014 Jan 27. [acesso em 2014 Jan 28]. Disponível em: http://www.ibasecretariat.org/ alpha_ban_list.php.
13. Becklake MR, Bagatin E, Neder JA. Asbestos-related diseases of the lungs and pleura: uses, trends and management over the last century. Int J Tuberc Lung Dis. 2007 Apr;11(4):356–69.
14. Pedra F, Tambellini AT, Pereira BB, Costa AC, Castro HA. Mesothelioma Mortality in Brazil, 1980–2003. Int J Occup Environ Health. 2008 Sep;14(3):170–5. 15. López-Abente G, García-Gómez M, Menéndez-Navarro
A, Fernández-Navarro P, Ramis R, García-Pérez J, et al. Pleural cancer mortality in Spain: time-trends and updating of predictions up to 2020. BMC Cancer. 2013;13:528.
16. Delgermaa V, Takahashi K, Park EK, Vinh Le G, Hara T, Sorahan T. Bulletin of the World Health Organization: global mesothelioma deaths reported to the World Health Organization between 1994 and 2008 [Internet]. Geneve: Who; 2011 Jun 13. [acesso em 2013 Nov 23]. Disponível em: http://www.who.int/bulletin/ volumes/89/10/11-086678/en/
17. Park E-K, Takahashi K, Hoshuyama T, Cheng T-J, Delgermaa V, Le GV, et al. Global Magnitude of Reported and Unreported Mesothelioma. Environ Health Perspect. 2011 Apr;119(4):514–8.
18. Aguilar-Madrid G, Robles-Pérez E, Juárez-Pérez CA, Alvarado-Cabrero I, Rico-Méndez FG, Javier K-G. Case-control study of pleural mesothelioma in workers with social security in Mexico. Am J Ind Med. 2010 Mar;53(3):241–51.
19. Lilienfeld DE, Gunderson PD. The “missing cases” of pleural malignant mesothelioma in Minnesota, 1979-81: preliminary report. Public Health Rep. 1986 Aug;101(4):395–9.
20. Camidge DR, Stockton DL, Bain M. Factors affecting the mesothelioma detection rate within national and international epidemiological studies: insights from Scottish linked cancer registry-mortality data. Br J Cancer. 2006 Sep 4;95(5):649–52.
21. Pedra F, Castro HA, Mattos IE, Silva PO. Mortalidade por mesotelioma no RJ/RJ: medindo e localizando o sub-registro desses óbitos. Anais do VIII Congresso Brasileiro de Epidemiologia; 2011 Nov 12-16; São Paulo, Brasil. São Paulo: Abrasco; 2011.
22. Luna CA, Martins FP, Chibante AMS, Castro HA. Estimativa de Custo das Internações Hospitalares por Mesotelioma no Brasil. Cad Bras Med. 2013 Dez;26(1-4):35-44.
Resumo
Introdução: o mesotelioma é um câncer cuja incidência vem aumentando em todo o mundo como resultado, sobretudo, da exposição ao amianto. o Brasil ainda é um grande produtor e consumidor dessa fibra. Objetivo: o objetivo deste trabalho é descrever a distribuição da mortalidade por mesotelioma no Brasil no período de 1980 a 2010. Método: Foi realizado estudo descritivo ecológico, com análise descritiva dos dados. utilizaram-se registros do sistema nacional de informações sobre Mortalidade do datasus. Resultados: Foram encontrados 3.718 óbitos por mesotelioma; a maioria (2.180) ocorreu na região sudeste. Houve um equilíbrio na mortalidade entre homens e mulheres mostrando uma razão de 1,12:1 e 80,7% das mortes atingiram a faixa etária de maiores de 50 anos. as taxas de mortalidade padronizadas por idade aumentaram de 0,64 óbitos por milhão de habitantes em 1980 a 1,18 óbitos por milhão de habitantes em 2002. Conclusão: as estatísticas de mortalidade por mesotelioma no Brasil são baixas, e não correspondem ao volume da produção e do uso do amianto em nosso país podendo não refletir a real magnitude da doença.
Palavras-chave: Mesotelioma/epidemiologia; asbestos/envenenamento; neoplasias; Vigilância sanitária ambiental; Brasil
Resumen
Introducción: el mesotelioma es un cáncer cuya incidencia está aumentando en todo el mundo, como resultado sobre todo a la exposición al asbesto. Brasil aún es un importante productor y consumidor de la fibra. Objetivo: el objetivo de este trabajo es describir la distribución de la mortalidad por mesotelioma en Brasil durante el período 1980-2010 Método: se realizó un estudio descriptivo ecológico con el análisis descriptivo de los datos. se utilizaron los registros del sistema nacional de informaciones sobre mortalidad del datasus. Resultados: se encontraron 3.718 muertes por mesotelioma; la mayoría (2.180) se produjo en el sudeste. Hubo un equilibrio en la mortalidad entre los hombres y las mujeres que muestran una proporción de 1,12: 1; y el 80,7 % de las muertes ocurrió a la edad de más de 50 años. las tasas de mortalidad estandarizadas por edad aumentaron de 0,64 muertes por millón de habitantes en 1980 a 1,18 muertes por millón de habitantes en 2002. Conclusión: las estadísticas de mortalidad por mesotelioma en Brasil son bajas y no corresponden al volumen de producción ni al uso de asbesto en el país, lo que puede no reflejar la verdadera magnitud de la enfermedad.
Palabras clave:Mesotelioma/epidemiologia; asbestos/envenenamento; neoplasias, Vigilancia sanitaria ambiental;