Pedro Emanuel
Ferreira dos Reis Vieira
Amino acid toxicity in Zebrafish
Toxicidade de aminoácidos em Peixe-zebra
Pedro Emanuel
Ferreira dos Reis Vieira
Amino acid toxicity in Zebrafish
Toxicidade de aminoácidos em Peixe-zebra
Dissertação apresentada à Universidade de Aveiro para cumprimento dos requisitos necessários à obtenção do grau de Mestre em Biologia Aplicada ramo Biologia Molecular e Celular, realizada sob a orientação científica do Professor Doutor Manuel António da Silva Santos, Professor Associado do Departamento de Biologia da Universidade de Aveiro
o júri
presidente Professor Doutor António José Arsénia Nogueira
Professor associado com agregado do Departamento de Biologia da Universidade de Aveiro
Doutora Ana Raquel Mano Soares
Investigadora de pós-doutoramento do Departamento de Biologia da Universidade de Aveiro
Doutor Paulo Jorge Travessa Gavaia
Investigador auxiliar do CCMAR da Universidade do Algarve
Professor Doutor Manuel António da Silva Santos
agradecimentos O maior agradecimento vai para a minha fantástica mãe, por me ter dado a oportunidade de ter chegado tão longe, de me apoiar, incentivar e me permitir ser a pessoa que sou hoje. Muito obrigado mãe.
Também gostaria de agradecer ao Professor Manuel Santos, por me ter acolhido no seu laboratório onde pude realizar este trabalho e por todos os ensinamentos que me transmitiu.
Um especial agradecimento a duas pessoas, as minhas “co-orientadoras”, a Marisa e a Ana. Obrigado Marisa por me teres aturado este ano, pelo acompanhamento de cada segundo do meu trabalho, por me guiares e por todos os ensinamentos. Obrigado Ana, por toda a ajuda nas últimas semanas, por teres exigido de mim duzentos por cento, por quereres sempre mais e melhor. Obrigado às duas.
Também gostaria de agradecer à Violeta pela sua paciência pelas infinitas horas que passei a chatea-la a pedir material, pela companhia e pelos seus ensinamentos.
Não podia esquecer todos os colegas e amigos do laboratório que me proporcionaram bons momentos, pelo ensinamento e pela ajuda.
Também gostaria de agradecer ao Doutor Paulo pela sua ajuda no meu trabalho.
Não poderia esquecer a minha namorada Sofia pela sua paciência e apoio. Pelas longas horas que passou a ouvir-me falar de trabalho e mais trabalho e no fim ainda me incentivar a fazer mais e melhor. Obrigado.
Por fim, não poderia esquecer de agradecer à minha família e aos meus amigos por todo o apoio, força e compreensão que tiveram comigo, e me permitiu concluir este trabalho.
palavras-chave Desequílibrio nutricional, aminoácidos, toxicidade, peixe-zebra
resumo As proteínas são sintetizadas através do mecanismo de tradução e são
constituídas por aminoácidos. Além de serem as unidades básicas das proteínas, os aminoácidos também desempenham outras funções importantes na célula, tais como sinalização ou regulação do crescimento celular. No entanto, em excesso, os aminoácidos podem ser tóxicos, embora o mecanismo de toxicidade não esteja claro. Neste estudo, usámos o peixe-zebra como modelo vertebrado para avaliar a toxicidade induzida por diferentes aminoácidos como resultado do desiquílibrio nutricional. Para tal, avaliámos as alterações induzidas pela toxicidade de aminoácidos durante o desenvolvimento do peixe-zebra, para compreender se esta toxicidade podia estar relacionada com a incorporação errada de aminoácidos durante a tradução. Os resultados mostram que alguns dos aminoácidos causam toxicidade em peixe-zebra, nomeadamente, triptofano, glutamina, L-fenilalanina e L-arginina. Para entender se esta toxicidade pode ser causada pela produção de proteínas aberrantes, devido ao carregamento errado de aminoácidos no tRNA, resultante de um excesso de aminoácidos, analisámos a activação de vias de degradação de proteínas. Para isso realizámos análises por western blot do estado de poliubiquitinação do proteoma. Não foram observadas diferenças entre as diferentes concentrações de aminoácidos e do controlo, indicando que a via da ubiquitina-proteossoma não está directamente relacionada com a toxicidade de aminoácidos observada.
keywords Nutritional imbalance, amino acids, toxicity, zebrafish
abstract Proteins are synthetized through the mechanism of translation and are constituted by amino acids. Besides being the basic units of proteins, amino acids also play other important roles in the cell such as signaling or regulation of cell growth. However, in excess, amino acids can be toxic, although the mechanism of toxicity is still not clear. In this study we used zebrafish as a vertebrate model to assess the toxicity induced by different amino acids as a result of nutritional imbalance. Moreover, we evaluated the changes induced by amino acid toxicity during zebrafish development in order to understand if this toxicity could be related with wrong incorporation of mischarged amino acids during translation. The results show that some of the canonical amino acids cause high toxicity in zebrafish, namely tryptophan, glutamine, L-phenylalanine and L-arginine. To understand if this toxicity could be caused by the production of aberrant proteins, due to tRNA mischarging, result of an unbalanced amino acid pool, we analyzed the activation of protein degradation pathways. For this we did western blot analysis of the poliubiquitination state of the proteome. No differences were observed between different amino acid concentrations and the control indicating that the ubiquitin-proteasome pathway is not directly correlated with the amino acid toxicity observed.
1 TABLE OF CONTENTS Table of contents ... 1 List of figures ... 3 Abbreviations ... 5 1. Introduction ... 7
1.1. The genetic code ... 9
1.2. Translation ... 11
1.3. The operational RNA code: tRNAs and aaRSs ... 13
1.3.1. tRNAs ... 13
1.3.2. aaRSs ... 14
1.4. Amino acids: building blocks of proteins ... 18
1.5. Classification and characteristics of the 20 canonical amino acids... 20
1.5.1. Nonpolar amino acids ... 20
1.5.2. Polar, uncharged amino acids ... 20
1.5.3. Positively charged (basic) amino acids ... 21
1.5.4. Negatively charged (acidic) amino acids ... 21
1.6. Specialized roles of amino acids ... 23
1.7. Amino acid toxicity ... 24
1.8. Zebrafish as a model ... 26
1.9. Aims ... 28
2. Materials and methods ... 29
2.1. Amino acid assay on zebrafish embryos ... 31
2.1.1. Zebrafish maintenance ... 31
2.1.2. Egg collection ... 31
2.1.3. Amino acid solutions ... 32
2.1.4. Embryo observation ... 32
2.1.5. Statistical analysis ... 33
2.2. Embryo skeletal evaluation of deformities ... 34
2.2.1. Sample Collection and Fixation ... 34
2.2.2. Cartilage staining ... 34
2
2.3.1. Protein extraction ... 35
2.3.2. Western blot ... 35
3. Results ... 37
3.1. Phenotypic effects of amino acid exposure ... 39
3.1.1. Nonpolar amino acids ... 41
3.1.2. Polar amino acids ... 46
3.1.3. Basic and acidic amino acids ... 47
3.1.4. Small amino acids, a different approach ... 49
3.2. Cartilage damage by amino acid exposure ... 61
3.3. Quantification of ubiquitin as a tool for acessing misfolded proteins ... 63
4. Discussion ... 67
4.1. Amino acid toxicity is not related with their R group ... 69
4.2. Possible mechanisms of amino acid toxicity ... 71
Conclusions ... 75
Future perspectives ... 75
5. References ... 77
3
LIST OF FIGURES
Figure 1 - The Genetic Code.. ... 10
Figure 2 - The Central Dogma of Molecular Biology.. ... 11
Figure 3 - Protein synthesis. ... 12
Figure 4 - The structure and domains of tRNA. ... 14
Figure 5 - Fidelity of protein synthesis.. ... 15
Figure 6 – tRNA aminoacylation.. ... 17
Figure 7 – General structure of an amino acid. ... 19
Figure 8 - The four groups of the twenty amino acids that constitute proteins. ... 22
Figure 9 – Structure of protein amino acids and analogues. ... 25
Figure 10 – Adult zebrafish ... 27
Figure 11 - Effects of L-tryptophan on survival, edema formation and malformation rate. ... 42
Figure 12 - Embryos exposed to L-tryptophan.. ... 43
Figure 13 - Effects of L-phenylalanine on survival, hatching, growth rate and edema formation. ... 44
Figure 14- Embryos exposed to L-phenylalanine.. ... 45
Figure 15 - Survival rate after L-glutamine treatment. ... 46
Figure 16 - Survival rate after L-arginine treatment... 47
Figure 17 - Effects of L-lysine, L-aspartic acid and L-glutamic acid on hatching rate.. ... 48
4
Figure 19 - Embryos exposed to L-alanine show increased incidence of malformations ... 52
Figure 20 - Effects of L-glycine on survival, hatching and normal development. ... 53
Figure 21 - Embryos exposed to L-glycine show increased incidence of malformations. ... 54
Figure 22 - Effects of L-proline on survival, hatching and normal development. ... 55
Figure 23 - Embryos exposed to L-proline show increased incidence of malformations. ... 56
Figure 24 - Effects of L-serine on survival, hatching and normal development. ... 57
Figure 25 - Embryos exposed to L-serine show increased incidence of malformations. ... 58
Figure 26 - Effects of L-valine on survival, hatching and normal development. ... 59
Figure 27 - Embryos exposed to L-valine show increased incidence of malformations. ... 60
Figure 28 – Lateral view of the head of a normal larva between 5 and 6 days, showing the jaw and the branchial arches. ... 61
Figure 29 – Lateral view of the head of embryos at 120 hpf exposed to 350 mM of small amino acids. ... 62
Figure 30 - Western Blot for ubiquitin and β – tubulin.. ... 64
Figure 31 – Effects of the 20 canonical amino acids on survival and abnormal phenotypes. .. 92
Figure 32 - Embryos exposed to 5 mM of L-tryptophan. ... 93
5
ABBREVIATIONS
% Percent
µg Micrograms
µL Microliter
AMP Adenosine monophosphate aaRS Aminoacyl-tRNA synthetase ATP Adenosine triphosphate CaCl2 Calcium chloride
Cl Chloride
DNA Deoxyribonucleic acid Dpf Days pos fertilization
g Grams
h Hours
H2O Water
HCl Hydrochloric acid Hpf Hours pos fertilization KCl Potassium chloride KOH Potassium hydroxide
L Liter M Molar mA Microamperes ml Mililiter mM Milimolar mmoles Milimoles
mRNA Messenger RNA
NaCl Sodium chloride NaOH Sodium hydroxide
ºC Celsius
PAA Polyacrylamide
6
RNA Ribonucleic acid
rpm Revolutions per minute
TBS Tris buffered saline (0.5 M Tris base; 9% NaCl; pH 8.4) tRNA Transfer RNA
7
9
1.1. THE GENETIC CODE
In all living organisms the genetic information is stored as DNA in the form of genes and this information is transcribed into mRNA. The mRNA is then used as a template for protein synthesis. This means that the information contained in DNA is directly related to proteins and this direct relationship is assured by the genetic code (Crick, 1970).
The genetic code was established in the 1960s and is a universal algorithm that relates nucleotide triplets in genes and mRNAs with proteins, being present in the three kingdoms of life - archae, bacteria and eukarya (Crick, 1970; Schimmel, 2008). The combination of triplets of the 4 ribonucleosides (adenosine, uridine, guanosine, cytidine) results in 64 different codons. From these, only sixty-one encodes for the twenty canonical amino acids and three constitute stop codons. In eukaryotes, only one codon (AUG) initiates the protein synthesis, which codes for methionine. This code is non-overlapping and each codon codes for only one amino acid (Agris, 2004; Schimmel et al., 1993).
Some amino acids are specified by only one codon, namely methionine (AUG codon) or tryptophan (UGG codon), but the remaining amino acids are encoded by more than one codon. For example, phenylalanine is encoded by two-codon sets, isoleucine is encoded by three codons, alanine by four codons, while serine is encoded by six different codons (Figure 1) (Agris, 2004).
10
Figure 1 - The Genetic Code. The 61 codons for the 20 amino acids and three codons for the translational stop signals. Codon boxes with white backgrounds contain four codons for one amino acid and codon boxes with shaded backgrounds contain codons for more than one amino acid, or an amino acid plus stop codons.
Adapted from (Agris, 2004).
The distribution of the amino acids over the genetic code shows an association between codons and amino acid polar properties. Codons encoding amino acids with similar chemical properties tend to be related. For example, codons with a U at the second position code for five of the most hydrophobic amino acids, namely phenylalanine, leucine, isoleucine, methionine and valine. Six of the most hydrophilic amino acids, namely histidine, glutamine, asparagine, lysine, arginine and glycine have an A at the second codon position. Moreover, the acidic amino acids aspartic acid and
glutamic acid that belong to a split codon family in which their amine derivates
asparagine and glutamine belong to codon families that only differ in the first codon position (Woese, 1965; Woese et al., 1966). Why an amino acid is encoded by a specific codon or evolved in such a manner is unknown. However, it is likely that its biased codon organization and redundancy may minimize decoding error and consequently, minimize the impact of such error on the proteome (Schimmel, 2008; Schimmel et al., 1993).
11
1.2. TRANSLATION
The genetic code is assured by three basic mechanisms of life (Figure 2): DNA replication, transcription and translation. DNA replication preserves and transmits the DNA information from the mother to the daughter cell. During transcription, a complementary RNA copy of the genetic information (mRNA) is created from DNA. Then the mRNA is used as a template and translated into protein in the ribosome (Antonellis and Green, 2008; Cochella and Green, 2005).
Figure 2 - The Central Dogma of Molecular Biology. The genetic information in DNA is transcribed into mRNA by RNA polymerase, followed by translation of the mRNA molecule and synthesis of proteins carried out in the ribosome.
Adapted from (Berg et al., 2002)
During translation, ribosomes in conjunction with tRNA, amino acids, translational factors and aminoacyl-tRNA synthetases (aaRSs), read the mRNA message and produce protein products according to the instructions written in that message. Ribosomes contain three tRNA binding sites, the aminoacyl site (A site), peptidyl site (P site) and exit site (E site), all of which contribute to quality control of mistranslation (Kapp and Lorsch, 2004).
The translation process can be divided into three phases: initiation, elongation and termination (Figure 3). In eukaryotes, translation initiation involves the positioning of an elongation-competent 80S ribosome at the initiation codon (AUG) which indicates the ORF (open reading frame). The small (40S) ribosomal subunit initially binds to the 5′ end of the mRNA and scans it in the 5′→3′ direction until the initiation codon is identified. The large (60S) ribosomal subunit then joins the 40S subunit at this position to form the catalytically competent 80S ribosome (Agris, 2004; Gebauer and Hentze, 2004).
12
During elongation, the ribosome moves along the mRNA, towards its 3’-end, assembling amino acids after reading codons. The aminoacyl-tRNA binds to the cognate codon in the ribosome forming anticodon-codon interactions. During initial selection, aminoacyl-tRNAs bind the A site (except the initiator aminoacyl-tRNA, always methionine in eukaryotes, which binds to the P site). Then, the α-amino group of the aminoacyl-tRNA (in A site) attacks the carbonyl carbon of the P site peptidyl-tRNA, and a peptide bond is formed. The A site then contains the peptidyl-tRNA, which is one amino acid longer, and a deacylated tRNA is left in the P site. The ribosome then translocates one codon along the mRNA, moving the newly deacylated tRNA into the E site, the peptidyl-tRNA from the A site to the P site, and leaving the A site free to accept the next incoming aminoacyl-tRNA (Gebauer and Hentze, 2004; Kapp and Lorsch, 2004).
Termination of protein synthesis occurs when one stop codon is present in the A site. This leads to the release of the completed polypeptide followed by the hydrolysis of the ester bond that links the polypeptide chain to the P site of the deacylated tRNA (Hoshino et al., 1999).
Figure 3 - Protein synthesis. The three stages of mRNA translation in eukaryotes (initiation, elongation and termination). The ORF is indicated by a blue rectangle with the AUG start codon and a stop codon (UGA), untranslated regions are shown as black, the ribosomal subunits (40S and 60S) are indicated in green and the growing (or released) polypeptide in red.
13
1.3. THE OPERATIONAL RNA CODE: tRNAs AND aaRSs
The ribosome has the capacity to discriminate between correct and incorrect codon–anticodon interactions. Most tRNAs that enter in the A site fail to form three base pairs with the displayed codon and the tRNA rapidly dissociates. Therefore, in this process only cognate tRNAs are efficiently retained (Reynolds et al., 2010). However, the ribosome cannot identify misacylated tRNAs and consequently, translation accuracy strongly relies on aminoacylation specificity, that correlates amino acids to specific structural features located in tRNAs structure by the aaRSs (Agris, 2004; Gebauer and Hentze, 2004; Reynolds et al., 2010).
1.3.1. tRNAs
tRNAs provide the link between the codons that constitute the mRNA and the amino acids. They are charged with an amino acid by aaRSs. This amino acid will be
incorporated into the growing polypeptide that is being synthesized during translation.
tRNAs are grouped in families of isoacceptors, which are tRNA species that are recognized by a single aaRS, but decode different codons (Cusack, 1997; Sprinzl and Vassilenko, 2005).
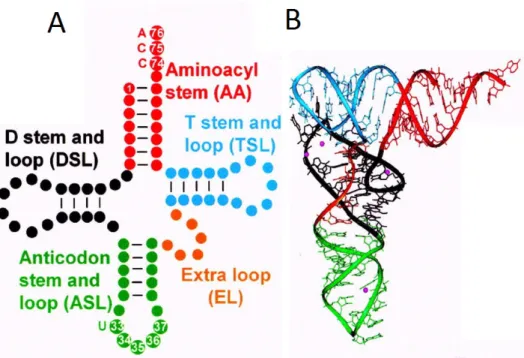
All tRNAs share a common secondary structure represented by a cloverleaf-like structure (Figure 4A). This structure consists of four base-paired stems defining three stem-loops – the D loop, the anticodon loop and the T loop – and the acceptor stem with the 3’ single stranded CCA end, to which amino acids are added in the charging step. The number of nucleotides in the stem and loop regions is conserved and can therefore be referenced by a standard number. tRNAs also have a variable or extra region between the anticodon and the T loops.
The tRNAs also assume a L-shaped three-dimensional structure (Figure 4B). This shape maximizes stability by lining-up the base pairs in the D stem with those in the anticodon stem and the base pairs in the T stem with those in the acceptor stem, thus defining two functional domains. One will interact with the mRNA template and the other with the amino acid, being the two domains at opposite ends of the tRNA (Agris, 2004; Phizicky and Hopper, 2010).
14
1.3.2. aaRSs
There are twenty different aaRSs, one for each amino acid and tRNA family. They can distinguish between different tRNA families and charge the correspondent tRNA with the cognate amino acid (Hopper et al., 2010; Zhou et al., 2011).
The aminoacylation of the tRNA is highly specific and involves a two-step reaction. The amino acid is first activated by ATP when the carboxyl group in the amino acid is attached to the phosphoryl group of AMP, forming an aminoacyl adenylate intermediate. Once activated, the amino acid is transferred to the 3′ end of its corresponding tRNA molecule, with release of the final product, aminoacyl-tRNA, which will be used in protein synthesis (de Pouplana and Schimmel, 2001; Schimmel et al., 1993).
The basic reaction is:
1. ATP + amino acid + aaRS→ aaRS: aminoacyl adenylate + PPi
2. tRNA + aaRS: aminoacyl adenylate → aaRS + aminoacyl-tRNA + AMP
Figure 4 - The structure and domains of tRNA. The secondary dimensional structure of tRNA is represented on the left and the tertiary structure in the right.
15
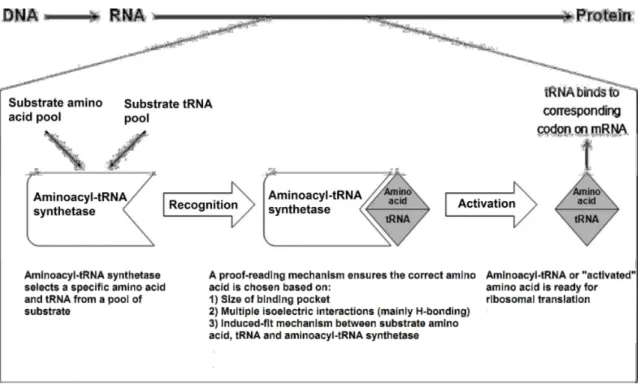
Because the reactions require the capacity to recognize and discriminate tRNAs as well as small chemicals such as amino acids and ATP, the structures of aaRSs are well equipped for interacting with diverse molecules and are highly specific (Figure 5) (Hausmann and Ibba, 2008; Park et al., 2008; Yuan et al., 2008).
Figure 5 - Fidelity of protein synthesis. The aaRSs select the amino acids and tRNAs from the pool of substrate and form the aminoacyl-tRNA complex through proof-reading mechanisms.
Adapted from (Rodgers and Shiozawa, 2008)
Generally, tRNA selection by aaRSs does not present a major challenge, as tRNAs are big enough to contain a large number of ‘identity elements’ for specific interactions with aaRSs. Amino acids, however, are smaller and must be distinguished solely by the nature of their side-chains. Although there are substantial chemical differences among most amino acids, the very similar chemical and/or structural properties of some make them difficult to distinguish (Cochella and Green, 2005; Hausmann and Ibba, 2008). To solve this situation, the aaRSs have two step reactions for aminoacylation (Figure 6). The first one occurs at the synthetic site when the amino
16
acid is transferred to the tRNA and the second one occurs at the editing site (Jakubowski and Goldman, 1992). In the first step, amino acids with larger side chains or different specific properties are excluded, which makes this synthetic site specific enough so that only the correct amino acid can be activated and transferred. However, smaller amino acids can establish sufficient interactions and can be activated and transferred to the tRNA. The role of the second site (the editing site), which is too small to fit the cognate amino acid and is distinct from the synthetic site, is to hydrolyze other small amino acids that slipped through the first selection (reduces the general error of aaRSs from 1 in 103 to 1 in 104 - 105) (Reynolds et al., 2010; Schimmel, 2008).
The removal of the non-cognate amino acid can occur in the mischarged aminoacyl adenylate (pre-transfer editing) leading to the release of the non-cognate amino acid, AMP and PPi or in the mischarged complex aminoacyl-tRNA (pos-transfer editing) where the RNA–amino acid ester linkage is hydrolyzed. If the non-cognate
amino acid is not cleared, a wrong amino acid will be incorporated in a protein, which
can ultimately alter the protein structure and/or function (Cochella and Green, 2005; Lee et al., 2006).
For example, threonyl-tRNA synthetase must discriminate threonine from valine
and from serine (both similar to threonine). This aaRS can discard amino acids larger than threonine, based on size and also discards valine because this amino acid binds significantly more weakly than threonine with threonyl-tRNA synthetase (a specific interaction between a zinc ion in the synthetic site and the hydroxyl group of threonine does not form when valine is bound). In the case of serine, this aaRS binds to the zinc ion in the synthetic site and is activated and transferred with a basal error (Cochella and Green, 2005).
17
Figure 6 – tRNA aminoacylation. The correct selection and activation of the cognate amino acid is made by the aaRS at the synthetic site (up). When a non-cognate amino acid is incorporated, the aaRS hydrolyze the amino acid at the editing site excluding it (down).
Adapted from (Cochella and Green, 2005)
The aaRSs can be grouped in two classes – class I and class II- of 10 enzymes each. The classification is based on the architectures of the two distinct active sites. Class I is characterized by a Rossman nucleotide-binding fold, consisting of alternating β-strands and α-helices, responsible for adenylate synthesis. In class II enzymes, the active site is formed by seven-stranded β-structure with flanking α-helices (Schimmel, 2008). Also, class I enzymes are mostly monomeric and in the aminoacyl-tRNA
formation, the aminoacyl group is transferred to the 2’-hydroxyl group of the terminal
adenosine of the tRNA and then moved to the 3’-hydroxyl by a trans-esterification reaction. In class II, all enzymes are multimeric, with the majority being homodimer. Also, in the aminoacyl-tRNA formation, the aminoacyl group is directly loaded on the 3’-hydroxyl of the terminal adenosine. These differences in the reaction mechanisms are a direct consequence of how aaRSs bind to the tRNA. Class I aaRSs bind the tRNA minor groove, and class II aaRSs recognize its major groove.
The class division of aaRSs is very rigid and each enzyme only belongs to one class. The class I enzymes include arginine, cysteine, glutamic acid, glutamine,
tRNA
Amino acyl-tRNA Amino acids
18
isoleucine, leucine, methionine, tyrosine, tryptophan, and valine tRNA synthetases. Most of these enzymes are monomeric. Class II enzymes are alanine, asparagine, aspartate, glycine, histidine, lysine, phenylalanine, proline, serine and threonine tRNA synthetases (Schimmel et al., 1993; Woese et al., 2000).
1.4. AMINO ACIDS: BUILDING BLOCKS OF PROTEINS
Proteins play an important role in life and are the most abundant class of biomolecules, occurring in all cells. They occur in great variety, size, molecular weight and function. This diversity is due to the basic elements of proteins, the amino acids and it is influenced by how these elements are rearranged, their acid-basic properties, their structure and also their chirality (Voet and Voet, 1995).
The structure of an amino acid consists in a tetrahedral alpha carbon (Cα), which is covalently linked to both the amino group and the carboxyl group (Figure 7). Also bonded to this α-carbon are hydrogen and a variable side chain. It is the side chain (R-group) that gives each amino acid its identity. With four different groups connected to the α-carbon, the amino acids are chiral (the α-carbon is the chiral center) and the two mirror-image forms are called the “L” isomer and the “D” isomer. Only “L” amino acids are constituents of proteins. However, some microorganisms elaborate some peptides containing both isomers (Garret and Grisham, 1995; Voet and Voet, 1995).
Amino acids in solution at neutral pH exist predominantly as dipolar ions. In the dipolar form, the amino group is protonated (-NH3+) and the carboxyl group is deprotonated (-COO-). The ionization state of an amino acid varies with pH. In acid solution, the amino group is protonated (-NH3+) and the carboxyl group is not dissociated (-COOH). In basic solution, the carboxylic acid is deprotonated (-COO-) and the amino group loses a proton (-NH3) (Nelson and Cox, 2004).
19
Although there are more than 300 natural occurring amino acids, all proteins in bacterial, archaeal, and eukaryotic species are constituted by the 20 canonical amino acids. The 20 canonical amino acids almost never occur in equal amounts in a protein. Some amino acids may occur only once or may not be present at all in a given type of protein while others may occur in large numbers. The first amino acid to be discovered was asparagine, in 1806, whereas the last canonical amino acid to be found was threonine in 1938. All the amino acids have trivial or common names that in some cases derive from the source from which they were first isolated. For example, asparagine was first found in asparagus, and glutamate in wheat gluten; tyrosine was first isolated from cheese and its name is derived from the Greek tyros, “cheese” whereas glycine (Greek glykos,“sweet”) was so named because of its sweet taste (Nelson and Cox, 2004; Voet and Voet, 1995).
Figure 7 – General structure of an amino acid. This structure is common to all amino acids and includes a R group, an amino group and a carboxyl group, as well as a hydrogen.
20
1.5. CLASSIFICATION AND CHARACTERISTICS OF THE 20 CANONICAL AMINO ACIDS
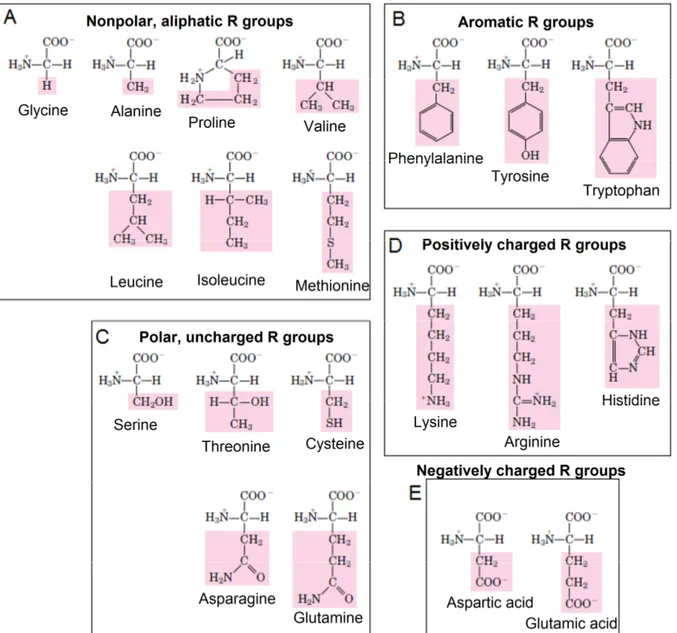
There are several ways to classify the 20 amino acids found in proteins, based on size or nutritional needs for example. However, the most common way is based on the properties of their R group; in particular, their polarity or tendency to interact with water at neutral pH, forming four groups (Figure 8). The polarity of the R groups varies widely, from nonpolar and hydrophobic (water-insoluble) to highly polar and hydrophilic (water-soluble) (Garret and Grisham, 1995; Voet and Voet, 1995).
1.5.1. NONPOLAR AMINO ACIDS
The R group in this class of amino acids is nonpolar and hydrophobic. Alanine, valine, leucine and isoleucine have an alkyl group chain (Figure 8-A). Glycine has the smallest side chain, a hydrogen atom. Alanine, valine, leucine and isoleucine side chain varies in size from a methyl group for alanine to isomeric butyl groups for leucine and isoleucine. Proline has an aliphatic side chain with a distinctive cyclic structure. Methionine, one of the two sulfur-containing amino acids, has a non polar thioether group in its side chain. Aromatic amino acids are phenylalanine, tyrosine and tryptophan and they have aromatic side groups (Figure 8-B). Tyrosine and tryptophan are significantly more polar than phenylalanine, because of the tyrosine hydroxyl group and the nitrogen of the tryptophan indole ring (Garret and Grisham, 1995; Voet and Voet, 1995).
1.5.2. POLAR, UNCHARGED AMINO ACIDS
The R groups of these amino acids are more soluble in water, or more hydrophilic than those of the nonpolar amino acids, because they contain functional groups that form hydrogen bonds with water. This class of amino acids includes serine, threonine, cysteine, asparagine, and glutamine (Figure 8-C). The polarity of serine and threonine is due to their hydroxyl groups, while the polarity of cysteine is due to its sulfhydryl group. On the other hand, the polarity of asparagine and glutamine derives from their amide groups (Garret and Grisham, 1995; Voet and Voet, 1995).
21
1.5.3. POSITIVELY CHARGED (BASIC) AMINO ACIDS
The most hydrophilic amino acids are those that are either positively or negatively charged. The amino acids in which the R groups have significant positive charge at pH 7.0 are lysine, which has a second primary amino group, arginine, which has a positively charged guanidino group; and histidine, which has an imidazole group (Figure 8-D). Histidine is the only common amino acid having an ionisable side chain serving as a proton donor/acceptor (Garret and Grisham, 1995; Voet and Voet, 1995).
1.5.4. NEGATIVELY CHARGED (ACIDIC) AMINO ACIDS
The two amino acids having R groups with a negative charge at pH 7.0 are aspartic acid (aspartate) and glutamic acid (glutamate), both having a second carboxyl group (Figure 8-E). These side chain carboxyl groups are weaker acids than the α-COOH group, but are sufficiently acidic to exist as –COO- at neutral pH. Asparagine and glutamine are, respectively, the amides of aspartic acid and glutamic acid (Garret and Grisham, 1995; Voet and Voet, 1995).
22
Figure 8 - The four groups of the twenty amino acids that constitute proteins. The nonpolar amino acids are glycine, alanine, proline, valine, leucine, isoleucine, methionine, phenylalanine, tyrosine and tryptophan (the last three are separated only to highlight the fact they are aromatic). Serine, threonine, cysteine, asparagine and glutamine are the polar amino acids. The positively charged amino acids are lysine, arginine and histidine, while the negatively charged amino acids are aspartate and glutamate. The structural formulas show the state of ionization that would predominate at pH 7.0.
23
1.6. SPECIALIZED ROLES OF AMINO ACIDS
Amino acids have many biological important functions. They are the basic units of proteins and because of that they play a key role in protein synthesis. Besides this important function, amino acids alone also participate in other important functions (Nelson and Cox, 2004).
They can function as chemical messengers in the communication between cells or they can originate molecules that participate as chemical messengers. For example, glycine is an inhibitory neurotransmitter in central nervous system. Some amino acid products also participate as chemical messengers, such as histamine, the decarboxylation product of histidine, which is a potent local mediator of allergic reactions or the neurotransmitters γ-aminobutyric acid (a glutamic acid decarboxylation product) and dopamine (a tyrosine product). Another example is thyroxine, a tyrosine product, which is a thyroid hormone that stimulates vertebrate metabolism (Garret and Grisham, 1995; Voet and Voet, 1995).
Amino acids or their products also can act as intermediates in various metabolic processes, such as regulation of cell growth, production of metabolic energy, nitrogen metabolism or synthesis of purines and pyrimidines. Other functions are for example, urea biosynthesis with the intermediates aspartic acid, citrulline and ornithine (both arginine products) or amino acid metabolism, in which homocysteine (a cysteine product) plays a key role (Castagna et al., 1997; Nelson and Cox, 2004).
24
1.7. AMINO ACID TOXICITY
Although amino acids are important molecules in the cell, like every molecule, in excess they can be toxic and damage the cell (Voet and Voet, 1995). Amino acid toxicity normally results in growth reduction, malformations or death as a result of excessive levels of an amino acid (Smith, 1968). This toxicity can result from the high intake from a single or a mixture of amino acids or in severe cases, during critical illness. In critical illness, food intake can be compromised due to altered digestibility or administration of different compositions and quantities of food constituents. The temporary pool of protein, which accumulates after a meal in the gut, is slowly released as amino acids in circulatory system. So, in critical illness, this release can be deregulated and large quantities of amino acids can be released. Also, the priority is to generate a healing response rather than to preserve muscle mass. As a consequence, loss of muscle mass can increase amino acids concentrations in circulatory system (Soeters et al., 2004).
Understanding which amino acid concentrations affect health or knowing amino acid intake necessities of some animals (for example pigs) is important in order to obtain the best development and maximum growth (Baker, 2004; Soeters et al., 2004). Several vertebrate models have been used for studying amino acid toxicity namely chicken (Smith, 1968), rat (Peng et al., 1973), mouse (Dever and Elfarra, 2008) and pig (Baker, 2004).
The amino acid mechanism of toxicity is usually due to one of the following effects: competitive inhibition of enzymes or transporters because of resemblance to the normal substrate; interference in other metabolic processes or interference in the activation and transfer of the cognate amino acid to the tRNA (Hylin, 1969). Usually the main toxic pathway is the first one, with a group of amino acids interfering in a transport system of another group of amino acids. For example, Peng and colleagues observed that large neutral amino acids such as methionine or leucine in excessive concentrations interfered with small neutral amino acids transport systems such as glycine or serine and vice-versa, incorporating in a wrong transporter and affecting the intake of some amino acids (Peng et al., 1973). Also wrong incorporation of an amino
25
acid can affect the neurotransmitter concentration. For example, high phenylalanine concentrations reduced the serotonin concentration in chicken (Lartey and Austic, 2008). Besides this toxicity, amino acids can interfere in other metabolic pathways. For example, high concentrations of cysteine increases sulfate (a strong anion), and consequently causes lethal metabolic acidosis in the chick (Dilger and Baker, 2008). Another example is glutamine which increases ammonia leading to neurotoxicity (Albrecht et al., 2010).
Analog amino acids can be incorporated during translation by tRNAs. These analog amino acids are similar in size and shape with the canonical amino acids and because of that, they can bond with the aaRSs and be mischarged onto tRNA and be inserted in the growing polypeptide. Although the protein structure and function can remain unaltered by incorporation of one or more analogues, in some cases, this situation can alter greatly the protein causing toxicity to the cell (Rodgers and Shiozawa, 2008). Two examples of mischarging of an analog onto tRNA are canavanine instead of arginine by ArgRS (Figure 9-A) and azetidine instead of proline by ProRS (Figure 9-B) (Hendrickson et al., 2004; Schwartz and Maas, 1960).
Figure 9 – Structure of protein amino acids and analogues. A) Structure of arginine and its analogue canavanine. B) Structure of proline and its analogue azetidine.
26
1.8. ZEBRAFISH AS A MODEL
To evaluate the toxicity of a chemical or compound, it is essential to identify the endpoints of toxicity and their dose-response relationships. Although studies in cultured cells are a way to understand toxicity mechanisms, in vitro systems are limited by the availability of appropriate cell lines and in vitro culture conditions do not reflect the natural environment of cells in the body. Whole organism approaches provide the most comprehensive picture of the toxic effect (Yang et al., 2009). Several vertebrate models have been used to test this toxicity and to extrapolate toxicant effects to humans. Because genes, receptors, and molecular processes are highly conserved across vertebrates, studies with other animal species could be representative for more-complex animals like humans. In particular, gene programming and development in the early life stages of all vertebrates are highly conserved, with significant similarities in the morphology of all vertebrate embryos. Usually these models, such as rodents, chicken or frogs are expensive, time consuming and more restricted by law (Hill, 2005).
Zebrafish (Danio rerio) (Figure 10) appears as an alternative vertebrate model to test toxicity. The main benefits of using zebrafish as a toxicological model over other vertebrate species are the small size, high husbandry and rapid development. Unlike other fish species such as trout, zebrafish are rather small reducing housing space and husbandry costs and, consequently, reducing the quantity of dosing solutions (Eimon and Ashkenazi, 2009).
Zebrafish is a freshwater teleost fish that emerged in the last twenty years as a promissory model organism for biological research, predominantly in development
biology, molecular genetics, neurobiology and toxicology (Hill, 2005). They are
omnivorous fish that primarily feed on plankton, as well as insects, in the wild. In the aquarium, zebrafish are usually fed various types of dry food. The zebrafish start to feed at around 5 days post-fertilization and until that time, their sole source of energy is
27 Figure 10 – Adult zebrafish
www.zfin.org (25-10-2011)
As a vertebrate, it resembles mammals in its development and metabolic processes, but presents advantages as a study model. It has a high fertility rate (large number of offspring - 200 to 300 eggs a day), short life cycle (reach sexual maturity in four months) and small size (larvae have 1-4 mm long and adults 3 cm long) (Hill, 2005). Also, embryos are fertilized externally, undergo rapid and synchronous development, are optically transparent and most organs become functional between 3 and 5 days post fertilization enabling non-intrusive visualization of organs and biological processes with high resolution (Scholz et al., 2008). Another advantage is the fact that zebrafish development is well characterized and embryological development can be continually followed due to embryo transparency (Kimmel et al., 1995). In addition, zebrafish are sensitive to chemical exposure during early development. Also, zebrafish embryos that are malformed or display organ dysfunction can survive allowing their observation and relationship with chemical exposure (Selderslaghs et al., 2009).
Administration of drugs in zebrafish larvae is simple, because they absorb small molecules diluted in the surrounding water through their skin and gills (McGrath and Li, 2008). Because of that, it is possible to generate high-throughput screens for toxicity testing, small-molecule and drug screening in which zebrafish grow and develop in small screening plates. From the egg stage, zebrafish embryos can survive for several days in a single well of a screening plate trough the absorption of the nutrients in the yolk (Hill, 2005).
28
These characteristics make the zebrafish an attractive candidate for screening toxicants. In addition to all the described advantages, the zebrafish is also listed as a recommended test species in the “Fish, Early-life Stage Toxicity Test” (OECD Test Guideline TG 210) and the “Fish, Short-term Toxicity Test on Embryo and Sac-fry Stages” (OECD Test Guideline TG 212) for the determination of lethal and sub-lethal effects of chemicals (Selderslaghs et al., 2009).
1.9. AIMS
Amino acids are the building blocks of proteins and are crucial for proper development. However, in excess these compounds can cause toxicity and be deleterious. The aim of this study was to assess the effect of canonical amino acid nutritional imbalances during zebrafish development and try to elucidate the underlying mechanisms of amino acid toxicity.
29
31
2.1. AMINO ACID ASSAY ON ZEBRAFISH EMBRYOS 2.1.1. ZEBRAFISH MAINTENANCE
A breeding stock of wild type zebrafish (AB strain) aged between 4 and 12 months was used for egg production. The fish were free from externally visible diseases and not treated with any pharmaceutical treatment. Males and females were kept in aquaria with a loading capacity of 3.5L, at 28ºC on a 14/10 h light/dark cycle in a close flow-through system (include a set of biological, mechanical and carbon filters). System water sterilization was assured by UV light. Animal husbandly followed the Portuguese law for animal experiments.
2.1.2. EGG COLLECTION
In the day before the test, males and females in a ratio of 1:1 were housed separately in breeding chambers. The breeding chambers contained green marbles serving as spawning substrate and preventing adult zebrafish from egg predation. About 30 minutes after the onset of light, the males and females were put together in the breeding chambers for 30-60 minutes (a single mature female can spawn about 50-80 eggs per day). Eggs were collected and washed in “embryo wash water” (0.1 ml of 5% sodium hypochlorite in 170 ml of system water) for 1-2 minutes and transferred to petri dishes containing different amino acid concentrations diluted in system water. Only fertilized eggs were used and were identified by the development of a blastula in a dissecting microscope. Unfertilized eggs not undergoing cleavage or eggs showing obvious irregularities during cleavage or injuries of the chorion were discarded. Fertilized eggs during the cleavage stages were incubated at 28ºC until 4hpf (sphere phase). Then, the embryos at sphere phase were examined and those that developed normally were selected and twenty embryos were transferred to a 24-well multi-plate with the corresponding amino acid concentration.
32
2.1.3. AMINO ACID SOLUTIONS
Amino acid working solutions were prepared by dilution of stock solutions. The stock solutions were prepared fresh by diluting the respective amino acid (Formedium) in system water. The solutions were autoclaved and stored at room temperature in the dark until use. The pH of all solutions was checked and adjusted to 6.8-8.0 when necessary by adding HCl or NaOH.
The tests were carried out in 24-well plates at different concentrations (25 mM, 50 mM, 75 mM and 100 mM) for the 20 canonical amino acids always comparing with a control (exposed to system water only). These concentrations were chosen based on previous studies (Casida, 1955) and due to the fact, that, at these concentrations, all amino acids were soluble in water. Twenty embryos were used for each plate, one for each well with 2 ml of the amino acid solution or system water (control). Four biological replicates of each concentration were performed. The test was carried out until 120 hpf at 28ºC. Test solutions (system water or amino acid solutions) were changed every day. To avoid bacterial contaminations (due to the richness amino acid solutions), 10 µg/ml of ciprofloxacin (SIGMA) were added to all solutions and also changed every day. This concentration is non-toxic for zebrafish (Halling-Sorensen et al., 2000) and does not react with the amino acids.
2.1.4. EMBRYO OBSERVATION
Embryos were evaluated at different time points (24, 48, 72, 96 and 120 hours post fertilization) and compared with the control. Several phenotypic abnormalities (Table 1) were considered according to (Lammer et al., 2009).
33
Table 1 - Lethal and sub lethal endpoints during zebrafish development
Adapted from (Lammer et al., 2009).
*indicates the time when it is possible to observe the corresponding phenotypic abnormality
24 hpf 48 hpf 72 hpf 96 hpf 120 hpf Mortality * * * * * Malformations * * * * * Growth retardation * * * * * Edema formation * * * * Lack of pigmentation * * * * Hatching * * * Skeletal deformations * * *
The percentage of malformations, edemas, growth retardation, lack of pigmentation, skeletal deformities and hatching rate were calculated considering the number of embryos that were alive in each stage assessed. The percentage of mortality was calculated as the ratio of dead embryos over the total number of embryos (20).
2.1.5. STATISTICAL ANALYSIS
The resulting data and their statistical treatment were analyzed in Graphpad Prism 5 to create concentration-response (mean ± SD) curves/bars for each endpoint by one-way analysis of variance (ANOVA) comparing with control (Dunnett test). Differences were considered to be statistically significant when p<0.05 (* = p<0.05; ** = p<0.01; *** = p<0.001).
34
2.2. EMBRYO SKELETAL EVALUATION OF DEFORMITIES 2.2.1. SAMPLE COLLECTION AND FIXATION
Random samples of 20 specimens (per amino acid concentration) were collected in eppendorfs and anaesthetized on ice to arrest embryo movement. Water from the eppendorfs was removed and the samples were fixed with 4% paraformaldehyde (dissolved in PBS) overnight, at 4ºC in the dark. The fixative was removed by washing the samples 4 times for 5 minutes with Phosphate Buffer Saline 0.1 M, pH 7.4 (PBS). Then, the PBS was removed and the samples were stored in 70% ethanol at 4ºC in the dark until use.
2.2.2. CARTILAGE STAINING
This step was performed at CCMAR from Algarve University.
To stain the cartilage, the embryos were transferred to Alcian blue solution, between 10 and 30 minutes (only enough time to the stain penetrate the tissues). Immediately after staining, embryos were quickly rinsed in absolute ethanol and incubated in ethanol neutralizing solution (ethanol 100% with 0.01% KOH) for 10 minutes. Then, the embryos were incubated in a bath of 2% KOH, for a few hours, at room temperature, to clear the tissues. To preserve the embryos, they were incubated through a series of KOH – glycerol baths (25%, 50%, 75 % of glycerol), to absolute glycerol, where they were preserved. A few crystals of phenol were added to prevent fungi or bacterial growth (Gavaia et al., 2000).
35
2.3. PROTEIN UBIQUITINATION ANALYSIS 2.3.1. PROTEIN EXTRACTION
Random samples of 20 embryos (per amino acid concentration) were collected in eppendorfs. To remove the chorion from the embryos, 30 µl of pronase were added to each eppendorf. The embryos were washed twice with system water and 500 µl of Fish Ringer solution without calcium 1:2 were added to remove the yolk of the embryos. To help the removal of the yolk, the samples were ressuspended and incubated for 5 minutes at 1100 rpm in the thermomixer at 23ºC. Samples were centrifuged for 1 minute at 13000 rpm, the supernatant removed and 500 µl of protein wash solution pH 8.5 (110
mM NaCl; 3.5 mM KCl; 2.7 mM CaCl2.2H2O; 10 mM Tris/Cl) were added. The samples
were incubated for 2 minutes at 1100 rpm in the thermomixer at 23ºC and again, centrifuged for 1 minute at 13000 rpm, the supernatant removed and 500 µl of protein wash solution were added. In the end, the samples were centrifuged for 1 minute at 13000 rpm, the supernatant removed and the embryos stored at -80ºC.
2.3.2. WESTERN BLOT
Forty µl of 1x SDS buffer were added to the embryos extracts, followed by denaturation at 95ºC for 5 minutes. Samples were quantified in Nanodrop system and were loaded onto 12% PAA protein gel and electrophoresed in SDS 1x running buffer at 120V. Proteins were transferred 4h at 4ºC to nitrocellulose Hybond-P membranes (GE Healthcare). Briefly, nitrocellulose Hybond-P membranes placed with the 12% PAA protein gel, six filters and the cushions in a Bio-Rad wet transferring system and run at 100 mA, 4 hours at 4ºC in transfer buffer (25mM Tris base, 192mM glycine, 12% methanol). Then, the membranes were blocked for 1 hour with 5% non-fat dry milk in TBS-T (TBS + 0.1 % Tween 20) and incubated 1 hour with anti β-tubulin mouse antibody (1:500) solution in TBS-T at room temperature. Membranes were then washed 4 times with TBS-T, during 5 minutes each, and incubated in the secondary antibody IRDye®800 CW anti-mouse IgG from LI-COR® (1:10000) solution in TBS-T, during 1 hour in the dark. Three washes in TBS, during 10 minutes each were carried out in the
36
dark and the membrane was scanned using the ODYSSEY Infrared Imaging System (Li-Cor Biosciences). To remove the antibody, the membranes were washed in Glycine pH 2.5 for 30 minutes, in NaCl for 2 minutes and then washed 2 times for 5 minutes each in TBS. The membranes were incubated overnight with anti β-ubiquitin mouse antibody (1:2000) solution in TBS-T at 4ºC. Then, membranes were washed 4 times with TBS-T, during 5 minutes each, and incubated in the secondary antibody IRDye®800 CW anti-mouse IgG from LI-COR® (1:10000) solution in TBS-T, during 1.5 hours in the dark. Three washes in TBS, during 10 minutes each were carried out in the dark and the membrane was scanned again using the Odissey® Infrared Imaging System (Li-Cor Biosciences). The antibodies anti tubulin mouse antibody and anti β-ubiquitin mouse antibody were purchased from Invitrogen.
37
39
3.1. PHENOTYPIC EFFECTS OF AMINO ACID EXPOSURE
The 20 canonical amino acids in excess are toxic, although some are more tolerable than others. The principal consequence of the amino toxicity in vertebrate models such as pigs and chickens is growth retardation (Baker, 2004).
In order to verify the toxicity of the 20 canonical amino acids during vertebrate development, zebrafish embryos were exposed to amino acids solutions at different concentrations (25 mM, 50 mM, 75 mM and 100 mM) and observed for mortality, morphological changes and deformities at different time points (24, 48, 72, 96 and 120 hpf) (Figure 31-Annexes). There were two exceptions: L-cysteine and L-tyrosine that could not be tested until 100 mM. L-cysteine is readily oxidized in water forming a covalently linked dimeric amino acid called cystine, in which two cysteine molecules or residues are joined by a disulfide bond (Nelson and Cox, 2004). L-tyrosine is the most insoluble canonical amino acid in water (± 3 mM) which makes it impossible to test for higher concentrations. At the concentrations tested both L-cysteine and L-tyrosine did not show toxicity (Figure 31-Annexes). From the remaining 18 amino acids tested, 7 showed some phenotypic abnormality or mortality in the tested concentrations at least at one time point (table 2).
40
Table 2 – Presence (*) or absence of several phenotype abnormalities at least in one concentration tested (until 100 mM) at one time point. It wasn´t possible to test two amino acids until 100 mM L-cysteine and L-tyrosine, however at the tested concentration, they did not caused any effect.
Group Amino acid Mortality Malformation Edema formation Lack of pigmentation Hatching delay Growth arrest N o n p o la r L- alanine L-glycine L-proline L-valine L-leucine L-methionine L-isoleucine L-tyrosine L-phenylalanine * * * * L-tryptophan * * * P o la r L-serine L-threonine L-asparagine L-glutamine * L-cysteine B a s ic L-histidine L-lysine * L-arginine * A c id ic L-aspartic acid * L-glutamic acid *
Next, the amino acid toxicity data will be presented according to amino acid classes.
41
3.1.1. NONPOLAR AMINO ACIDS
Zebrafish embryos were exposed to different concentrations of nonpolar amino acids, namely 25 mM, 50 mM, 75 mM and 100 mM. Only the aromatic amino acids L-tryptophan and L-phenylalanine showed toxicity in zebrafish. The other seven nonpolar amino acids tested (methionine, glycine, alanine, proline, valine, leucine, L-isoleucine) did not show any negative effect on normal development of zebrafish embryos.
L-tryptophan was the most toxic amino acid tested. Because it caused high mortality at low concentrations, zebrafish were exposed as described before (section material e methods) at 1 mM, 5 mM, 10 mM and 15 mM (Figure 11). At 1 mM, L-tryptophan did not cause any effect and at 15 mM all embryos died already at 24 hpf (Figure 11-A). Between these two concentrations, besides mortality, embryos showed edema formation (Figure 11-B) and malformations (Figure 11-C). The embryos presented underdeveloped heads and malformed tails (Figure 12; Figure 32-Annexes).
42
Figure 11 - Effects of L-tryptophan on survival, edema formation and malformation rate. Zebrafish embryos were exposed to different L-tryptophan concentrations (between 1 mM and 15 mM) until 120 hpf and compared with the control. Mortality was recorded every 24 hours until 120 hpf. Hatching and edema formation were recorded at 48 hpf and malformation rate was recorded at 24 hpf. A) Survival rate after L-tryptophan treatment. There was a decrease in survival with increasing concentrations. 15mm showed to be lethal to all embryos at 24 hpf, 10 mM at 48 hpf and 5 mM at 96 hpf. B) Edema formation rate after L-tryptophan treatment at 48 hpf. All embryos developed edema at 5 mM (***p<0.001). C) Malformation rate after L-tryptophan treatment at 24 hpf. Malformed embryos appeared at 5 mM (70 %) and 10 mM (90 %) (***p<0.001 in both cases).
A
B
43
The other toxic nonpolar amino acid was L-phenylalanine. Embryos were exposed to 10 mM, 25 mM, 50 mM, 75 mM and 100 mM. It caused mortality (Figure 13-A), hatching delay (Figure 13-B), edema formation (Figure 13-C) and general growth retardation (Figure 13-D). Also, some embryos developed reduced pigmentation or no pigmentation at all (Figure 14-B, C, D) when comparing with the control (Figure 14-A).
Mortality was maximal in embryos exposed to 100 mM at 120 hpf. Embryos exposed to 25 mM, 50 mM and 75 mM showed similar effects such as hatching delay, edema formation and reduced pigmentation. Only at 100 mM there was growth retardation with all embryos affected (figure 14-E). Although embryos exposed to L-tryptophan were underdeveloped, in embryos exposed to 100 mM of L-phenylalanine the growth retardation was more evident.
10 mM 5 mM
Control
Figure 12 - Embryos exposed to L-tryptophan. Lateral view of 24 hpf control embryos and embryos exposed to 5mM and 10 mM of L-tryptophan. Photos were taken with a Nikon camera attached to a Leica magnifier (pictures are not related in size). It is possible to see the differences between affected embryos and control. The affected embryos developed malformations in tail and exhibited smaller heads (indicated by arrows).
44
Figure 13 - Effects of L-phenylalanine on survival, hatching, growth rate and edema formation. Zebrafish embryos were exposed to different concentrations (10mM, 25 mM, 50 mM, 75 mM and 100 mM) until 120 hpf and compared with the control. Mortality was recorded every 24 hours until 120 hpf. Hatching rate was recorded at 72 hpf, edema rate at 48 hpf and growth retardation rate at 24 hpf. A) Survival rate after L-phenylalanine treatment. 100 mM showed to be lethal to all embryos at 120 hpf and at his time point. B) Hatching rate after L-phenylalanine treatment. All embryos didn’t hatch between 50 mM and 100 mM (***p<0.001 in the three cases) and only 40 % of the embryos hatched ((***p<0.001) when exposed to 25 mM. C) Edema formation rate after L-phenylalanine treatment at 48 hpf. Embryos developed edema at 25 mM, 50 mM and 75 mM (***p<0.001 in the three cases). D) Growth retardation rate after L-Phenylalanine treatment at 24 hpf. These embryos were affected only at 100 mM with total incidence (***p<0.001).
A
B
45
L
Figure 14- Embryos exposed to L-phenylalanine. Lateral view of 48 hpf embryos exposed to different concentrations (A-Control, B-25 mM, C-50 mM, D-75 mM and E-100 mM). Photos were taken with a Nikon camera attached to a Leica magnifier. It is possible to see the difference between embryos exposed to 100 mM and control in development. The affected embryos didn’t developed tail, a differentiated head or pigmentation. Embryos exposed to 25 mM, 50 mM and 75 mM showed similar phenotypic abnormalities like edema formation (indicated by the arrows) and reduced/absence of pigmentation.
A
B
C
46
3.1.2. POLAR AMINO ACIDS
Of the four polar amino acids tested (serine, threonine, asparagine, L-glutamine) at the tested concentrations, only L-glutamine appeared to be toxic. This amino acid caused high mortality at low concentrations, so, it was tested at 5 mM, 10 mM, 20 mM and 30 mM (Figure 15). No other phenotypic abnormality was observed.
Figure 15 - Survival rate after L-glutamine treatment. Zebrafish embryos were exposed to different concentrations (5mM, 10 mM, 20 mM and 30 mM) until 120 hpf, compared with the control. Mortality was recorded every 24 hours until 120 hpf. Mortality was maximal for 72 hpf embryos exposed to 10 mM of L-glutamine.
47
3.1.3. BASIC AND ACIDIC AMINO ACIDS
Besides L-histidine, no other amino acid belonging to one of these two groups is related to high toxicity, although L-aspartic acid, L-glutamic acid, L-lysine and L-arginine show relative toxicity in chicken (Smith, 1968) and rat (Sauberlich, 1961). However, in our study, the reverse happened. At the tested concentrations, L-histidine was not toxic and the other four showed some toxicity. L-Arginine was the most toxic one, causing mortality (Figure 16) and no other effect. Interestingly, the other three amino acids showed similar effects between them. Embryos exposed to L-lysine, L-aspartic acid and L-glutamic acid showed hatching delay (Figure 33-Annexes). L-lysine was the most toxic one, exhibiting hatching delay from 50 mM to 100 mM at 72hpf (Figure 17-A) followed by L-aspartic acid, with only 50 % of the embryos getting out of the chorion at 50 mM at 72 hpf (figure 17-B). L- glutamic acid was the less toxic of these three, with half of the embryos hatching only at 100 mM at 72 hpf (Figure 17-C).
Figure 16 - Survival rate after L-arginine treatment. Zebrafish embryos were exposed to different concentrations (50 mM, 75 mM and 100 mM) until 120 hpf, compared with the control. Mortality was recorded every 24 hours until 120 hpf. At 50 mM there was no mortality, however at 75 mM all 48 hpf embryos died, and mortality was maximal in 100 mM exposed embryos.
48
Figure 17 - Effects of L-lysine, L-aspartic acid and L-glutamic acid on hatching rate. Zebrafish embryos were exposed to different amino acids concentrations until 120 hpf. Hatching rate was recorded at 72 hpf. A) Hatching rate after L-lysine treatment at different concentrations (25 mM, 50 mM, 75 mM and 100 mM). Hatching rate decreased with L-lysine concentrations. At 50, 75 mM and 100 mM, less than 15% of the embryos hatched (***p<0.001) B) Hatching rate after L-aspartic acid treatment at different concentrations (25 mM, 50 mM, 75 mM and 100 mM). Hatching rate decreased with L-aspartic acid concentrations and at 100 mM the effect was maximal with almost all embryos inside the chorion (***p<0.001). C) Hatching rate after L-glutamic treatment at different concentrations (25 mM, 50 mM, 75 mM and 100 mM). Only at 100 mM there was an effect, with 50 % of the embryos outside the chorion (***p<0.001).
A B
49
3.1.4. SMALL AMINO ACIDS, A DIFFERENT APPROACH
Some amino acid classifications consider small amino acids as a group despite of their properties. This group is formed by the five amino acids with lower molecular weight, and includes glycine, alanine, serine, proline and valine (Nelson and Cox, 2004).
As stated before, small amino acids are most likely wrongly incorporated by the aaRSs. This can happen because the synthetic site only accepts amino acids that can fit and can establish sufficient interactions (Reynolds et al., 2010). This fact was demonstrated by Lee and colleagues (Lee et al., 2006). They tested the effect of excessive amounts of amino acids in mouse neurons with alanyl-tRNA synthetase with a mutation in the editing site (and consequently loss of the editing site). The result was that, serine was mischarged by tRNAs and incorporated during translation. Even with the editing site, amino acids can be mischarged by tRNA, as happens with threonyl-tRNA synthetase that mischarged serine with a low error (Cochella and Green, 2005). Another example are the analogue amino acids, which are mischarged in tRNAs in high levels and can escape the editing site (Hendrickson et al., 2004).
With this idea in mind, and since the small amino acids (alanine, glycine, L-proline, L-serine and L-valine) did not show a significant toxicity even at 100 mM, we decided to increase their concentrations to verify if they were toxic in higher concentrations. Also, we wanted to verify if high concentrations increased the chance of small amino acids to be mischarged and incorporated during translation.
Embryos were exposed to the small amino acids at 250 mM, 300 mM, 350 mM, 400 mM, 450 mM and 500 mM. These concentrations were chosen since there was no effect at 250 mM and the toxicity was maximal at 500 mM on zebrafish embryos. Interestingly all the five amino acids had similar effects on similar concentrations (Table 3).
50
Table 3- Presence (*) or absence of several phenotype abnormalities at least in one concentration tested (until 500 mM) of the small amino acids at one time point.
Amino acid Mortality Malformation Edema formation Lack of pigmentation Hatching delay Growth arrest L- alanine * * * L-glycine * * * L-proline * * * L-valine * * * L-serine * * *
Mortality was almost total or total in 24 hpf embryos exposed to 500 mM, while in embryos exposed to 350 mM, mortality was minimal (Figure 18-A; Figure 20-A; Figure 22-A; Figure 24-A; Figure 26-A). Also, all small amino acids tested caused hatching delay especially between 350 mM and 450 mM (Figure 18-B; Figure 20-B; Figure 22-B; Figure 24-B; Figure 26-B). The embryos were underdeveloped with malformations, namely altered tail and/or head and sometimes alterations were observed in the eyes (Figure 18-C; Figure 20-C; Figure 22-C; Figure 24-C; Figure 26-C). This effect was only present above 400 mM and was observed at early stages of development (24 and 48 hpf) (Figure 19-A; Figure 21-A; Figure 23-A; Figure 25-A; Figure 27-A). Also, L-alanine, L-glycine, L-proline, L-serine and L-valine caused skeletal malformations on the embryos (Figure 18-D; Figure 20-D; Figure 22-D; Figure 24-D; Figure 26-D). This effect was only observed at 300 mM and 350 mM. However, at 350 mM the effect was more evident than at 300 mM (Figure 19-B; Figure 21-B; Figure 23-B; Figure 25-B; Figure 27-B).
51
Figure 18 - Effects of L-alanine on survival, hatching and normal development. Zebrafish embryos were exposed to different L-alanine concentrations (between 250 mM and 500 mM) until 120 hpf and compared with the control. Mortality was recorded every 24 hours. Hatching and skeletal deformities rates were recorded at 72 hpf and malformation rate was recorded at 48 hpf. A) Survival rate after alanine treatment. There was a decrease in survival with increasing L-alanine concentrations. 500 mM was lethal to all embryos at 48 hpf, 450 mM at 96 hpf and 400 mM at 120 hpf. 250 mM, 300 mM and 350 mM showed none or little effect on survival rate. B) Hatching rate after L-alanine treatment. Almost all embryos did not hatch at 400 mM and 450 mM (***p<0,001 in both cases) with no effect on other concentrations. C) Malformation rate after L-alanine treatment at 48 hpf. Malformed embryos only appeared at concentrations above 400 mM with total incidence at 48 hpf (***p<0.001 in both cases). D) Skeletal deformities rate after L-alanine treatment at 72 hpf. Deformed embryos only appeared at 300 mM and 350 mM, with an incidence of 55 % and 80 % respectively (***p<0.001 in both cases).
A
B
52
Figure 19 - Embryos exposed to L-alanine show increased incidence of malformations. A) Lateral view of 24hpf and 48hpf embryos exposed to 400 mM, 450 mM and the control. Photos were taken with a Nikon camera attached to a Leica magnifier (pictures are not related in size). It is possible to see the difference between the affected embryos and the control (smaller heads, smaller tails and underdeveloped eyes) indicated by the arrows. B) 72hpf embryos exposed to 300 mM and 350 mM L-alanine and the control. These embryos showed skeletal deformities, with little impact on 300 mM exposed embryos but with higher impact on 350 mM exposed embryos.
Control 400 mM 450 mM A B Control 300 mM 350 mM 24 hpf 48 hpf B