Article
Printed in Brazil - ©2012 Sociedade Brasileira de Química0103 - 5053 $6.00+0.00
A
*e-mail: [email protected]
HPLC Determination of Histamine, Tyramine and Amino Acids in Shrimp
By-Products
Carolina Bueno-Solano, Jaime López-Cervantes, Dalia I.Sánchez-Machado∗ and Olga N. Campas-Baypoli
Departamento de Biotecnología y Ciencias Alimentarias, Instituto Tecnológico de Sonora, 5 de Febrero 818 Sur, Cd. Obregón, MX-85000 Sonora, México
Aminas biogênicas em alta concentração podem afetar a qualidade dos alimentos e causar várias doenças, pois estão presentes em produtos como frutos do mar, vinhos e outros produtos fermentados. Subprodutos do camarão são uma fonte rica de proteína hidrolisada que podem ser usadas como suplemento alimentar. Amostras (de subprodutos de camarão) de proteína seca em pó, proteínas hidrolisadas líquidas e farinha da cabeça de camarão foram analisadas para avaliar o conteúdo de histamina e tiramina. As aminas foram extraídas com ácido tricloroacético 5% e posteriormente derivatizadas com o-ftaldialdeído. A separação cromatográfica foi realizada em uma coluna analítica, Chrom SEP C18 SS 5 mm (4,6 mm × 150 mm) com eluição por gradiente, os comprimentos de onda foram λex = 335 nm e λem = 440 nm. A fase móvel utilizada foi uma mistura de tetrahidrofurano, metanol e tampão fosfato a uma vazão de 0,6 mL min-1. Sob essas condições, a repetibilidade (desvio
padrão relativo < 6,55%), reprodutibilidade (< 5,60%) e exatidão foram satisfatórias. Os valores de recuperação foram 84,51, 90,75, 95,37, 98,68 e 84,29% para L-tirosina, L-triptofano, L-lisina, tiramina e histamina, respectivamente. Este método tem sido aplicado com sucesso para a quantificação de aminoácidos precursores e aminas biogênicas em matrizes diversas.
Biogenic amines in high concentration can affect the quality of foods and cause several diseases since they are present in products like seafood, wines, and other fermented products. Shrimp by-products are a rich source of protein hydrolysate that can be used as dietary supplements. Samples (from shrimp by-products) of dry protein powder, liquid protein hydrolysate and flour of shrimp head were analyzed to evaluate the histamine and tyramine contents. Amines were extracted with trichloroacetic acid 5% and derivatized with o-phthaldialdehyde. The chromatographic separation was performed in an analytical column, Chrom SEP SS C18 5 µm (4.6 mm × 150 mm) and a fluorescence detector was used with wavelengths at λex = 335 nm and λem = 440 nm. The mobile phase was a mixture of tetrahydrofuran, methanol and phosphate buffer at a flow rate of 0.6 mL min-1
using elution gradient. Under these conditions, the repeatability (relative standard deviation, RSD < 6.55%), reproducibility (< 5.60%) and accuracy were of satisfying quality. The recovery values were 84.51, 90.75, 95.37, 98.68 and 84.29% for L-tyrosine, L-tryptophan, L-lysine, tyramine and histamine, respectively. This method has been successfully applied for the quantification of precursor amino acids and biogenic amines in different matrices.
Keywords: biogenic amines, o-phtaldialdehyde, shrimp by-products, HPLC, protein
hydrolysate
Introduction
Biogenic amines are organic bases of low molecular weight that can be formed or degraded as a result of normal metabolic activity of animals, plants and microorganisms.1 In some food products, such as fish,
seafood, cheese, meat, wine, and other fermented foods,
they are produced as a result of the descarboxylation from corresponding free amino acids by microbial activity.2-4
In reference to these food products, high concentrations of biogenic amines may cause headaches, respiratory distress, heart palpitation, hypertension or hypotension, and several allergenic disorders.5 Nevertheless, natural
stabilizers of DNA and RNA, metabolic regulators and nutrients.6
The estimation of high concentrations of histamine, tyramine, putrescine and cadaverine is of great importance, not only from a toxicity point of view, but as indicators of the degree of freshness or spoilage in food that is associated with inadequate sanitary conditions during the production procedures.7,8 The most widely used analytical methods for
identification and quantification of biogenic amines and amino acids are high performance liquid chromatography (HPLC) and capillary electrophoresis which are combined with different detection techniques like spectrophotometry, fluorometric, electrochemical and mass spectrometric.9-11
Due to the fact that most biogenic amines and amino acids have do not fluoresce properties, it is necessary to perform a chemical derivatization prior to fluorescence detection.12 Different derivatization reagents have been
tested, o-phthaldialdehyde (OPA) in combination with a thiol compound, such as 2-mercaptoethanol (MCE) that is the most employed.3-5 9-Fluorenylmethyl chloroformate
(FMOC-Cl) is another compound used for the detection of primary and secondary biogenic amines, but there are generation of undesirable compounds.10,13 Other chemical
derivatizing agents are phenyl isothiocyanate (PITC), dansylchloride and N-(9-fluorenylmethoxycarbonyloxy) succinimide.6 The response of some agent during the analysis
by HPLC is affected by the reaction time of the sample with the chemical derivatizing agent. This makes impossible to create sequences of injections in which the sample had been previously prepared. For this reason, it is necessary to develop automated methods in which an auto-sampler is responsible for carrying out the procedure of derivatization some minutes before the analysis, providing better accuracy.
Shrimp is one of the most consumed seafood in the world. In Sonora (Mexico), the shrimp production by aquaculture was 68500 tons in 2008. Only 65% of the shrimp is edible, the other 35% (cephalothorax and exoskeleton) is discarded and this can generate an environmental problem. This waste (the 35%) is a good source of protein and chitin. Several techniques have been developed to process the discarded parts, such as enzymatic and acid hydrolyzation, sun-drying and lactic fermentation. Lactic acid fermentation has been reported to be a workable and economical technique which will stabilize and retain the nutritional quality of the waste14.
With this technique, protein hydrolysate, chitin and lipids can be recovered. Several studies have reported the analysis of biogenic amines in seafood, for example, tuna,15 sardine,16 cold smoked salmon,17 and fermented fish
products.18 However, there is no reported study concerning
the biogenic amine content in shrimp waste. The purpose of
the present study is to develop and validate an automated method for the determination of biogenic amines and amino acids in powdered protein hydrolysate from shrimp waste using an HPLC method with o-phthaldialdehyde and 2-mercaptoetanol.
Results and Discussion
Biogenic amine and amino acid extractions
For the extraction of biogenic amines and their amino acid precursors, numerous reagents have been employed. For example, methanol 75%,3 perchloric acid 1 mol L-1 and
0.6 mol L-1,1,10,13 and tricholoroacetic acid (TCA)
5 and 10%.19-21 The preliminary assays show that the
best extraction was with TCA 5%. The volume of TCA 5% (5 and 10 mL), the time of vortex (60 and 90 s), sonication (1, 3 and 6 min) and centrifugation (15, 20 and 25 min) were recorded. The optimal results were achieved using 10 mL of TCA 5%, 90 s in vortex, sonication for 6 min and centrifugation for 15 min. For the determination of the amount of used sample in the extraction, different concentrations of protein hydrolysate powder (15, 30 and 50 mg) were applied. The assays indicated that 15 mg of dry powder was adequate for the analysis.
Derivatization procedure
Inthe derivatization of the biogenic amines and amino acids, a mixture of OPA/MCE was employed. The most important advantage of OPA over other derivatization reagents is that it quickly reacts with amines and enables the biogenic amines to be detected at low levels. The negative point here is that OPA reacts only with primary amines and leads to poorly stable compounds.7 OPA derivatization does
not show the presence of excess reagent (interfering with the analyte resolutions), which are detected when using FMOC derivatization methods.6 The OPA derivatives are
not stable, so, it was necessary to performer an automated precolumn derivatization. This was carried out prior to the injection in the auto-sampler.
Identification and separation
To determine the optimal chromatographic conditions for the determination of biogenic amines and amino acids, preliminary trials with standards were performed, as recommended by several researchers.1,2,6 The trials
were performed using different proportions of the eluent from proposed mobile phases by other research.22 With a
buffer (10 mmol L-1) (1:8:91) and mobile phase (B)
methanol:phosphate buffer (10 mmolL-1) (80:20), the
biogenic amines and amino acid peaks showed good separation. Additionally, in trials of three flow rates of the mobile phase (0.6, 0.9 and 1.0 mL min-1) and four different
column temperatures (35, 38, 40 and 42 °C), the better resolution of biogenic amines and amino acids was obtained at 38 °C with a flow rate of 0.6 mL min-1.
Biogenic amines and amino acids were identified through the comparison of their retention times with those times from stock standard solutions. Figure 1 shows the chromatograms of standard of biogenic amines and free amino acids (a) and shows chromatograms of the analytes in dry powder (b). Peak standards were observed at 26.24 ± 0.09 min for L-tyrosine, 32.45 ± 0.02 min for L-tryptophan, 28.84 ± 0.05 min for histamine, and 34.79 ± 0.02 min for L-lysine, while tyramine peaked at 35.29 ± 0.02 min, for an average of 10 injections. Peaks in dry powder were observed at 26.57 ± 0.09 min for L-tyrosine, 32.40 ± 0.02 min for L-tryptophan, 28.92 ± 0.05 min for histamine and 34.70 ± 0.02 min for L-lysine, while tyramine peaked at 35.20 ± 0.02 min, for an average of 10 injections.
Method validation
With this method, it is also possible to determine histidine, glutamine, tryptamine, cadaverine and putrescine
(information not shown), however, histidine and glutamine cannot be quantified due to the presence of interference in the sample, and the others biogenic amines are not present in the sample.
Quantification was performed by the external standard method based on the peak height of the eluted biogenic amines and amino acids. The linearity was evaluated using standard stock solutions of L-tyrosine, L-tryptophan, L-lysine, tyramine and histamine. The calibration curves were constructed for each amino acid and biogenic amine. In all cases, the relationships between concentrations and peak height were linear, with coefficients of determination greater than 0.999. The regression equations for the calibration plots for L-tyrosine, L-tryptophan, L-lysine, tyramine and histamine are shown in Table 1.
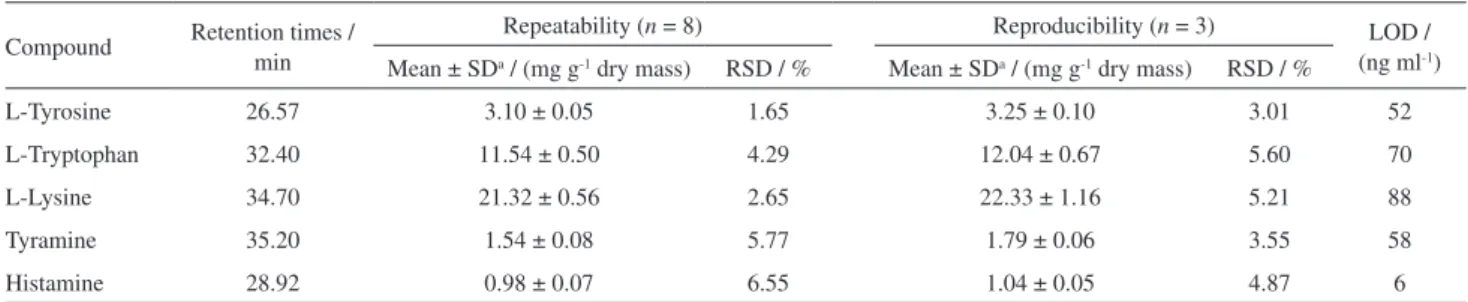
The repeatability and reproducibility of the method were evaluated. For repeatability, a total of eight injections of the same sample was performed by duplicate under optimum conditions during a working day, and three replicate analyses of the same sample were made on three different days to determine reproducibility. The relative standard deviations (RSD) were less than 7% for all compounds, for both reproducibility and repeatability. Considering these RSD values, the reproducibility and repeatability are satisfactory. These results indicate that this method can be applied as quantitative analyses of L-tyrosine, L-tryptophan, L-lysine, tyramine and histamine in a protein hydrolysate from the fermentation of shrimp waste. The limits of detection (LOD, defined as three times the basis of signal-to-noise ratio, as American Chemical Society Guidelines)23 for L-tyrosine, L-tryptophan,
L-lysine, tyramine and histamine were 52, 70, 88, 58 and 6.28 ng mL-1, respectively. Table 2 shows the results of the
test for repeatability, reproducibility and LOD.
The accuracy was estimated by means of recovery assays. For the recovery, eight samples of dry powder were spiked with a known concentration of the five components prior to extraction, derivatization and quantification. Table 3 shows the recovery of L-tyrosine, L-tryptophan, L-lysine,
Figure 1. HPLC chromatograms of standard of biogenic amines and free amino acids (a) and dry powder (b). Peaks identified: (1) histidine, (2) glutamine, (3) L-tyrosine, (4) histamine, (5) L-tryptophan, (6) L-lysine and (7) tyramine.
Table 1. Calibrations curves of L-tyrosine, L-tryptophan, L-lysine, tyramine and histamine
Compound Range / (µg ml-1)
Equation r2
L-Tyrosine 1.9-47.6 y = 139860x – 5628.6 0.9995 L-Tryptophan 2.8-64.4 y = 127676x – 10247 0.9990 L-Lysine 3.2-80.4 y = 77813x – 4290.8 0.9995 Tyramine 2.2-32.4 y = 498923x + 37931 0.9994 Histamine 0.6-9.6 y = 107963x – 2358.6 0.9990 x: amount (µg ml-1); y: peak area; r2: determination coefficient; samples
tyramine and histamine. These results are similar to those reported in previous works of biogenic amines and amino acids in meat and meat products,1 honey and wines.22
Concentration of histamine, tyramine and free amino acids in shrimp protein hydrolysate and flour of shrimp head
The quantity of L-tyrosine, L-tryptophan, L-lysine, histamine and tyramine in dry powder, liquid protein hydrolysate and the flour of shrimp heads were determined in separate preparations and analyzed from 5 different batches of each of the three samples. In the samples of liquid protein hydrolysate and dry powder, the free amino acid in the highest concentration was L-lysine. Meanwhile, for flour of shrimp heads, L-tyrosine was greater (Table 4). The mean contents of L-lysine were 10.36 ± 1.82 and 11.53 ± 1.09 mg g-1 dry matter in
liquid protein hydrolysate and dry powder, respectively. For flour of shrimp heads, the content of L-lysine was 9.64 ± 1.10 mg g-1dry matter. The sample that presented
the highest content of L-tyrosine was the flour of shrimp heads and the least was liquid protein hydrolysate. L-tyrosine is the direct precursor of tyramine, thus, a low level of L-tyrosine can be attributed to high level in tyramine.24 The
highest content of free L-tryptophan was in the flour of shrimp head and the smallest one was in liquid protein hydrolysate with a concentration of 8.95 ± 0.33 mg g-1dry matter. The
content of free L-tryptophan in hydrolysates principally depends on the fermentation process, because during
fermentation, the shrimp by-products are deproteinized by the produced proteolytic enzymes by the microorganism,25
the flour of shrimp head was also produced with all the shrimp, not only the heads. These results are higher than the reports in other publications.26 The concentration of these
amino acids varies with the specie of shrimp and the type of production process.
The highest content of histamine was in the flour of shrimp head, meanwhile in liquid protein hydrolysate was not detected. In dry powder, the mean concentration of histamine was 663 mg kg-1 dry matter. The production of
high levels of histamine is dependent on temperature and level of the availability of free histidine.3 The values of
histamine in this research are similar to that reported in other publication,27 in which a concentration of 579 mg kg-1
in fermented fish was found. Other authors analyzed shrimp paste for the concentration of histamine and found 1180 mg kg-1.18 The highest content of tyramine was in the
liquid protein hydrolysate, but the flour of shrimp head did not present this biogenic amine. Among biogenic amines in food, histamine is potentially hazardous and is the agent causing histaminic intoxication.1 The established limit
of the histamine level for fish is 50 mg kg-1 for the U. S.
Food and Drug Administration (US FDA) and 100 mg kg-1
for the European Union. However, there are no established levels for histamine and tyramine for by-products from shrimp waste. Also, there is no reported study for the biogenic amine content in protein hydrolysate from fermented shrimp waste.
Table 2. Precision of the method for determination of L-tyrosine, L-tryptophan, L-lisyne, histamine and tryramine
Compound Retention times / min Repeatability (n = 8) Reproducibility (n = 3) (ng mlLOD / -1) Mean ± SDa / (mg g-1 dry mass) RSD / % Mean ± SDa / (mg g-1 dry mass) RSD / %
L-Tyrosine 26.57 3.10 ± 0.05 1.65 3.25 ± 0.10 3.01 52
L-Tryptophan 32.40 11.54 ± 0.50 4.29 12.04 ± 0.67 5.60 70
L-Lysine 34.70 21.32 ± 0.56 2.65 22.33 ± 1.16 5.21 88
Tyramine 35.20 1.54 ± 0.08 5.77 1.79 ± 0.06 3.55 58
Histamine 28.92 0.98 ± 0.07 6.55 1.04 ± 0.05 4.87 6
Table 3. Recovery of free amino acid, histamine and tryramine from spiked dry powder
Compound Mean value /
(mg g-1 dry mass)
Amount addition / (mg g-1 dry mass)
Amount found / (mg g-1 dry mass)
Recovery / %b
RSD / %
L-Tyrosine 3.02 6.16 8.18 84.51 ± 2.08 2.46
L-Tryptophan 10.60 8.45 18.25 90.75 ± 2.99 3.29
L-Lysine 20.45 10.55 30.72 95.37 ± 4.74 4.97
Tyramine 1.61 0.68 2.30 98.68 ± 5.68 5.76
Histamine 0.98 3.05 4.03 84.29 ± 4.09 4.85
Conclusions
The conditions of transport and storage, thus as during the fermentation, can occur a protein hydrolysis, generating the amino acids that are more availability for a descarboxylation reaction. This HPLC method makes possible the identification of biogenic amines and amino acids in shrimp by-products and also promotes a sensitive, precise and accurate procedure for their quantification. The method would be very useful for the analysis of other foods and by-products fermented like measure of their sanitary and nutritional quality.
Experimental
Chemicals
O-phthaldialdehyde (OPA), 2-mercaptoetanol (MCE), sodium phosphate monobasic monohydrate, biogenic amines (histamine and tyramine) and amino acid standards (kit, LAA-21) were purchased from Sigma (St. Louis, MO, USA). HPLC-grade methanol (EDM, Darmstadt, Germany), hydrochloric acid and ethanol were from Fermont (Monterrey, Nuevo León, Mexico). Trichloroacetic acid (TCA) was obtained from Fluka (Seelze, Germany). All aqueous solutions were prepared with ultrapure water purified with a NANOpure Diamond UV system (Barnstead International, Dubuque, Iowa, USA). All reagents were of
analytical grade and the purity of the reference standards were > 98%.
Preparation of standard solutions and OPA/MCE solution
Stock standard solutions of L-tyrosine (476 µg mL-1),
L-tryptophan (644 µg mL-1), L-lysine (804 µg mL-1),
histamine (100 µg mL-1) and tyramine (540 µg mL-1)
were prepared in 0.1 mol L-1 hydrochloric acid. All stock
solutions were stored in dark and refrigerated at 4 °C, the stock standard solutions were prepared every two weeks. Working solutions were prepared from those solutions and diluted with 0.1 mol L-1 hydrochloric acid. Calibration
curves were constructed using six different concentrations of the standard solutions that were based in the level of the compounds in the dried protein hydrolysate.
The specific procedure for the solution preparation involved the dissolution of 250 mg of reagent in 1.5 mL of ethanol and the addition of 200 µl of 2-mercaptoethanol in a 10 mL volumetric flask. Then, this was diluted with 0.4 mol L-1 borate buffer solution (pH 10.5). The reagent
solution rested for 90 min before being used or stored at 4 °C.22
Sample preparation
For the method validation, a powder protein hydrolysate was employed, and for the assay of the method applicability
Table 4. Histamine, tryramine and free amino acid content in shrimp by-products
Sample L-tyrosine / (mg g-1)a
L-tryptophan / (mg g-1)a
L-lysine / (mg g-1)a
Tyramine / (mg kg-1)a
Histamine / (mg kg-1)a Liquid protein hydrolysate
1 4.88 8.62 11.39 5830 nd
2 5.37 8.49 10.53 4530 nd
3 4.10 9.25 11.42 4770 nd
4 3.91 9.27 12.09 4850 nd
5 4.80 9.01 9.71 4200 nd
Dry powder
1 4.63 11.09 10.19 770 810
2 4.62 9.01 11.61 1690 590
3 4.61 13.72 13.51 1870 590
4 4.29 8.93 11.13 950 nd
5 4.56 9.09 11.28 630 nd
Flour of shrimp heads
1 12.71 11.44 9.43 nd 1310
2 12.98 9.61 9.46 nd 1380
3 11.55 10.53 9.23 nd 1420
4 8.65 9.96 11.75 nd 1300
5 11.05 11.27 9.43 nd 1470
powder protein, liquid protein hydrolysate and flour of shrimp heads.
The production of the liquid protein and dry powder was performed following the developed methodology by Bueno-Solano et al.14 Briefly, for the production of
liquid protein hydrolysate, shrimp (Penaeus spp.) remnant samples (heads and cephalothoraxes) were used. Slightly thawed and minced remnants were fermented at 30 °C for 36 h. The silage was centrifuged (5 °C) at 1250 rpm for 15 min to obtain the chitin-rich fraction (sediment), the liquid protein hydrolysate and the lipid fraction.
For the dry powder production, the liquid hydrolysate rich in protein was dehydrated using a spray dryer SD-04 Lab Scale Spry Drier (LabPlant, Huddersfield, West Yorkshire, England). The liquid hydrolysate was transferred to a conical flask and placed in an electric grill at a constant 80 °C. The temperature of the air inlet was 180 °C and the air outlet was 140 °C. The speed of the peristaltic pump was minimized to produce a slow flow of fluid input (1 L h-1), the flow of
air in the chamber was 100%. The dry sample was collected in glass bottles with lids. For the production of the flour of shrimp heads, shrimp heads were dried on an electric oven (75 °C) overnight, then were milled and homogenized.
Extraction of biogenic amines and amino acids
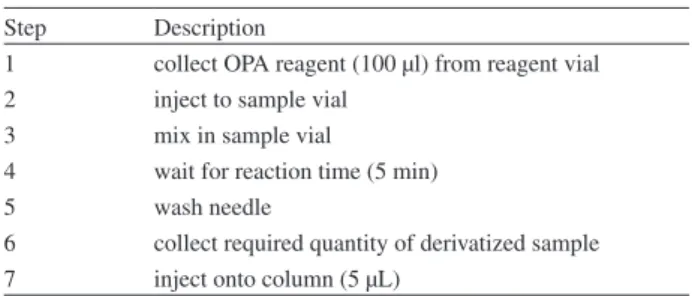
Samples were triturated and homogenized. The flour of shrimp heads (15 mg), powder protein (15 mg) and liquid hydrolysate (50 mg) were each placed in a 10 ml volumetric flask, diluted with 5% of TCA, mixed for 90 s and sonificated for 6 min. Then, 300 µL of the solution were diluted to 5 mL with methanol:water (50:50) in a volumetric flask. Finally, 1 mL of this solution was filtered with a 0.45 µm membrane. The derivatization was performed in the sample vial using an auto-sampler program. A description of the full auto-sampler program is shown in Table 5.
Equipment
The HPLC system (Varian, Melbourne, Victoria, Australia) was equipped with an auto injector 410, a Meta
Chem solvent degasser, a system controller with the Galaxie Workstation for chromatography data analysis, a pump 230 and a fluorescence detector 363, all of Varian. The chromatographic analysis was performed using an analytical scale (4.6 mm × 150 mm, 5 µm) Chromsep SS C18 column with a Chromsep guard column SS 10 × 3 mm and a particle size of 5 µm (Varian, Melbourne, Victoria, Australia).
Chromatographic conditions
The mobile phase was similar to those used by Pereira et al.,22 mobile phase (A) tetrahydrofuran:metha
nol:phosphate buffer (10 mmol L-1) (1:8:91) and mobile
phase (B) methanol:phosphate buffer (10 mmol L-1)
(80:20), filtered through a 0.45 µm membrane and degassed. The HPLC conditions were flow rate of 0.6 ml min-1,
column temperature of 38 °C and volume of injection of 5 µL for all standard solutions. The gradient program was (min/A%/B%): 0/75/25, 8/75/25, 12/67/33, 25/50/50, 30/0/100, 35/67/33 and 43/75/25. For the detection of amino acids and biogenic amines, the optimal wavelengths were λex = 335 nm and λem = 440 nm, with a total time of
the analyses of 43 min.
Statistical analysis
The SPSS 11.0 Windows program constructed the statistical analyses, (SPSS Inc., Chicago, IL). The relative standard deviation (RSD) is the ratio standard deviation/ average, expressed as percentage.
Acknowledgements
This research was financed under project No. SON-2004-C03-016 with mixed funds from Government of the State of Sonora and the National Council for Science and Technology (FOMIX-CONACYT). Michael A. Bryan, M. B. A. and Native English Professor offered suggestions and improvements in the wording of this manuscript.
References
1. Hernández-Jover, T.; Izquierdo-Pulido, M.; Veciana-Nogués, M. T.; Mariné-Font, A.; Vidal-Carou, M. C.; J. Agric. Food Chem. 1996, 44, 2710.
2. Kirschbaum, J.; Luckas, B.; Beinert, W. D.; J. Chromatogr., A
1994, 661, 193.
3. Antoine, F. R.; Wei, C. I.; Littell, R. C.; Quinn, B. P.; Hogle, A. D.; Marshall, M. R.; J. Food Sci. 2001, 66, 72.
4. Landete, J. M.; Ferrer, S.; Polo, L.; Pardo, I.; J. Agric. Food Chem. 2005, 53, 1119.
Table 5. Auto-sampler program for derivatization
Step Description
1 collect OPA reagent (100 µl) from reagent vial 2 inject to sample vial
3 mix in sample vial
4 wait for reaction time (5 min)
5 wash needle
5. Kalkan Y, H.; Üren, A.; Yücel, U.; Food Technol. Biotechnol.
2007, 45, 62.
6. Lozanov, V.; Petrov. S.; Mitev, V.; J. Chromatogr., A 2004, 1025, 201.
7. Alberto, M. R.; Arena, M. F.; Nadra, M. C. M. In Public Health Microbiology Methods and Protocols; Spencer, J. F. T.; Spencer, A. L. R., eds.; Editorial Humana Press Inc.: New Jersey, 2004, p. 481-487.
8. Galgano, F.; Favati, F., Bonadio, M.; Lorusso, V.; Romano, P.;
Food Res. Int. 2009, 42, 1147.
9. Shakila, R. J.; Vasundhara, T. S.; Kumudavally, K. V.; Food Chem. 2001, 72, 255.
10. Lozanov, V.; Benkova, B.; Mateva, L.; Petrov, S.; Popov, E.; Slavov, C.; Mitev, V.; J. Chromatogr., B: Anal. Technol. Biomed. Life Sci. 2007, 860, 92.
11. Cortacero-Ramírez, S.; Arráez-Román, D.; Segura-Carretero, A.; Fernández-Gutiérrez, A.; Food Chem. 2007, 100, 383. 12. Borboa, B. M.; Rohrer, J. S.; J. Chromatogr., A 2007, 1155, 22. 13. Bauza, T.; Blaise, A.; Daumas, F.; Cabanis, J. C.; J. Chromatogr., A
1995, 707, 373.
14. Bueno-Solano, C.; López-Cervantes, J.; Campas-Baypoli, O. N.; Lauterio-García, R.; Adan-Bante, N. P.; Sánchez-Machado, D. I.; Food Chem. 2009, 112, 671.
15. Veciana-Nogués, M. T.; Mariné-Font, A.; Vidal-Carou, M .C.; J. Agric. Food Chem. 1997, 45, 2036.
16. Gökoglu, N.; Cengiz, E.; Yerlikaya, P.; Food Chem. 2004, 15, 1.
17. Dondero, M.; Cisternas, F.; Carvajal, L.; Simpson, R.; Food Chem. 2004, 87, 543.
18. Tsai, Y.; Lin, C.; Chien, L.; Lee, T.; Wei, C.; Hwang, D.; Food Chem. 2006, 98, 64.
19. Rezaei, M.; Jafari, H.; Sahari, M .A.; Hosseini, H.; Montazeri, N.; Parviz, M.; Nazarinia, A.; J. Food Biochem. 2006, 31, 541. 20. Katikou, P.; Georgantelis, D.; Paleologos, E. K.; Ambrosiadis,
I.; Kontominas, M. G.; Food Chem. 2006, 54, 4277.
21. Marks, H. I.; Anderson, C. R.; J. Chromatogr., A 2005, 1094, 60.
22. Pereira, V.; Pontes, M.; Câmara, J. S.; Marques, J. C.;
J. Chromatogr., A 2008, 1189, 435.
23. American Chemical Society (ACS), Subcommitee of Environmental Analytical Chemistry; Anal. Chem. 1980, 52, 2242.
24. Izquierdo Cañas, P. M.; García, R. E.; Gómez, A. S.; Fernández, G. M.; Palop, H. M. L. L.; J Food Compos. Anal. 2008, 21, 731. 25. Rao, M. S.; Muñoz, J.; Stevens, W. F.; Appl Microbiol.
Biotechnol. 2000, 54, 808.
26. Sánchez-Machado, D. I.; Chavira-Willys; B.; López-Cervantes, J.; J. Chromatogr., B: Anal. Technol. Biomed. Life Sci. 2008, 863, 88.
27. Mah, J.; Han, H.; Oh, Y.; Kim, M.; Hwang, H.; Food Chem.
2002, 79, 239.
Submitted: October 22, 2010