i
Faculdade de Engenharia da Universidade do Porto
Dynamic Distribution System Reconfiguration to
Improve System Reliability Considering
Renewables and Energy Storage
Cláudio Miguel Marques Pinto dos Santos
Dissertação realizada no âmbito do
Mestrado Integrado em Engenharia Eletrotécnica e de Computadores
Major Energia
Orientador: Prof. Doutor João Paulo da Silva Catalão
Coorientador: Doutor Sérgio F. Santos
ii
iii
Resumo
O desenvolvimento económico e o crescente uso de novas tecnologias por parte dos consumidores fazem com que o fornecimento de energia, bem como a qualidade da mesma, se torne uma séria preocupação. Uma forma de abordar essa preocupação é implementando sistemas de distribuição automatizados com tecnologias inteligentes para melhorar a fiabilidade e a eficiência da operação de sistema. Os sistemas elétricos atuais estão em evolução devido às novas funcionalidades que o sistema elétrico deverá ter, nomeadamente a integração de fontes de energia renováveis em grande escala, a integração de veículos elétricos, a implementação de tecnologias de redes inteligentes, entre outras. Neste cenário, os Sistemas de Distribuição Inteligentes (SDI) devem operar e restaurar o serviço interrompido aos consumidores. Para que o sistema ganhe esta capacidade, é necessário substituir os interruptores manuais por interruptores controlados de forma remota, melhorando a capacidade de restauração do sistema tendo em vista a implementação de redes inteligentes. Este trabalho tem como objetivo desenvolver um novo modelo, determinando o conjunto mínimo de interruptores a substituir para automatizar o sistema, juntamente com uma análise de sensibilidade sobre a posição dos novos interruptores, que podem ser colocados no mesmo local dos substituídos ou num novo local. Neste trabalho as topologias são também otimizadas tendo em conta índices de fiabilidade e perdas de energia. A otimização do sistema é feita considerando a integração de fontes de energia renováveis na rede e sistemas de armazenamento de energia, simultaneamente com os requisitos económicos e funcionais do sistema. A ferramenta computacional é testada usando o sistema de teste IEEE 119 Bus, onde são considerados vários tipos de carga (residencial, comercial e industrial).
Palavras-chave— Automação de Distribuição, Sistemas de Distribuição Inteligentes, Fiabilidade, Redes Inteligentes, Restauração de Serviço
iii
Abstract
Economic development and the use of more and more technologies by consumers pushing upwards the demands of consumers for reliable and quality energy supply. And, this is becoming critical concern for service providers. The increasing penetration of variable energy sources is even exacerbating the situation further; system operators in general are finding it increasingly difficult to deliver energy that meets the standards set by regulators and consumers themselves. Novel solutions should be at the system operators’ disposal, particularly at distribution levels. One way to partly address this concern is through the implementation of automated distribution systems with intelligent technologies which improves the systems reliability and efficiency during operation. The present electrical systems are evolving due to the new functionalities that the electrical system is expected to have, namely the integration of renewable energy sources in large-scale, the integration of electric vehicles, enable smart grid technologies, among others. In this scenario, Distributed Smart Systems (DSSs) should operate and restore discontinued service to consumers. In order for the system to gain such ability, it is necessary to replace the manual switches for remotely controlled switches, improving the system restoration capability having in view the Smart Grids implementation. This thesis aims to develop a new model, determining the minimal set of switches that have to be replaced in order to automate the system, along with a sensitivity analysis on the position of the new switches, whether it should be placed in the same place as the manual switch or in a new location. In this work, different topologies are assessed taking into account different reliability indices and power losses. The optimization of the system is made considering the renewable energy sources integration in the grid, energy storage systems simultaneously with the economic and functional requirements of the system, in order to improve the system reliability. The computational tool is tested and validated on the IEEE 119 Bus test system, where different types of load are considered (residential, commercial and industrial).
Keywords—Distribution Automation, Distributed Smart Systems, Reliability, Self-healing, Smart Grid, Service Restauration.
iii
Acknowledgements
The realization of this thesis would not have been possible without the collaboration of numerous people, to which I would like to express my sincere thanks.
To my parents, a huge thank you for all that you did for my education, you have always been a heavy support regarding my walk to a successful engineer. Without a doubt without them I would not be here.
It is with great pleasure that I thank Professor João Catalão for the opportunity given with this work area of greatest interest and recent development. To Sergio Santos and Desta Fitiwi, I must thank for always being available, for the patience and for all that I have learned in the last months.
Thanks to the institution Faculdade de Engenharia da Universidade do Porto (FEUP) for providing me with services of undeniable quality, and brutal teaching conditions, essential for the creation of a successful engineer. Also, a thank you to all the teachers who participated in my curricular path and who have always been willing to contribute to the maximum so that I became a quality engineer.
To Filipa, also finishing its master’s degree at FEUP, thank you for the last two years, you have been always there with me, helping me when I needed the most.
Finally, a huge hug to all those who were with me over the last 5 years, those who saw me become an engineer and who became engineers with me. To all the stories that have been created on this journey, from moments of party to moments of study and work. We will soon cease to be students, but academic life will run in our veins forever. Thank you all.
iii
Contents
Resumo ... iii
Abstract ... v
Acknowledgements ... vii
Contents ... ix
List of Figures ... xiii
List of Tables ... xv
Abbreviation and Symbols ... xvii
Chapter 1 ... 1
Introduction ... 1 1.1 Background ... 1 1.2 Problem Definition ... 3 1.3 Research Objectives... 3 1.4 Research Methodology ... 4 1.5 Thesis Structure ... 4Chapter 2 ... 5
State of Art ... 52.1 Distribution System Reconfiguration (DSR) ... 5
2.1.1 Introduction and Definition ... 5
2.1.2 Technology and Requirements ... 6
2.1.3 Advantages and Challenges ... 7
2.1.4 Switching Frequency ... 7
2.2 Renewable Energy Sources (RES) ... 8
2.2.1 The Need for Change ... 8
2.2.2 RESs-based DGs Integration Challenges ... 9
2.2.3 DGs Size and Installation Optimization ... 9
2.2.4 RES-based DGs Integration: current world position... 10
2.3 Energy Storage Systems ... 11
2.3.1 The need for ESSs ... 11
2.3.2 ESSs Challenges ... 11
2.3.3 Technology and Operation ... 12
x
2.4.1 Restoration of the Electric Power System ... 13
2.4.2 The Smart-grid and the Self-healing ... 14
2.4.3 Switches ... 15 2.5 Bibliographic Review ... 16 2.6 Chapter Summary ... 18
Chapter 3 ... 19
Mathematical Formulation ... 19 3.1 Objective Function ... 19 3.2 Constraints ... 21 3.2.1 Kirchhoff’s Law ... 213.2.2 Kirchhoff’s Voltage Law ... 21
3.2.3 Power Limits ... 22
3.2.4 ESSs model ... 22
3.2.5 Renewable Generation Power Limits ... 23
3.2.6 Conventional Generation Power Limits ... 23
3.2.7 Radiality Constraints ... 23 3.3 Reliability Indices ... 24 3.3.1 SAIFI ... 24 3.3.2 SAIDI... 25 3.4 TOPSIS Formulation ... 25 3.5 Chapter Summary ... 27
Chapter 4 ... 29
Case Study, Results and Discussion ... 29
4.1 System Data and Assumptions ... 29
4.2 Scenarios Description ... 31
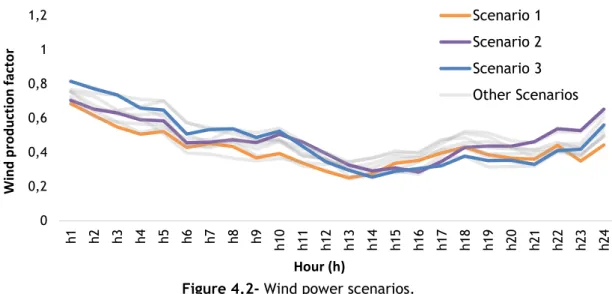
4.2.1 Wind Power Scenario ... 32
4.2.2 Solar Power Scenario ... 32
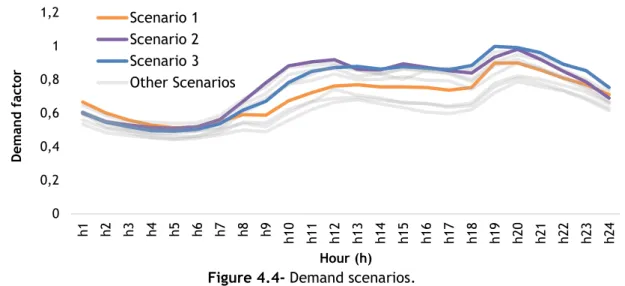
4.2.3 Demand Scenario ... 33
4.3 Dynamic Reconfiguration Results and Energy Mix ... 33
4.3.1 Hourly Dynamic Reconfiguration Results ... 33
4.3.2 Production and Consumption Profiles ... 35
4.4 Automation Update ... 36
4.5 Reliability Analysis ... 39
4.5.1 SAIFI ... 39
4.5.2 SAIDI... 40
4.5.3 Active Power Losses ... 41
4.5.3 Multi-Objective Optimization ... 42
4.6 Chapter Summary ... 44
Chapter 5 ... 45
Conclusion and Future Works ... 45
5.1 Conclusions ... 45
5.2 Future Works ... 46
5.3 Works Resulting from this Dissertation ... 47
Appendices ... 49
Appendix A ... 51
Appendix A.1 - Line Losses Linearization ... 51
Appendix B ... 53
Appendix B.1- System Data ... 53
Appendix B.2- Distributed Generation Nodes ... 57
Appendix B.3- Energy Storage System Nodes ... 58
iii
Publication ... 59
iii
List of Figures
Figure 1.1- Future smarter infrastructure grid technologies [1]. ... 2
Figure 2.1- DSR contributes to improve system reliability. ... 6
Figure 2.2- RESs-based energy generation annual capacity [5]... 8
Figure 2.3- Installed energy storage capacity worldwide in 2016 [28]. ... 13
Figure 2.4 - Accidents that cause network failure [46]. ... 14
Figure 2.5 - Distribution automation system structure. ... 16
Figure 4.1- 119 Bus test system. ... 31
Figure 4.2- Wind power scenarios. ... 32
Figure 4.3- Solar power scenarios. ... 32
Figure 4.4- Demand scenarios. ... 33
Figure 4.5- Production and consumption per hour. ... 36
Figure 4.6- Production and consumption profile without ESS’s. ... 36
Figure 4.7- Lines that actively participate in reconfiguration. ... 37
Figure 4.8- Switches actions per line. ... 37
Figure 4.9- Lines with more switches actions than the average. ... 38
Figure 4.10- SAIFI hourly values. ... 39
Figure 4.11- SAIFI: hourly and average values. ... 40
Figure 4.12- SAIDI hourly values. ... 40
Figure 4.13- SAIDI: hourly and average values. ... 41
Figure 4.14- Active power losses per hour. ... 41
iii
List of Tables
Table 2.1- Differences between the traditional network and the smart grid [20]. ... 15
Table 4.1- Costs and losses optimization results. ... 34
Table 4.2- Reconfiguration results. ... 34
Table 4.3- Reconfiguration results (continuation). ... 35
Table 4.4- Lines to automate. ... 38
Table 4.5- Cases for analysis and optimization of reliability indices. ... 43
iii
Abbreviation and Symbols
List of Abbreviations
CAIDI Customer Average Interruption Duration Index DDSR Dynamic Distribution System Reconfiguration DER Distributed Energy Resources
DG Distributed Generation DN Distribution Network
DSR Distribution System Reconfiguration ESS Electrical Storage System
EPS Electrical Power System EU European Union
LCC Life Cycle Cost
NEDO New Energy and Industrial Technology Development Organization PCS Power Converter System
RCS Remote Control Switch RES Renewable Energy Sources
SAIDI System Average Interruption Duration Index SAIFI System Average Interruption Frequency Index TCC Total Capital Cost
TOPSIS Technique for Order of Preference by Similarity to Ideal Solution
List of Symbols
Sets/Indices𝑠/Ω𝑠 Index/set of scenarios
ℎ/Ωℎ Index/set of hours
𝑔/Ω𝑔 Index/set of generators
𝑒𝑠/Ω𝑒𝑠 Index/set of energy storage
𝜍/Ω𝜍 Index/set of substations
xviii
Parameters
𝜌𝑠 Probability of scenario s
𝑂𝐶𝑔 Cost of unit energy production
𝜆𝐶𝑂2 Emission rate of Substation 𝐸𝑅𝑔𝐷𝐺 Emission rate of DG’s
𝐸𝑅𝜍𝑆𝑆 Emission rate of energy purchased from substation
𝑃𝐷𝑠,ℎ𝑛 Demand at node n (MW)
𝑄𝐷𝑠,ℎ𝑛 Demand at node n (MVAr)
𝑉𝑛𝑜𝑚 Nominal voltage (kV)
𝜂𝑒𝑠𝑐ℎ Charging efficiency
𝜂𝑒𝑠𝑑𝑐ℎ Discharging efficiency
𝐸𝑒𝑠,𝑛𝑚𝑖𝑛 Energy Storage limit
𝐸𝑒𝑠,𝑛𝑚𝑎𝑥 Energy Storage limit
𝜇𝑒𝑠 Scaling factor
𝑃𝑔,𝑛,𝑠,ℎ𝐷𝐺,𝑚𝑖𝑛, 𝑃𝑔,𝑛,𝑠,ℎ𝐷𝐺,𝑚𝑎𝑥
Power generation limits (MW)
𝑝𝑓𝑔 Power factor of DG’s
𝑝𝑓𝑠𝑠 Power factor of substation
Variables
𝑃𝜍,𝑠,ℎ𝑆𝑆 , 𝑄𝜍,𝑠,ℎ𝑆𝑆 Imported power from grid (MW, MVAr)
𝐸𝑒𝑠,𝑛,𝑠,ℎ Reservoir level of ESS (MWh)
𝐼𝑒𝑠,𝑛,𝑠,ℎ𝑑𝑐ℎ , 𝐼𝑒𝑠,𝑛,𝑠,ℎ𝑐ℎ Charging and discharging binary variables
𝑃𝑔,𝑛,𝑠,ℎ𝐷𝐺 , 𝑄𝑔,𝑛,𝑠,ℎ𝐷𝐺 DG power (MW, MVAr)
𝑃𝜍,𝑛,𝑠,ℎ𝑆𝑆 Imported power from grid (MW)
Δ𝑉𝑛,𝑠,ℎ Voltage deviation magnitude (kV)
𝜒𝑙,ℎ Binary switching variable of line l
𝑓𝑙,ℎ Fictitious current flows through line l
𝑔𝑛,ℎ𝑆𝑆 Fictitious current injections at substation nodes 𝑑𝑛,ℎ Fictitious nodal demand
𝑛𝐷𝐺 Number of candidate nodes for installation of distributed generation
Functions
SWC Switching cost term (€)
TEC operation cost (€)
TENSC Power not supplied cost (€)
1
Chapter 1
Introduction
This chapter presents a brief introduction to the topic, the problem definition and motivation, and the research objectives. This chapter also presents the methodology used in the work as well as the structure of the dissertation.
1.1 Background
Over the last century, the structure of the electric power system has been viewed, from the operation point of view, as a hierarchical structure. This traditional way of looking at the electric power system has 4 levels: production, transmission, distribution and consumption. This hierarchical system implies that the energy flow is unidirectional, from the highest levels of the hierarchy (large-scale production) to the lowest levels (consumption), both interconnected by the intermediate levels transport and distribution. This has several advantages, namely in terms of the production efficiency of large plants and the simplicity of transport and, above all, distribution. However, this structure has some disadvantages:
• The long distance between the points of production and consumption causes large infrastructural expenses on transmission networks and increases energy losses by transmission, which are as big as the distance traveled;
• Usually large production plants exploit resources that cause major environmental damage with the emission of harmful gases into the atmosphere, thus increasing the negative environmental impact;
• The networks hierarchical structure implies that, if there is a problem at a higher level, a large part of the network and its elements at lower levels are also affected.
2 Introduction
It is in this context that, in recent years, a change of perspective of the electric energy system arises. The substantial increase in the interest of exploring more and more renewable energy sources is not compatible with the conventional form of the electrical system, so a restructuring of the electrical industry was necessary, which led to the separation of the different sectors previously integrated vertically, favoring the access to networks and creating competitive markets. Thus, the evolution to a liberalized market, along with the benefits of renewable exploration, has led the world governments to actively promote the adoption of distributed generation.
Recent technological developments have also contributed to the development of well-adapted applications in the field of distributed generation (wind generators and photovoltaic panels), but not only. From the technical point of view, the increasing penetration of distributed generation has strong implications such as problems at the stability levels of the operation and changes on the voltage profiles, resulting from the injection of energy into the distribution networks. As possible solutions to some of these problems, other technologies of interest appeared to improve the system’s stability and reliability. An example of such technologies are energy storage systems, which together with the increasing penetration of renewable energy sources based distributed generation (RESs-based DGs) have helped to make the system smarter, moving more and more towards what it is today called a smart grid.
Another developed technology that helps this transformation and increases the system automation was the creation of the remotely controlled switches. Replacing the manual switches with these smart switches helps increase system reliability. The restoration of networks is a very important technique and must be done as quickly as possible so as not to compromise the energy supply to consumers. In Figure 1.1 are presented several key technologies and important aspects to develop the future smarter infrastructure grid.
Thus, it has been concluded that the distribution system automation has become very important in recent years in an attempt to make the grid as reliable as possible, while at the same time increasing in renewable energies exploitation.
Problem Definition 3
1.2 Problem Definition
The economic development and the increase use of new technologies by consumers make the energy supply and the quality of energy a serious concern. One way to address this concern is to implement automated distribution systems with intelligent technologies to improve the reliability and efficiency of system operation. Current electrical systems are evolving due to the new features that the electrical system should have, namely the integration of large-scale renewable energy sources, the integration of electric vehicles, the implementation of smart grid technologies, among others. At the same time, there is the integration problem of RESs, especially with regard to the uncertainty and variability of these resources that affect the operation of the system on a large scale.
In this scenario, intelligent distribution systems must operate and restore the discontinued service to consumers. In order for the system to gain this capability, it is necessary to replace the manual switches with remotely controlled switches, improving the system restoration capability for the implementation of smart grids. Therefore, one of the problems is how identify the minimum set of switches to be updated from manual to automatic based on dynamic reconfiguration. Once the previous problem is solved, a new problem arises in terms of system operation due to the new network topological options. Which is the best topology to be used considering several reliability indices and system power losses at different hours throughout the day?
In this framework it is therefore necessary to develop operational models to solve the problems raised taking into account the system operational, economic and reliability constraints as well as meet international environmental objectives.
1.3 Research Objectives
The main objectives of this dissertation are:
• To develop an improve stochastic mixed integer linear programming (SMILP) operation model considering the presence of Distributed Generation based renewables, Energy Storage Systems and dynamic reconfiguration.
• Create a methodology on the system sensitivity analysis to identify the minimum set of switches to be updated from manual to automatic based on dynamic reconfiguration.
• Identify whether the automate switches will be placed, if only in places were manual switches exist or also in other places.
• Identify switches that require more maintenance due to dynamic reconfiguration.
4 Introduction
• To study and optimize the network different topologies taking into account different reliability indices (System Average Interruption Duration Index- SAIDI- and System Average Interruption Frequency Index- SAIFI) and power losses.
1.4 Research Methodology
The proposed optimization model is a stochastic mixed integer linear programming (SMILP) type, for which there are quite many efficient off-the-shelf solvers. The model aims to optimally operate distribution network systems, featuring large-scale DERs, during the course of a day (i.e. over a period of 24-hours). The problem is programmed in GAMS 24.0 and solved using the CPLEX 12.0 solver. All the simulations are conducted in an HP Z820 workstation with two E5-2687W processors, each clocking at 3.1GHz frequency, and 256 GB of RAM.
1.5 Thesis Structure
This dissertation is divided in six chapters. Chapter 2 presents the state of art and the related concepts on the topic being studied. In Chapter 3 it is established the mathematical model developed, from the objective functions to the constraints used. Chapter 4 lists the electrical system data used, as well as all the assumptions taken to solve the problem. All the results of the simulations are presented and discussed in Chapter 5. Finally, Chapter 6 highlights the main conclusions of this work, the future works that can be done as well as the contributions of this dissertation.
5
Chapter 2
State of Art
This chapter presents the state of art and the concepts related to the automation of the electrical distribution system, with respect to the Distribution System Reconfiguration (DSR), in the presence of Renewable Energy Sources (RESs) and Energy Storage Systems (ESSs), as well as the electrical system transformation and restoration process. Finally, an overview of the bibliographic review is also presented, focusing on the works most directly related to the present work, where the contribution of this work is evidenced in relation to those present in the bibliography.
2.1 Distribution System Reconfiguration (DSR)
2.1.1 Introduction and Definition
The distribution network is the electrical power system infrastructure section responsible for connecting the energy coming from the transmission network to the final consumers. The operation of these systems comes with a set of challenges, namely in terms of power losses. The power losses in the distribution network represent about 60-70% of the total losses in the electrical power system, which means that the reduction of those losses is a major priority in operational and economical terms. In addition, the increasing integration of variable loads and RES make conventional system operation strategies less efficient and more difficult to operate. One of the solutions to minimize the losses and help to integrate more RESs is the DSR [2]–[4].
DSR can be defined in a generic way, as a set of real-time procedures performed in order to lead to the change of the electrical network topology, so that it better adapts to the changes occurred in the energy production and/or consumption. These changes are ensured by the switching operations of the various switches installed in the network that enable or disable specific branches [4]–[9].
6 State of Art
DSR objectives can have several objectives, such as [10]: • Power losses reduction;
• Reliability improvement;
• Line maintenance costs reduction; • Energy quality improvement;
• Voltage stability margin improvement.
2.1.2 Technology and Requirements
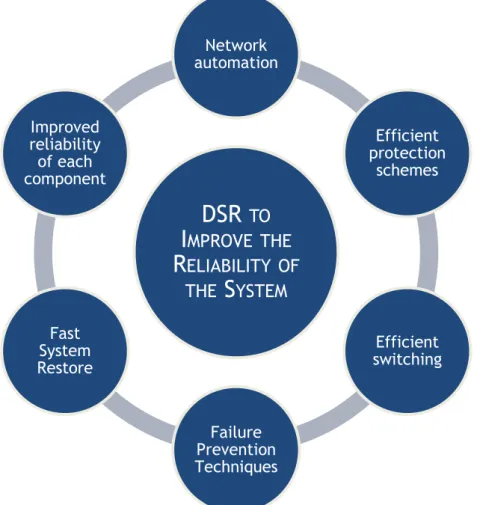
As mentioned earlier, DSR is ensured by the switches installed in the network, which allow to change the topology of the distribution network. There are two types of switches: those normally open, known as tie switches, and those that are normally closed, the sectionalized switches. DSR can operate both in normal or emergency conditions and, although it was created with the purpose of obtaining a network radial topology that leads to the least losses possible, today is also used to reduce system interruptions that affect consumers, with the goal to improve the system global reliability. The DSR contributes to improve system reliability can be seen in Figure 2.1. [11]:
Figure 2.1- DSR contributes to improve system reliability.
DSR
TO
I
MPROVE THE
R
ELIABILITY OF
THE
S
YSTEM
Network
automation
Efficient
protection
schemes
Efficient
switching
Failure
Prevention
Techniques
Fast
System
Restore
Improved
reliability
of each
component
Advantages and Challenges 7
2.1.3 Advantages and Challenges
Reconfiguration is an important task since by changing the grid topology it allows the operator to reduce the operational power losses as well as allows the network to accept a greater amount of RESs, unlike static networks. Furthermore, it also helps the network operator to avoid network capacity violations or overvoltage’s. At the distribution network level, DSR can also help the network operator to restore service after accidents that lead to service failure and help prevent other service interruptions and corresponding penalties. In the case of networks with DGs, reconfiguration can also help reduce losses and prevent current and voltage violations that may be caused by the presence of DGs itself [9], [11], [12].
A reconfigurable network can change its topology by switching operations, whose positions determine the active or inactive operation of a line. However, the network topology depends on several parameters and needs to be updated according to the data received on a daily, weekly, monthly or seasonal basis, to be correctly adapted to the changes it is subjected to throughout its operation [6]–[8], [10], [13], [14].
DSR has had as its main objective the reduction of electrical power losses. However, when considering real-time automatic reconfiguration (dynamic reconfiguration), there are some challenges to consider, such as [15]:
• A cost-benefit relationship needs to be established to determine the need and the effectiveness of the reconfiguration;
• The network must be flexible enough to allow reconfiguration;
• The technical viability of the switching operations must be studied in real time, considering the availability of real-time measurements of the network. Agents involved in a distribution network can be identified by buses where power is injected or consumed and lines, which serve as a link between several buses [13].
2.1.4 Switching Frequency
The DSR has a great economic potential of cost reduction if the switching operations are optimized for an optimum frequency. In order to analyze daily, weekly, monthly, and seasonal reconfiguration plans for a consecutive year, studies were carried out in which manual switches were replaced by intelligent control switches and, according to the results, the changing of the switching frequency led to great economic savings [10].
8 State of Art
2.2 Renewable Energy Sources (RES)
2.2.1 The Need for Change
Recently, the introduction of RESs has become a global need, given the great technical, economic and environmental advantages of its integration [16]–[20]. Three of the main reasons for this shift in the energy paradigm are [21]:
1. Environmental problems leading to increasing concerns;
2. The large transmission distances between production and consumption points, which result in high electrical power losses;
3. The demand increase that leads to more congestion in feeders.
As the years pass by, there are more and more government measures in countries all around the world that are conducting their efforts with the common goal of replacing all large traditional fossil-based power plants with RES-based generating units [21], [22].
One technique used to reduce energy losses in the distribution system is the interconnection of a local generation unit, since a production closer to consumption will reduce the losses that normally occur in the transport of energy between generation and consumption points. Examples of these local production units are the small generators that exploit renewable energy resources (mainly solar and wind farms, but also mini-hydro and biomass). Typically, this type of generation is known as distributed generation, which consists of lower power generators that are strategically connected directly to the distribution network [5], [17]–[19], [21], [22]. The energy generated from RES-based DGs is constantly growing, as [5] shows in Figure 2.2.
This growth is expected to continue, with RES penetration expected to exceed 25% of the total energy capacity generated soon in developed countries. Studies also show that the use of RES can reduce carbon emissions by 60% by the year 2050 [5].
Figure 2.2- RESs-based energy generation annual capacity [5]. 0 2000 4000 6000 8000 10000 12000 14000 16000 18000 2009 2010 2011 2012 2013 2014 2015 R e ne wa b le D ist ri b ute d Ener gy G e ne ration Cap ac ity (MW)
RESs-based DGs Integration Challenges 9
Traditionally, the DGs was dedicated to the energy production close to the loads or in an isolated way, being defined as a source of energy directly connected to the distribution network or to the consumer. However, DGs are becoming increasingly important in the context of the energy production decentralization and the high RESs penetration, contributing to the network with technical, economic and environmental benefits. Among them [23]:
• Power losses reduction in feeders; • Voltage levels stability improvement; • Fuel cost reduction;
• Independence of large traditional producers; • Lower electricity price;
• CO2 emissions reduction
2.2.2 RESs-based DGs Integration Challenges
Given the passive configuration of the distribution networks, integrating DGs on a large scale is not technically feasible, since it brings major challenges for the system operation, especially in terms of energy quality and stability [16], [17]. Therefore, the disadvantages of integrating DGs into the network are due to the changes in the distribution system, since in most cases the network isn’t technically prepared to receive de DGs or to lead with the effects of its integration. The main challenges for the RES-based DG integration are [23]:
• Bi-directional power flow;
• Higher system frequency oscillations;
• Need to redesign all network protection systems;
• Uncertain production (due to the stochastic nature of the sources).
These limitations can, however, be mitigated as soon as the distribution networks complete its evolution process to active grids (smart grids) [16].
2.2.3 DGs Size and Installation Optimization
Given the technical-economic factors, the integration of RESs in the electrical system cannot be delayed [24]. However, although the use of RESs contributes positively to the environment, they also contribute to considerable uncertainty as regards to the energy production.
Therefore, it’s very important for the distribution system that optimal models are developed to best resolve DG planning. In case of an energy demand rise, distribution companies invest in feeders, DG units or any combination of them. One of the great challenges is the optimally allocating and dimensioning of the new DG units in the network [17], [18], [21]–[23], [25].
10 State of Art
Given the challenges that come with the high RESs penetration, their integration into the network still requires adaptation processes to improve network flexibility. From the network stability and reliability perspective, the integration of RESs-based DG creates major technical challenges, given the great variability of operation that makes it difficult to control the planning and operation of the system. In this context, mathematical models are developed considering the design and location of ESSs and reactive power sources that, together, favor the penetration of RESs. In addition, energy losses, carbon emissions and their costs can be reduced, and the network can also benefit from an improved voltage stability [17], [26].
2.2.4 RES-based DGs Integration: current world position
The need for electricity is increasing, given the fast fossil resources depletion that have always been exploited as the main source of energy. Moreover, the fact that a large number of producing countries are located in unstable geopolitical areas, together with global warming, lead to the search for new energy sources [18], [27].
In this context, governments all over the world direct all their efforts in an attempt to promote the RESs exploitation, since they are resources with no shelf life and that they don’t have great risks of accident associated with their exploitation and maintenance [27]. To cope with the climate change and achieve acceptable levels of carbon gas emissions, developed countries must develop strategies to adapt to a new pattern of economic development based on a perspective of reducing environmental damage and thus create a new and sustainable way of looking at energy [28], [29].
Despite having considerable installation costs, renewables are the key element of the new priorities of the European energy policy. The significant potential for exploration in Europe, given the large resources available, gives the European Union (EU) the possibility of creating an energy sector that can be competitive and reliable, while at the same time sustainable. In addition, other political advantages are [27]:
• Reducing dependence on energy imports; • Energy security of supply improvement; • Carbon emissions reduction.
World leaders demand an immediate reduction in the emission of polluting gases into the atmosphere, setting very ambitious targets for 2050. The EU states have already established that by 2050 gas emissions must be 80-95% below 1990 levels. Another European strategy is to reduce the same levels by 20% by 2020 [27]. For example, in Germany the high number of renewables installed is also causing changes in the system operation and influencing coal-fired power plants, traditionally the largest source of energy in that country. In 2034, the total power capacity extracted from wind and sun is predicted to be approximately 173 GW double the current peak in the country [28].
In the United States, a country known by its high energy consumption, most part of energy comes from thermal power plants (68.4%). However, according to plans for energy announced by the US Department of Energy in 2030, 20% of the country's electricity will be generated from the wind and 10% from solar photovoltaic systems [28].
Energy Storage Systems 11
2.3 Energy Storage Systems
2.3.1 The need for ESSs
The increased exploration and penetration of RESs into the network is a major step in promoting energy savings and reducing carbon emissions. Nowadays there is a great concern to integrate more RESs, in order to solve problems of great worldwide concern as [30]:
• Increased energy demand; • Reduced energy security; • High dependence on fossil fuels;
• High carbon emissions into the atmosphere.
However, the truth is that a lot of installed RES cannot be fully charged, leading to huge waste of energy [28], [31].
Although the purpose of the DGs is to supply energy to local loads, where production exceeds demand at certain times, DGs units may be interconnected to the grid thus providing excess power and causing grid stability problems [32]. Moreover, given the stochastic nature of RESs units, their high penetration into the grid can cause stability problems in network operation and control. These problems can be mitigated with the help of ESSs [30]–[33].
Thus, coordinating the integration of RESs with ESSs, as well as with the reconfiguration capability of the network, can significantly improve the system's ability to increase the penetration of RESs reliably and safely [30], [32]–[35]. After the installation of large-scale energy and performance storage technologies, electricity will become a commodity and can be stored when the generation capacity exceeds the level of consumption [28]. In addition, ESSs help to control a secure supply of energy and improve the overall stability of the electric power system [36].
2.3.2 ESSs Challenges
ESSs are a viable solution to help increase the RESs penetration into the power grid as discussed above. There are several application technologies for these systems, differing greatly in investment costs depending on the system capacity, their useful life, storage losses, efficiency and reaction times. Of all the challenges of integrating ESSs, the cost of this equipment is the one that stands out more [33].
The costs of ESS systems can be divided into two types: total capital cost (TCC) and life cycle costs (LCCs) [36]. TCC involves all costs of purchasing, installing and delivering the storage unit, including energy storage costs and energy balance costs. On the other hand, the LCC is an important indicator to evaluate and compare different ESS, since it includes all the expenses related to its operation and maintenance [36].
12 State of Art
2.3.3 Technology and Operation
To solve the problems previously presented associated with the large-scale integration of RESs, several technologies were created within the scope of the electric grid innovation - smart grid - that are implemented in the network always coordinated with the integration of RESs, in order to increase the network's capacity to integrate renewable sources. One of those technology is the so-called ESSs, which has proven to be a highly feasible solution in favor of increasing the integration of RES-based DGs units, reducing its negative side effects to the network [30], [37].
In general, ESSs technologies include 2 main areas: a power conversion system (PCS) and a power storage section. PCS is used to adjust voltage, current, and other storage characteristics, always based on load requirements [36].
Looking at the ESSs technical and economic characteristics, the different technologies can be divided into:
• Mechanical energy storage systems; • Electrochemical storage batteries; • Electromagnetic energy storage systems; • Gas energy storage system.
In addition to helping to compensate the injected power in the local load and the absorbed power from the generators [30], the ESSs implementation in the network helps to balance RESs production and demand levels by storing energy in periods of too low demand or too high production and using this stored energy to power loads when the demand is too high or the production is too low [32]–[35].
The ESSs performance mainly depends on the application requirements that are specific to each level of energy and voltage, such as power, conversion efficiency and charge and discharge times [28].
2.3.4 ESS integration: Current world position
Since ESSs must be strategically positioned, a number of countries have contributed to studies and projects in the search for new storage techniques that optimize the process. In 2013, Japan's Technological Development and New Energy Development Organization (NEDO) developed a plan for all types of ESSs techniques, with special focus on the development of lithium batteries. Late in 2014, the United States Department of Energy released relevant technical reports on the development and application of all types of advanced batteries, also with special attention to lithium batteries and advanced energy storage technologies through compressed air [28]. In the circle graph on Figure 2.3 it can be seen the installed energy storage capacity worldwide in 2016.12121212121111111111111111111111111111111111111
Restoration and Transformation of the Electric Power System 13
Figure 2.3- Installed energy storage capacity worldwide in 2016 [28].
Recently, the energy storage industry has highly grown. In December 2016, 1227 energy storage projects were conducted throughout the world, and the total installed capacity exceeded 1930 MW. In these projects, most of the systems used are based on lithium batteries (approximately 55%) [28].
2.4 Restoration and Transformation of the Electric
Power System
2.4.1 Restoration of the Electric Power System
Service failures and outages are inevitable in a distribution network. Consequently, the zone where they occur (and other zones) are momentarily out of power. DSR can be used to restore as many loads as possible by reallocating power flows without violating network operation [38]–[40].
In an electrical power system, most failures occur in the distribution network, usually resulting in the interruption of service to some consumers. Traditionally, when the failure occurs and the service stops, consumers call the respective distribution company. Upon receiving a service failure notification, a field crew is sent to search for the exact location of the fault and isolate it via manual switches, restoring the service to as many consumers as possible while repairing the failure [41]–[45]. There are 3 main factors in the origin of the occurrence of distribution network failures: tree fall, animal and atmospheric interference, as can be seen in Figure 2.4. In most current distribution networks, the restoration is done manually, with the opening and closing of switches. However, with an automated system, restoration can be performed in less time and even decrease the number of members of the field crew [7], [8], [43], [46], [47]. 55% 9% 2% 15% 7% 12% Lithium-ion battery Lead-acid battery Super capacitor Sodium-sulfur battery Flow battery Others
14 State of Art
Figure 2.4 - Accidents that cause network failure [46].
To evaluate the performance of electrical systems, some indices such as the System Average Interruption Frequency Index (SAIFI), the System Average Interruption Duration Index (SAIDI) and the Customer Average Interruption Duration Index (CAIDI) are usually used. These indices include the so-called extended service outlets, which are those that last longer than five minutes. An automated system reduces the number of these service outlets and also locates and isolates the fault automatically and almost instantaneously, thus preventing service outlets in zones that do not belong to the fault zone [42], [43], [46], [48], [49].
2.4.2 The Smart-grid and the Self-healing
Energy production in large power plants and their delivery at points of consumption constitute the classic tasks of a power grid. However, the technology advance and the evolution of the human need have raised some difficulties in terms of operation, control, efficiency and reliability, which require a change of perspective, including [50]:
• Large number of components interconnected to the distribution network; • Any failure of a component can easily affect another component instantly; • Several connections and dependencies between components and networks, which
make the creation of mathematical models a complex challenge.
The distribution network automation helps the DSR process, because it makes it possible the respond to possible problems more quickly. This reduces the number of interventions by the operator and leaves the network less subject to human error [49]. In addition, for large-scale systems with a more complex topology, the computational load of only one control center is quite high, which makes DSR decision slower, limiting the system restoration performance. The grid evolution to a smart grid, with the integration of sensor-based technology, control methods and better (bilateral) communication among network components, among others, is view has a possible solution to this complex challenge. This new grid will adopt a decentralized control method, increasing the flexibility of the network and improving DSR processes, restoration and even fault detection, coordination of protections and voltage control [20], [38], [40], [50]–[53]. The Table 2.1 shows the main differences between the traditional perspective of the network and the new way of facing the electric system - the smart grid.
29% 18% 11% 42% Tree fall Animal interference atmospheric interference Others
Switches 15
Table 2.1- Differences between the traditional network and the smart grid [20].
Traditional Grid Smart Grid
Mechanization
One-way communication
Digitization
Two-way real-time communication Centralized power generation Distributed power generation Radial Network
Less data involved
Dispersed Network
Large volumes of data involved Small number of sensors Many sensors and monitors Less or no automatic monitoring Great automatic monitoring Manual control and recovery Automatic control and recovery Less security and privacy concerns Prone to security and privacy issues Human attention to system disruptions Adaptive protection
Simultaneous production and consumption Use of storage systems
Limited control Extensive control system
Slow response to emergencies Fast response to emergencies
Fewer user choices Vast user choices
The smart-grid, when prepared with self-healing and subjected to a failure, can automatically detect it and act according to make the restoration process more quickly and automatically, improving the overall reliability of the system. The goal of self-healing is to minimize the duration of service outputs as well as interruptions felt by consumers, increasing the reliability of the system [40], [46], [51]–[53].
2.4.3 Switches
A smart grid should restore service to consumers who saw it interrupted as quickly as possible after a service exit. Remote-controlled switches (RCSs) can be operated by the system operator in the distribution center, which makes DSR much faster when compared to manual switches by field crews. Replacing manual switches by RCSs improves the restoration capacity of the network and must be done in a functional and economical way. The maximum restoration capacity must be obtained by replacing the minimum possible number of switches so as not to excessively increase the costs associated with the replacement [54]–[56].
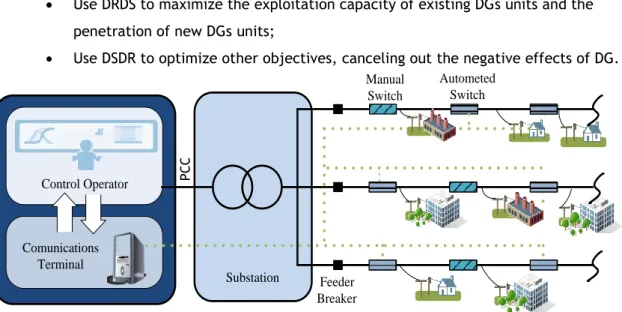
The Dynamic Reconfiguration of Distribution Systems (DRDS) consists on real-time RCS operations. To support the operation and control of the RCS's, a distribution automation system is still required, as can be seen in Figure 2.5 [56], [57].
16 State of Art
• Use DRDS to maximize the exploitation capacity of existing DGs units and the penetration of new DGs units;
• Use DSDR to optimize other objectives, canceling out the negative effects of DG.
Figure 2.5 - Distribution automation system structure.
It has been proven that RCSs bring network advantages to the flexibility of operation and speed of response to urgent and instant needs. However, it is not as simple as replacing all manual switches with RCSs: these are considerably more expensive at both installation and maintenance level. This is where the critical switch concept emerges: the ideal manual switches to be replaced by RCSs in order to optimize the cooperation with the installation of DG in the network in the most economical way possible [57].
2.5 Bibliographic Review
Existing works on system reconfiguration mainly focus on reducing energy losses as its main objective, and also distributed energy generation through renewable energy sources [3], [58]. However, in recent years, DSR has been gaining more notoriety due to the electrical networks technologic evolution, from static to dynamic networks in the sense of their smartification, both in normal system operation and in contingency mode. On the smartification side, the DSR stands out with the system automation, to make it dynamic in the perspective of an optimized operation. Similarly, the DSR in contingency operation stands out from the perspective of self-healing, being a key element for the autonomous and more efficient recovery, from the system in contingency state to a normal operating state.
In this perspective, there is a very restricted set of works on the DSR operation. Regarding the analysis of reliability indices, Paterakis et al. presents in [59] a study on system reconfiguration formulated through a multi-objective problem that aims to minimize energy losses, while also optimizing some reliability indices. In the same context, Chen et al. presents in [60] a method that analyzes some reliability indices taking into account the total
Feeder Breaker Comunications Terminal Control Operator Substation Manual Switch Autometed Switch PCC
Bibliographic Review 17
supply capacity of the distribution network, the reconfiguration of the network and the daily demand curves.1111111
111111111111111111111111111111111111111111111111111111111111
Regarding switches and their central role in system reconfiguration and restoration, several papers address optimal ways to allocate switches along system lines [61], [62]. One of the most important points about switches is the replacement of manual switches with RCS. Bernardon et al., in [15], presents a new methodology for the DSR to be done automatically, incorporating DGs units in the operation of the system and only considering RCS. The problem in this method is that it is not practical to consider all switches as RCS, since the price of replacing them all would be exorbitant. In this way, Lei et al. introduces in [57] the concept of "critical switch", which represents the minimum number of manual switches to be replaced by RCSs that will make dynamic reconfiguration more efficient. Thus, this paper studies the application of the DRDS with DGs integration and seeking to minimize energy losses, while also identifying which key switches to replace at the lowest possible cost. Despite this, Lei et al. does not solve in this work the problem of the optimal allocation of RCSs.
Therefore, after knowing how many and which switches to replace, the biggest problem lies on where to place the RCSs to maximize their performance. Lei et al. in [55], [63] have looked for new methods that allow to optimally allocate the RCSs so that the system restoration performance can be improved, as well as the overall system reliability, all at the lowest possible cost. In [55], Ray et al. defends that the optimization of the number and location of RCSs must take into account three different main objectives: to reduce the interruption cost to the consumer as much as possible, to minimize the interruption duration index (SAIDI), and to maximize the quantity of loads that can be restored using the RCSs. A model formulated as a Mixed Integer Conic Programming (MICP) is proposed that seeks to optimize the number and location of the switches so that the system restoration is automatic and as fastest as possible.
The present work focuses on two objectives: performing the DRDs while improving the system restoration capacity after a failure. Therefore, initially, the system is dynamically reconfigured, and then the goal is to identify the minimum number of switches that must be updated for RCSs to improve the system overall performance as well as the ability to restore. In addition, an analysis is also made of SAIDI and SAIFI reliability indices. A sensitivity analysis is made based on hourly reconfiguration topologies, the number of consumers affected during a fault, the power supplied to the consumer and the energy losses in the system. With this
18 State of Art
analysis, it is also intended to identify the switches that will require greater maintenance actions.
2.6 Chapter Summary
In this chapter, the state of art was structured in five main sections. The first section presents the concept of DSR, its objectives, requirements, advantages and disadvantages. The second section addresses the need to integrate renewable-based distributed generation resources, the challenges underlying this integration together with the current state of play of this resource. The third section is dedicated to ESSs, presenting the technologies that facilitate the creation of smart grids. Also, the main challenges, technologies and the current state of integration of these resources in the network are discussed in this section. The fourth section presents the problems about system restoration, and the evolution of the electrical system from static to dynamic in the perspective of the distribution network, focusing on smart-grids and self-healing. Finally, in the fifth section provides an overview of the bibliographic review, based on the works present in the literature that are related to the present work. Here the contributions of this work are also presented.
Chapter 3
Mathematical Formulation
In this chapter it is described and demonstrated the algebraic formulation of a model to make it possible to identify the minimum set of switches to be updated from manual to automatic based on dynamic reconfiguration, in the presence of renewable energy sources based distributed generators and energy storage systems. The problem is formulated as a stochastic mixed integer linear programming and it aims to minimize the total cost. In addition, the formulation to study and optimize the network different topologies taking into account different reliability indices is presented.
3.1 Objective Function
The objective of the current work is to minimize the set of switches to be updated from manual to automatic based on dynamic reconfiguration while considering the technical and economic constraints. The objective function was formulated as the sum of the most relevant cost terms (3.1), namely, the costs related to network reconfiguration (switching, 𝑆𝑊𝐶), the costs of operation ( 𝑇𝐸𝐶), the costs of emissions (𝑇𝐸𝑚𝑖𝐶) and cost of power not supplied (𝑇𝐸𝑁𝑆𝐶).
𝑀𝑖𝑛𝑇𝐶 = 𝑆𝑊𝐶 + 𝑇𝐸𝐶 + 𝑇𝐸𝑁𝑆𝐶 + 𝑇𝐸𝑚𝑖𝐶 (3.1)
The switching cost term is presented in (3.2). This equation represents the switching costs sum of all lines in the operating period (24 hours). The switching cost of a line 𝑆𝑊𝑙, at a
given time is multiplied by a binary variable that for programming reasons is divided into two 𝑦𝑙,ℎ+ and 𝑦𝑙,ℎ− allowing to count if one line change its status from the previous hour to the
20 Mathematical Formulation 𝑆𝑊𝐶 = ∑ ∑ 𝑆𝑊𝑙∗ (𝑦𝑙,ℎ+ + 𝑦𝑙,ℎ− ℎ∈Ωℎ ) 𝑙∈Ω𝑙 (3.2)
The total operation cost (3.3) is given by the sum of costs of power produced by DGs, discharged from ESSs and imported from upstream grid. In this equation 𝜌𝑠represents the
probability of a scenario to occurrence. The parameters 𝑂𝐶𝑔, 𝜆𝑒𝑠 and 𝜆ℎ
𝜍 represent the cost of
production from the DGs, the cost of discharging from ESSs and the cost of the energy that come from the upstream network over the several hours, respectively. The variables 𝑃𝑔,𝑛,𝑠,ℎ𝐷𝐺 ,
𝑃𝑒𝑠,𝑛,𝑠,ℎ𝑑𝑐ℎ and 𝑃𝜍,𝑛,𝑠,ℎ𝑆𝑆 are DGs power, ESSs discharging power and imported power from grid,
respectively. 𝑇𝐸𝐶 = ∑ 𝜌𝑠 𝑠∈Ω𝑠 ∑ ∑ 𝑂𝐶𝑔𝑃𝑔,𝑛,𝑠,ℎ𝐷𝐺 𝑔∈Ω𝑔 ℎ∈Ωℎ + ∑ 𝜌𝑠 𝑠∈Ω𝑠 ∑ ∑ 𝜆𝑒𝑠𝑃 𝑒𝑠,𝑛,𝑠,ℎ𝑑𝑐ℎ 𝑒𝑠∈Ω𝑒𝑠 ℎ∈Ωℎ + ∑ 𝜌𝑠 𝑠∈Ω𝑠 ∑ ∑ 𝜆𝜍ℎ𝑃𝜍,𝑛,𝑠,ℎ𝑆𝑆 𝜍∈Ω𝜍 ℎ∈Ωℎ (3.3)
The cost of power not supplied, given by TENSC, in (3.4), where 𝑣𝑠,ℎ𝑃 and 𝑣𝑠,ℎ
𝑄 are penalty
terms corresponding to active and reactive power demand curtailment, 𝑃𝑛,𝑠,ℎ𝑁𝑆 and 𝑄𝑛,𝑠,ℎ𝑁𝑆 are
the active e reactive unserved power.
𝑇𝐸𝑁𝑆𝐶 = ∑ 𝜌𝑠 ∑ (𝑣𝑠,ℎ𝑃 𝑃𝑛,𝑠,ℎ𝑁𝑆 + 𝑣𝑠,ℎ 𝑄 ℎ∈Ωℎ 𝑄𝑛,𝑠,ℎ𝑁𝑆 ) 𝑠∈Ω𝑠 (3.4)
Finally, equation (3.5) refers to the total cost of emissions as a result of power either supplied by DGs or imported from upstream. The first equation term is the sum of the product of emissions cost 𝜆𝐶𝑂2, emissions rate of DGs (𝐸𝑅
𝑔𝐷𝐺) and DGs power (𝑃𝑔,𝑛,𝑠,ℎ𝐷𝐺 ). The second
equation term models the expected emission costs of power imported from the grid, given by the sum of the emissions cost 𝜆𝐶𝑂2, emission rate of energy purchased (𝐸𝑅
𝜍𝑆𝑆) and energy
imported from grid (𝑃𝜍,𝑠,ℎ𝑆𝑆 ).
𝑇𝐸𝑚𝑖𝐶 = ∑ 𝜌𝑠 𝑠∈Ω𝑠 ∑ ∑ ∑ 𝜆𝐶𝑂2 𝑛∈Ω𝑛 𝐸𝑅𝑔𝐷𝐺𝑃𝑔,𝑛,𝑠,ℎ𝐷𝐺 𝑔∈Ω𝑔 ℎ∈Ωℎ + ∑ 𝜌𝑠 𝑠∈Ω𝑠 ∑ ∑ ∑ 𝜆𝐶𝑂2 𝑛∈Ω𝑛 𝐸𝑅𝜍𝑆𝑆𝑃𝜍,𝑠,ℎ𝑆𝑆 𝜍∈Ω𝜍 ℎ∈Ωℎ (3.5)
Constrains 21
3.2 Constraints
3.2.1 Kirchhoff’s Law
The sum of all incoming flows to a node should be equal to the sum of all outgoing flows, which is given by the Kirchhoff’s Law. This is applied to both active (3.6) and reactive (3.7) power flows, and must be always respected:
∑ 𝑃𝑔,𝑛,𝑠,ℎ𝐷𝐺 𝑔∈Ω𝑔 + ∑ (𝑃𝑒𝑠,𝑛,𝑠,ℎ𝑑𝑐ℎ − 𝑃𝑒𝑠,𝑛,𝑠,ℎ𝑐ℎ ) + 𝑃𝜍,𝑠,ℎ𝑆𝑆 𝑒𝑠∈Ω𝑒𝑠 + 𝑃𝑛,𝑠,ℎ𝑁𝑆 + ∑ 𝑃𝑙,𝑠,ℎ 𝑖𝑛,𝑙∈Ω𝑙 − ∑ 𝑃𝑙,𝑠,ℎ 𝑜𝑢𝑡,𝑙∈Ω𝑙 = 𝑃𝐷𝑠,ℎ𝑛 + ∑ 1 2𝑃𝐿𝑙,𝑠,ℎ 𝑖𝑛,𝑙∈Ω𝑙 + ∑ 1 2𝑃𝐿𝑙,𝑠,ℎ 𝑜𝑢𝑡,𝑙∈Ω𝑙 , ∀𝜍 ∈ 𝑖 (3.6) ∑ 𝑄𝑔,𝑛,𝑠,ℎ𝐷𝐺 𝑔∈Ω𝑔 + 𝑄𝑐,𝑛,𝑠,ℎ𝑐 + 𝑄𝜍,𝑠,ℎ𝑆𝑆 + 𝑄𝑛,𝑠,ℎ𝑁𝑆 + ∑ 𝑄𝑙,𝑠,ℎ 𝑖𝑛,𝑙∈Ω𝑙 − ∑ 𝑄𝑙,𝑠,ℎ 𝑜𝑢𝑡,𝑙∈Ω𝑙 = 𝑄𝐷𝑠,ℎ𝑛 + ∑ 1 2𝑄𝐿𝑙,𝑠,ℎ 𝑖𝑛,𝑙∈Ω𝑙 + ∑ 1 2𝑄𝐿𝑙,𝑠,ℎ 𝑜𝑢𝑡,𝑙∈Ω𝑙 ∀𝜍 ∈ 𝑖 (3.7)
In these equations 𝑃𝑙,𝑠,ℎ and 𝑄𝑙,𝑠,ℎ represent the active and reactive power flow in the line
respectively, 𝑃𝐷𝑠,ℎ𝑛 and 𝑄𝐷𝑠,ℎ𝑛 and represent the active and reactive demand at the nodes and
𝑃𝐿𝑙,𝑠,ℎ and 𝑄𝐿𝑙,𝑠,ℎ represent the active and reactive energy losses in the lines.
3.2.2 Kirchhoff’s Voltage Law
Inequalities (8) and (9) present the linearized AC power flows through each feeder, which are governed by the Kirchhoff’s Voltage Law. Note that 𝜃𝑙,𝑠,ℎ refers to the angle
difference 𝜃𝑛,𝑠,ℎ− 𝜃𝑚,𝑠,ℎ where 𝑛 and 𝑚 are bus indices corresponding to the same line 𝑙. The
process of linearization is shown in Annex A.
|𝑃𝑙,𝑠,ℎ− (𝑉𝑛𝑜𝑚(Δ𝑉𝑛,𝑠,ℎ− Δ𝑉𝑚,𝑠,ℎ)𝑔𝑘− 𝑉𝑛𝑜𝑚2 𝑏𝑘𝜃𝑙,𝑠,ℎ| ≤ 𝑀𝑃𝑙(1 − 𝜒𝑙,ℎ) (3.8)
|𝑄𝑙,𝑠,ℎ− (−𝑉𝑛𝑜𝑚(Δ𝑉𝑛,𝑠,ℎ− Δ𝑉𝑚,𝑠,ℎ)𝑏𝑘− 𝑉𝑛𝑜𝑚2 𝑔𝑘𝜃𝑙,𝑠,ℎ| ≤ 𝑀𝑄𝑙(1 − 𝜒𝑙,ℎ) (3.9)
It is important to note that, due to the reconfiguration problem, equations (3.8) and (3.9), have binary variables to make sure the flow through a given line is zero when its switching variable is zero (line is disconnected). Moreover, the introduction of those variables results in bilinear products which can result in undesirable non-linearity. For that reason, it’s important to use the big-M formulation, set to the maximum transfer capacity, to avoid the non-linearity.
22 Mathematical Formulation
3.2.3 Power Limits
The maximum amount of flow that can pass through a line is given by inequality (3.10). Equations (3.11) and (3.12) represent active and reactive power losses in a given line l.
𝑃𝑙,𝑠,ℎ2 + 𝑄𝑙,𝑠,ℎ2 ≤ 𝜒𝑙,ℎ(𝑆𝑙𝑚𝑎𝑥)2 (3.10) 𝑃𝐿𝑙,𝑠,ℎ= 𝑅𝑙(𝑃𝑙,𝑠,ℎ2 + 𝑄𝑙,𝑠,ℎ2 ) 𝑉𝑛𝑜𝑚2 (3.11) 𝑄𝐿𝑙,𝑠,ℎ= 𝑋𝑙(𝑃𝑙,𝑠,ℎ2 + 𝑄𝑙,𝑠,ℎ2 ) 𝑉𝑛𝑜𝑚2 (3.12)
3.2.4 ESSs model
ESSs are modeled by the expressions (3.13) - (3.18).
0 ≤ 𝑃𝑒𝑠,𝑛,𝑠,ℎ𝑐ℎ ≤ 𝐼𝑒𝑠,𝑛,𝑠,ℎ𝑐ℎ 𝑃𝑒𝑠,𝑛,ℎ 𝑐ℎ,𝑚𝑎𝑥 (3.13) 0 ≤ 𝑃𝑒𝑠,𝑛,𝑠,ℎ𝑑𝑐ℎ ≤ 𝐼𝑒𝑠,𝑛,𝑠,ℎ𝑑𝑐ℎ 𝑃𝑒𝑠,𝑛,ℎ 𝑐ℎ,𝑚𝑎𝑥 (3.14) 𝐼𝑒𝑠,𝑛,𝑠,ℎ𝑐ℎ + 𝐼𝑒𝑠,𝑛,𝑠,ℎ𝑐ℎ ≤ 1 (3.15) 𝐸𝑒𝑠,𝑛,𝑠,ℎ = 𝐸𝑒𝑠,𝑛,𝑠,ℎ−1+ 𝜂𝑒𝑠𝑐ℎ𝑃𝑒𝑠,𝑛,𝑠,ℎ 𝑐𝑔 − 𝑃𝑒𝑠,𝑛,𝑠,ℎ 𝑑𝑐ℎ 𝜂𝑒𝑠𝑑𝑐ℎ (3.16) 𝐸𝑒𝑠,𝑛𝑚𝑖𝑛≤ 𝐸𝑒𝑠,𝑛,𝑠,ℎ ≤ 𝐸𝑒𝑠,𝑛𝑚𝑎𝑥 (3.17) 𝐸𝑒𝑠,𝑛,𝑠,ℎ0= 𝜇𝑒𝑠𝐸𝑒𝑠,𝑛𝑚𝑎𝑥, 𝐸𝑒𝑠,𝑛,𝑠,ℎ24= 𝜇𝑒𝑠𝐸𝑒𝑠,𝑛𝑚𝑎𝑥 (3.18)
The limits on the amount of power charged and discharged are given by (3.13) and (3.14), respectively, while (3.15) guarantees that charging and discharging processes do not simultaneously happen at any given time.
The state of charge is modelled as presented in (3.16). Inequality (3.17) ensures that the storage level is always within a permissible range. Finally, (3.18) sets the initial storage level and ensures the storage is left with the same amount at the end of the operational period. For sake of simplicity, both 𝜂𝑒𝑠𝑐ℎ and 𝜂𝑒𝑠𝑑𝑐ℎ are often set equal and their efficiencies
Renewable Generation Power Limits 23
are expressed in percentage of energy at the nodes where ESSs are connected to.
3.2.5 Renewable Generation Power Limits
The active and reactive power limits of DGs are given by (3.19) and (3.20), respectively. Inequality (3.21) limits the DGs ability to inject or consume reactive power.
𝑃𝑔,𝑛,𝑠,ℎ𝐷𝐺,𝑚𝑖𝑛 ≤ 𝑃𝑔,𝑛,𝑠,ℎ𝐷𝐺 ≤ 𝑃𝑔,𝑛,𝑠,ℎ 𝐷𝐺,𝑚𝑎𝑥 (3.19) 𝑄𝑔,𝑛,𝑠,ℎ𝐷𝐺,𝑚𝑖𝑛≤ 𝑄𝑔,𝑛,𝑠,ℎ𝐷𝐺 ≤ 𝑄𝑔,𝑛,𝑠,ℎ 𝐷𝐺,𝑚𝑎𝑥 (3.20) − tan (𝑐𝑜𝑠−1(𝑝𝑓 𝑔)) 𝑃𝑔,𝑛,𝑠,ℎ𝐷𝐺 ≤ 𝑄𝑔,𝑛,𝑠,ℎ𝐷𝐺 ≤ 𝑡𝑎𝑛 (𝑐𝑜𝑠−1(𝑝𝑓𝑔)) 𝑃𝑔,𝑛,𝑠,ℎ𝐷𝐺 (3.21)
3.2.6 Conventional Generation Power Limits
The active and reactive power limits at the substations are given by (3.22) and (3.23), due to stability reasons.
𝑃𝜍,𝑠,ℎ𝑆𝑆,𝑚𝑖𝑛≤ 𝑃𝜍,𝑠,ℎ𝑆𝑆 ≤ 𝑃𝜍,𝑠,ℎ 𝑆𝑆,𝑚𝑎𝑥 (3.22) 𝑄𝜍,𝑠,ℎ 𝑆𝑆,𝑚𝑖𝑛 ≤ 𝑄𝜍,𝑠,ℎ𝑆𝑆 ≤ 𝑄𝜍,𝑠,ℎ 𝑆𝑆,𝑚𝑎𝑥 (3.23)
The reactive power that is withdrawn from the substation is subject to the bounds presented in inequality (3.24).
− tan(𝑐𝑜𝑠−1(𝑝𝑓
𝑠𝑠))𝑃𝜍,𝑠,ℎ𝑆𝑆 ≤ 𝑄𝜍,𝑠,ℎ𝑆𝑆 ≤ 𝑡𝑎𝑛(𝑐𝑜𝑠−1(𝑝𝑓𝑠𝑠))𝑃𝜍,𝑠,ℎ𝑆𝑆 (3.24)
3.2.7 Radiality Constraints
The radial operation of the considered system is guaranteed by including the constraints in (3.25) through (3.31). Constraints (3.27)—(3.31) ensure radiality in the presence of DGs, and simultaneously avoid islanding.
∑ 𝜒𝑙,ℎ 𝑙∈Ω𝑙
= 1, ∀𝑚 ∈ Ω𝐷, 𝑙 ∈ 𝑛
24 Mathematical Formulation ∑ 𝜒𝑙,ℎ 𝑖𝑛,𝑙∈Ω𝑙 − ∑ 𝜒𝑙,ℎ 𝑜𝑢𝑡,𝑙∈Ω𝑙 ≤ 1, ∀𝑚 ∉ Ω𝐷, 𝑙 ∈ 𝑛 (3.26) ∑ 𝑓𝑙,ℎ 𝑖𝑛,𝑙∈Ω𝑙 − ∑ 𝑓𝑙,ℎ 𝑜𝑢𝑡,𝑙∈Ω𝑙 = 𝑔𝑛,ℎ𝑆𝑆 − 𝑑𝑛,ℎ, ∀𝑛 ∈ Ω𝜍, 𝑙 ∈ 𝑛 (3.27) ∑ 𝑓𝑙,ℎ 𝑖𝑛,𝑙∈Ω𝑙 − ∑ 𝑓𝑙,ℎ 𝑜𝑢𝑡,𝑙∈Ω𝑙 = −1, ∀𝑛 ∈ Ω𝑔, ∀𝑛 ∈ Ω𝐷 (3.28) ∑ 𝑓𝑙,ℎ 𝑖𝑛,𝑙∈Ω𝑙 − ∑ 𝑓𝑙,ℎ 𝑜𝑢𝑡,𝑙∈Ω𝑙 = 0, ∀𝑛 ∉ Ω𝑔, ∀𝑛 ∉ Ω𝐷∀𝑛 ∉ Ω𝜍 (3.29) 0 ≤ ∑ 𝑓𝑙,ℎ 𝑖𝑛,𝑙∈Ω𝑙 + ∑ 𝑓𝑙,ℎ 𝑜𝑢𝑡,𝑙∈Ω𝑙 ≤ 𝑛𝐷𝐺, 𝑙 ∈ 𝑛 (3.30) 0 ≤ 𝑔𝑛,ℎ𝑆𝑆 ≤ 𝑛𝐷𝐺, ∀𝑛 ∈ Ω𝜍, 𝑙 ∈ 𝑛 (3.31)
3.3 Reliability Indices
In this work some reliability indices are used after the optimization processes, as a tool to make decisions on the system daily operation. The reliability indices taken into account are the System Average Interruption Frequency Index (SAIFI) and System Average Interruption Duration Index (SAIDI), which are calculated using equations (3.32) and (3.33).
3.3.1 SAIFI
SAIFI is given by the total number of consumers interruption duration by the total number of consumers, however this study focuses on the impact of branch failures to the customers served, as such this index is reformulated as (3.32).
𝑆𝐴𝐼𝐹𝐼 = (∑𝑙𝜖𝛺𝑙 𝜆𝑙∗ |𝑐𝑓𝑙|
𝑀 ) 𝑥𝑙,ℎ (3.32)
In this equation 𝜆𝑙 is the rate of the failure that affects 𝑁𝑛 customers, |𝑐𝑓𝑙| is the
number of clients supplied by line 𝑙 and 𝑀 is the total number of customers. This equation is calculated for each line and for each hour, where if 𝑥𝑙,ℎ is zero, that is, if the line is not
![Figure 1.1- Future smarter infrastructure grid technologies [1].](https://thumb-eu.123doks.com/thumbv2/123dok_br/15851532.1085649/22.892.119.732.805.1114/figure-future-smarter-infrastructure-grid-technologies.webp)
![Figure 2.2- RESs-based energy generation annual capacity [5].](https://thumb-eu.123doks.com/thumbv2/123dok_br/15851532.1085649/28.892.137.717.846.1098/figure-ress-based-energy-generation-annual-capacity.webp)
![Figure 2.3- Installed energy storage capacity worldwide in 2016 [28].](https://thumb-eu.123doks.com/thumbv2/123dok_br/15851532.1085649/33.892.193.745.190.394/figure-installed-energy-storage-capacity-worldwide.webp)
![Figure 2.4 - Accidents that cause network failure [46].](https://thumb-eu.123doks.com/thumbv2/123dok_br/15851532.1085649/34.892.248.648.130.317/figure-accidents-that-cause-network-failure.webp)
![Table 2.1- Differences between the traditional network and the smart grid [20].](https://thumb-eu.123doks.com/thumbv2/123dok_br/15851532.1085649/35.892.204.762.182.604/table-differences-traditional-network-smart-grid.webp)